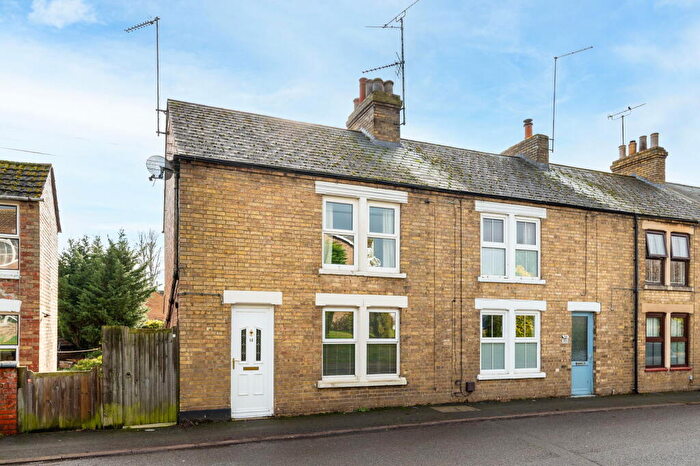
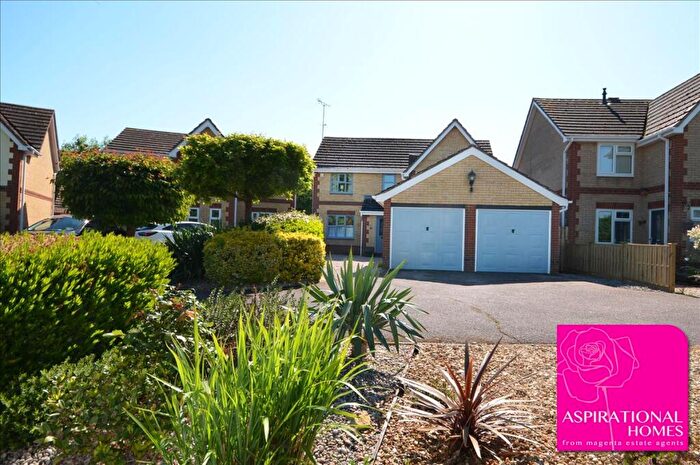
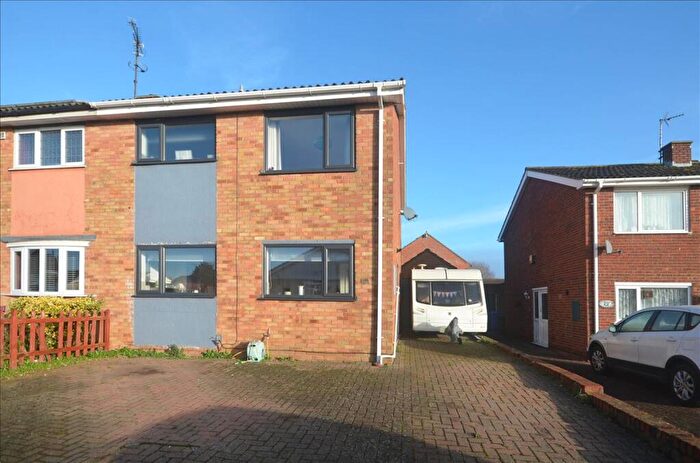
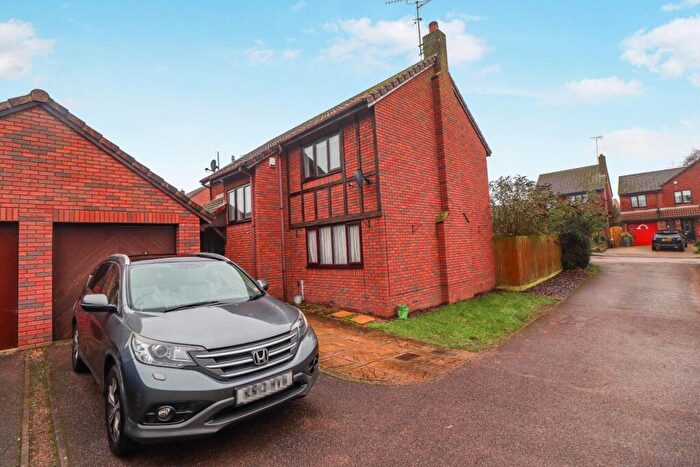
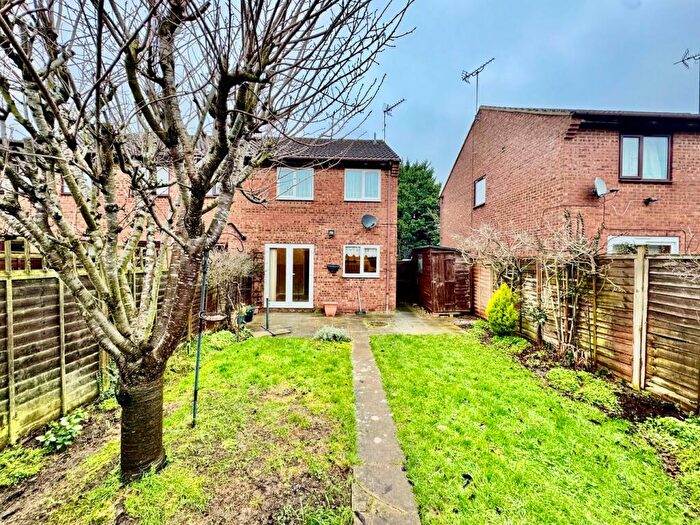
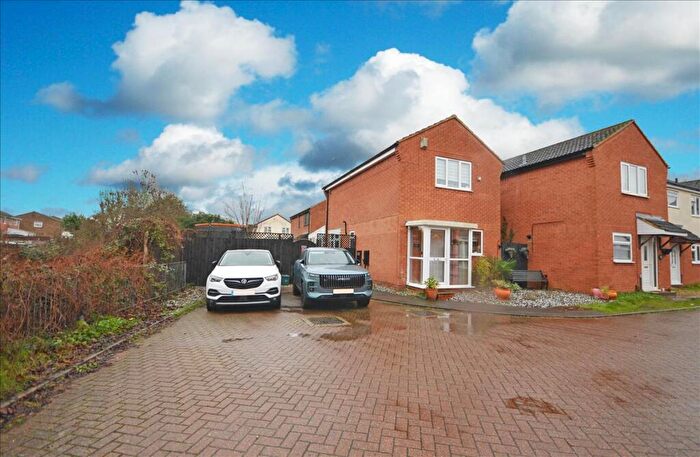
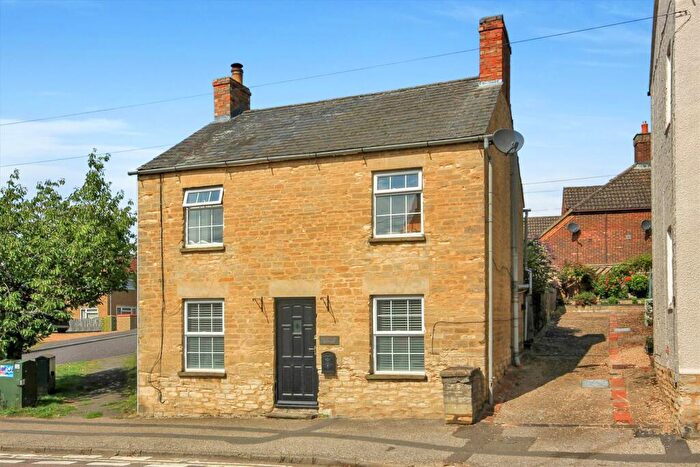
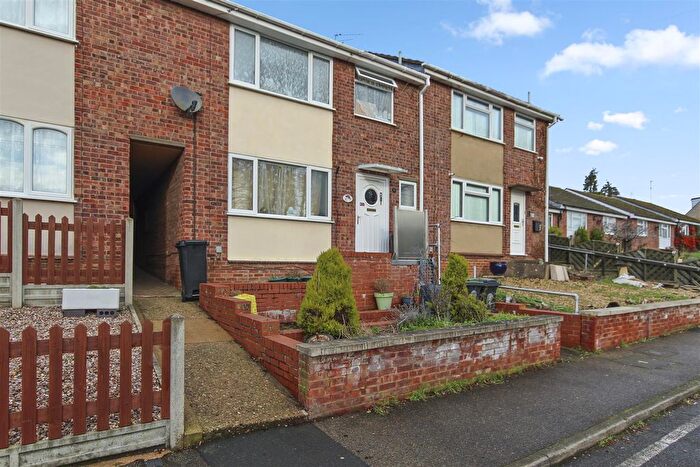
Houses for sale & to rent in Stanwick, Wellingborough
House Prices in Stanwick
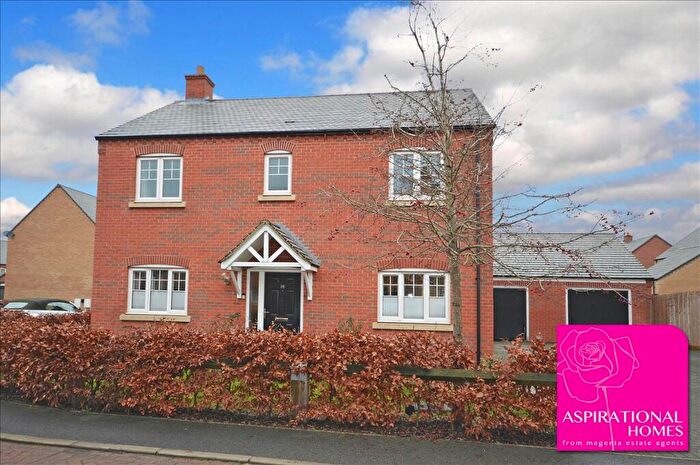
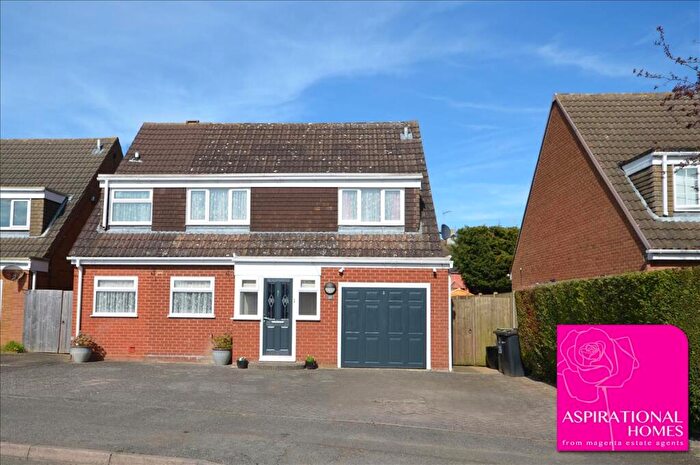
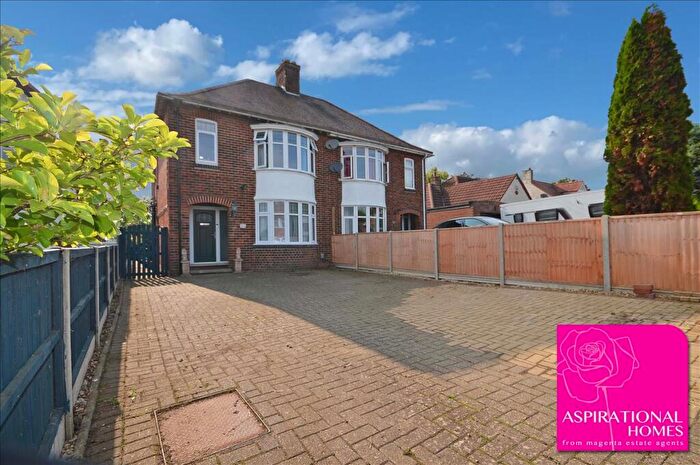
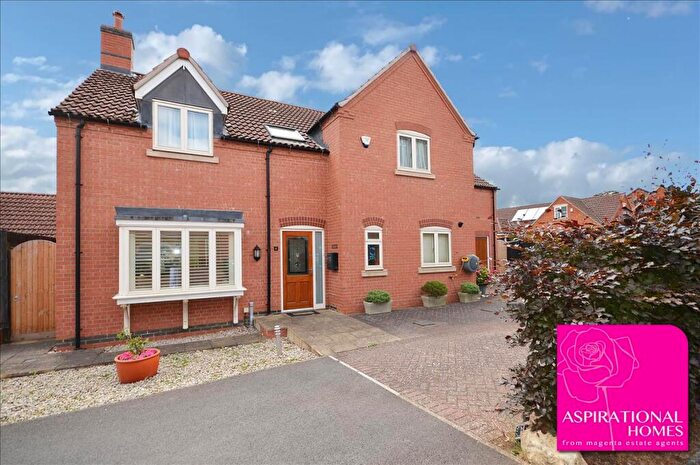
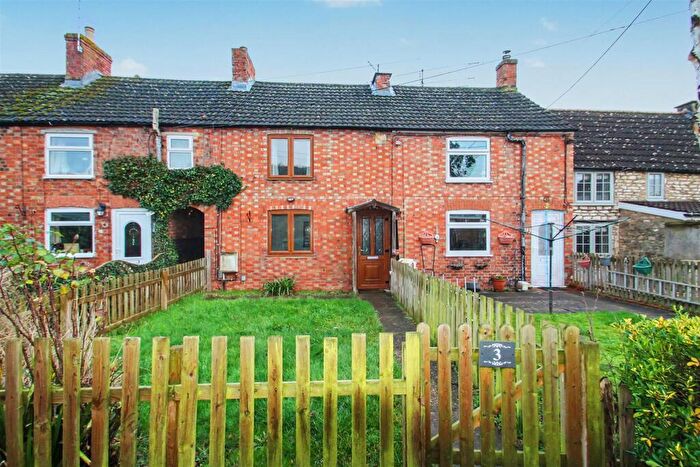
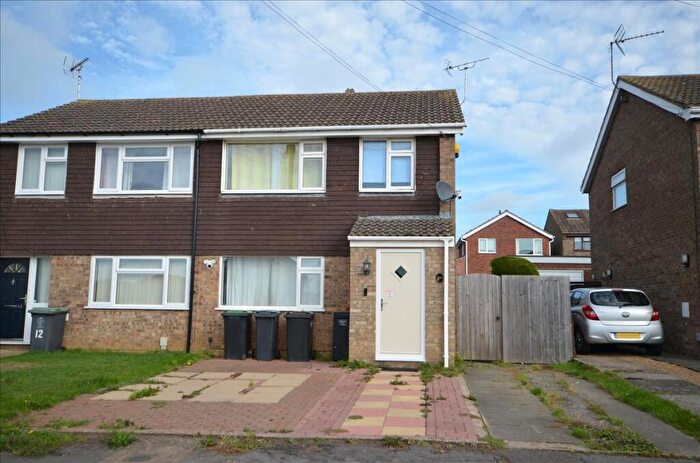
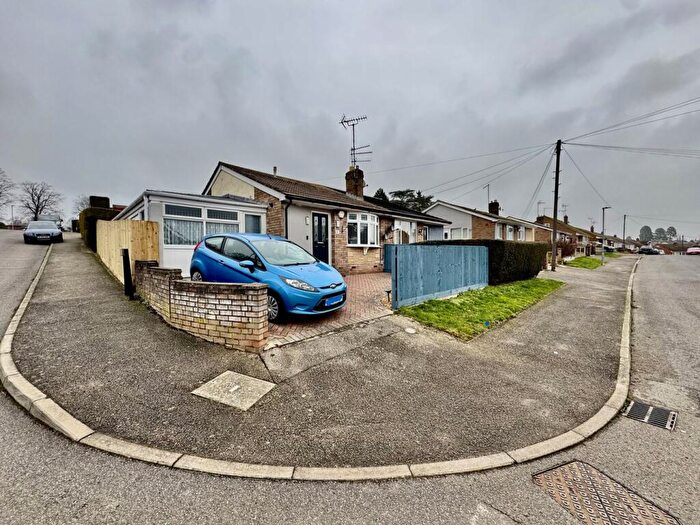
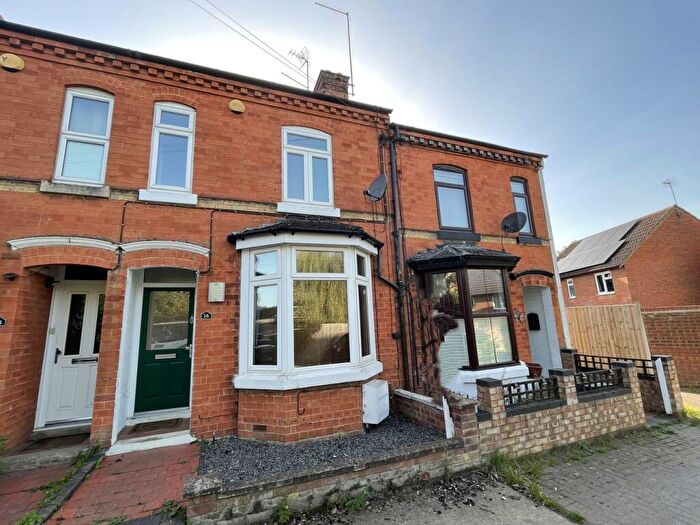
Properties in Stanwick have an average house price of £391,775.00 and had 70 Property Transactions within the last 3 years¹.
Stanwick is an area in Wellingborough, Northamptonshire with 859 households², where the most expensive property was sold for £1,520,000.00.
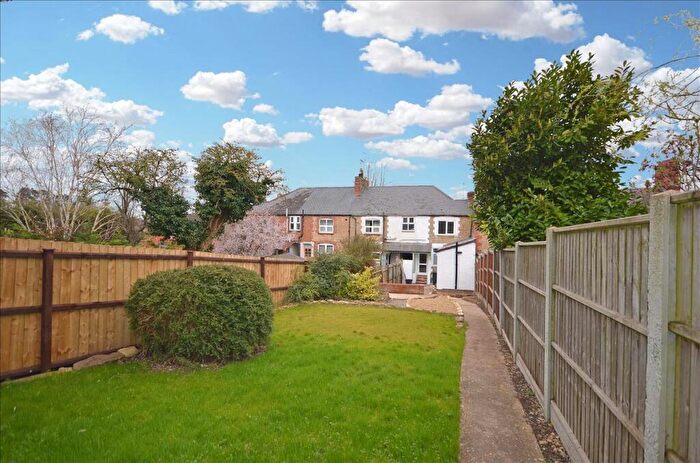
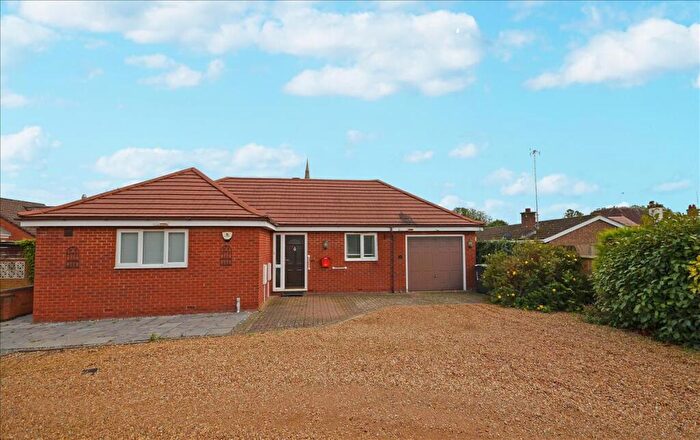
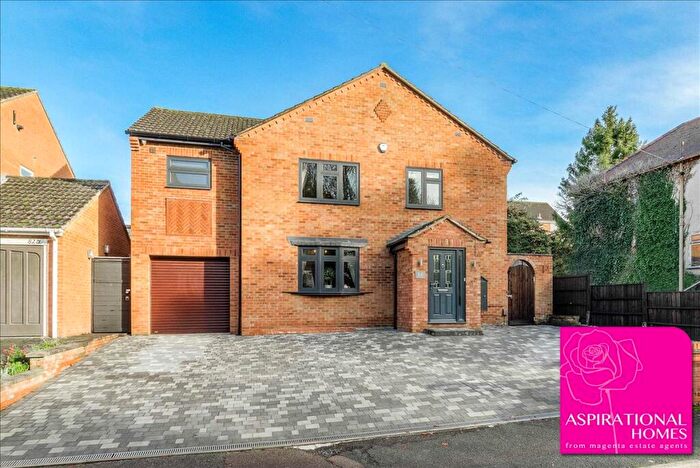
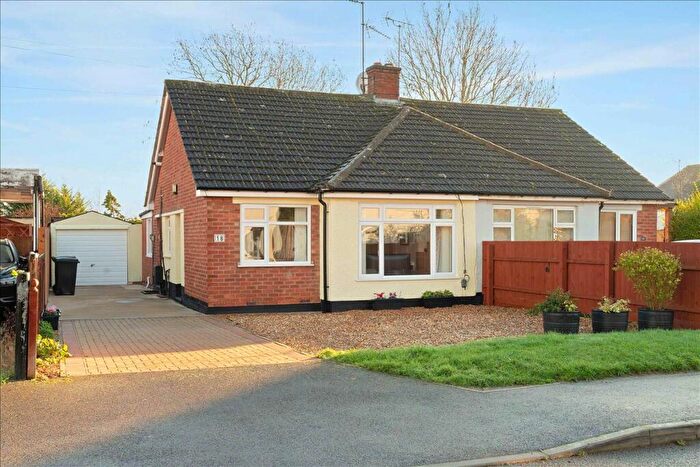
Properties for sale in Stanwick
Roads and Postcodes in Stanwick
Navigate through our locations to find the location of your next house in Stanwick, Wellingborough for sale or to rent.
| Streets | Postcodes |
|---|---|
| A45 Nene Valley Way | NN9 6QZ |
| Adams Close | NN9 6TQ |
| Alfred Street | NN9 6QT |
| Brook Street | NN9 6BP |
| Brookside | NN9 6PW |
| Casterton Close | NN9 6TJ |
| Chapel Lane | NN9 6QB |
| Chelveston Road | NN9 6PU NN9 6TZ |
| Church Road | NN9 6BQ |
| Church Street | NN9 6BW NN9 6PS |
| Cleburne Close | NN9 6TN |
| Collingham Close | NN9 6TH |
| Courtman Road | NN9 6TG |
| Courtwood | NN9 6PN |
| Cumberland Avenue | NN9 6PR |
| Dolben Avenue | NN9 6QW |
| East Street | NN9 6PX |
| Elm Close | NN9 6BH |
| Grange Road | NN9 6PZ |
| Green Lane | NN9 6QN |
| High Street | NN9 6QA |
| Higham Road | NN9 6QE NN9 6QF |
| Hill House Gardens | NN9 6QH |
| Hillstone Court | NN9 6RT |
| John Eagle Close | NN9 6AZ |
| Lovell Close | NN9 6TP |
| Manningham Road | NN9 6TF |
| Manor Gardens | NN9 6PL |
| Mansfield Street | NN9 6QP |
| Marks Close | NN9 6UB |
| Nags Head Lane | NN9 6BJ NN9 6BN |
| Needham Road | NN9 6QU |
| Newbridge Lane | NN9 6RB |
| Orchard Close | NN9 6GE |
| Parklands | NN9 6QX |
| Potter Court | NN9 6TR |
| Raunds Road | NN9 6AA NN9 6PP NN9 6BS |
| Rectory Close | NN9 6QR |
| Samuels Close | NN9 6UH |
| Spencer Parade | NN9 6QJ |
| St Laurence Way | NN9 6QS |
| The Avenue | NN9 6PT |
| The Hollow | NN9 6PY |
| The Woodlands | NN9 6QD |
| Villa Lane | NN9 6QQ |
| West Street | NN9 6QY |
| Wetenhall Road | NN9 6TE |
| NN9 6BA NN9 6BE NN9 6BG NN9 6GD |
Transport near Stanwick
-
Wellingborough Station
-
Kettering Station
-
Corby Station
-
Bedford Midland Station
-
Bedford St.Johns Station
-
St.Neots Station
- FAQ
- Price Paid By Year
- Property Type Price
Frequently asked questions about Stanwick
What is the average price for a property for sale in Stanwick?
The average price for a property for sale in Stanwick is £391,775. This amount is 50% higher than the average price in Wellingborough. There are 1,265 property listings for sale in Stanwick.
What streets have the most expensive properties for sale in Stanwick?
The streets with the most expensive properties for sale in Stanwick are Marks Close at an average of £680,000, Hillstone Court at an average of £655,000 and Higham Road at an average of £651,583.
What streets have the most affordable properties for sale in Stanwick?
The streets with the most affordable properties for sale in Stanwick are Cumberland Avenue at an average of £220,000, Lovell Close at an average of £240,500 and St Laurence Way at an average of £247,000.
Which train stations are available in or near Stanwick?
Some of the train stations available in or near Stanwick are Wellingborough, Kettering and Corby.
Property Price Paid in Stanwick by Year
The average sold property price by year was:
| Year | Average Sold Price | Price Change |
Sold Properties
|
|---|---|---|---|
| 2025 | £411,616 | 17% |
24 Properties |
| 2024 | £340,982 | -32% |
29 Properties |
| 2023 | £450,411 | 12% |
17 Properties |
| 2022 | £396,193 | 4% |
30 Properties |
| 2021 | £380,394 | 19% |
37 Properties |
| 2020 | £306,800 | -9% |
35 Properties |
| 2019 | £333,054 | 11% |
24 Properties |
| 2018 | £297,158 | 0,1% |
31 Properties |
| 2017 | £296,784 | 11% |
30 Properties |
| 2016 | £265,254 | 14% |
23 Properties |
| 2015 | £226,896 | -10% |
29 Properties |
| 2014 | £249,999 | 13% |
38 Properties |
| 2013 | £218,507 | 4% |
41 Properties |
| 2012 | £209,968 | -37% |
32 Properties |
| 2011 | £286,715 | 26% |
23 Properties |
| 2010 | £213,429 | 6% |
29 Properties |
| 2009 | £200,051 | 2% |
30 Properties |
| 2008 | £196,225 | -46% |
21 Properties |
| 2007 | £286,574 | 26% |
45 Properties |
| 2006 | £213,486 | 4% |
42 Properties |
| 2005 | £204,707 | -10% |
49 Properties |
| 2004 | £225,465 | 13% |
66 Properties |
| 2003 | £196,955 | 28% |
58 Properties |
| 2002 | £142,612 | 17% |
73 Properties |
| 2001 | £117,814 | 1% |
56 Properties |
| 2000 | £116,409 | 6% |
81 Properties |
| 1999 | £109,458 | 4% |
95 Properties |
| 1998 | £104,922 | 10% |
83 Properties |
| 1997 | £94,509 | 13% |
78 Properties |
| 1996 | £82,330 | 14% |
35 Properties |
| 1995 | £70,538 | - |
27 Properties |
Property Price per Property Type in Stanwick
Here you can find historic sold price data in order to help with your property search.
The average Property Paid Price for specific property types in the last three years are:
| Property Type | Average Sold Price | Sold Properties |
|---|---|---|
| Semi Detached House | £317,041.00 | 24 Semi Detached Houses |
| Detached House | £473,278.00 | 37 Detached Houses |
| Terraced House | £256,000.00 | 9 Terraced Houses |

