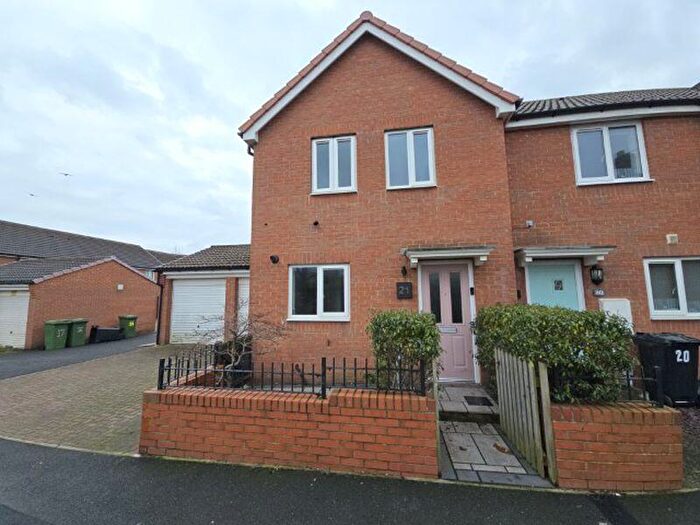
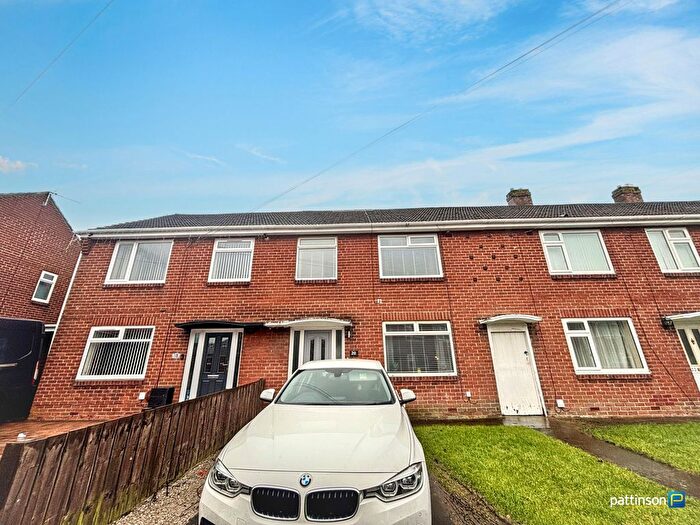
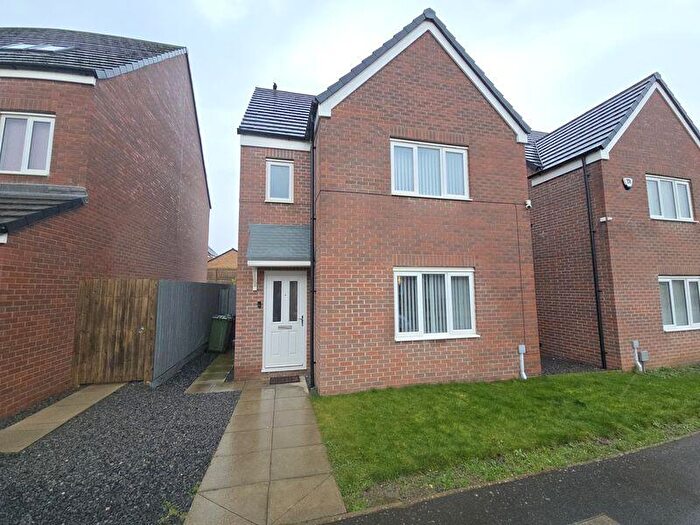
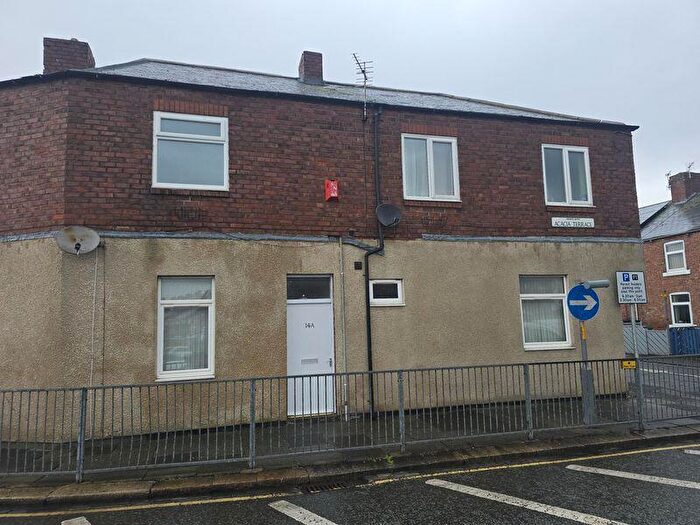
Houses for sale & to rent in Hirst, Ashington
House Prices in Hirst
Properties in Hirst have an average house price of £70,697.00 and had 210 Property Transactions within the last 3 years¹.
Hirst is an area in Ashington, Northumberland with 2,317 households², where the most expensive property was sold for £330,000.00.
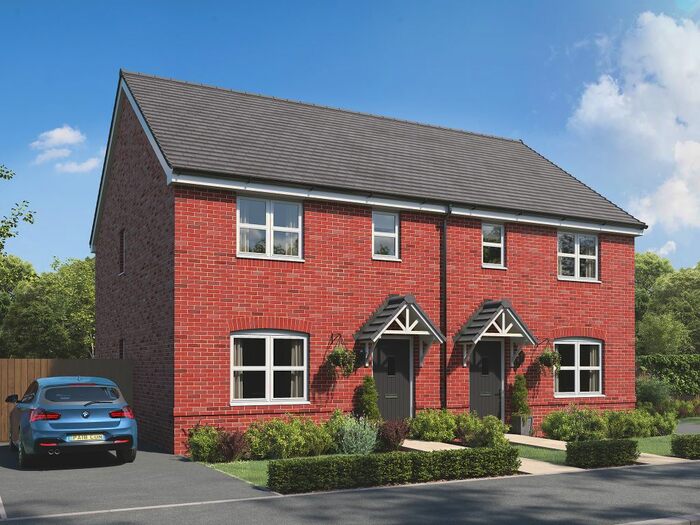
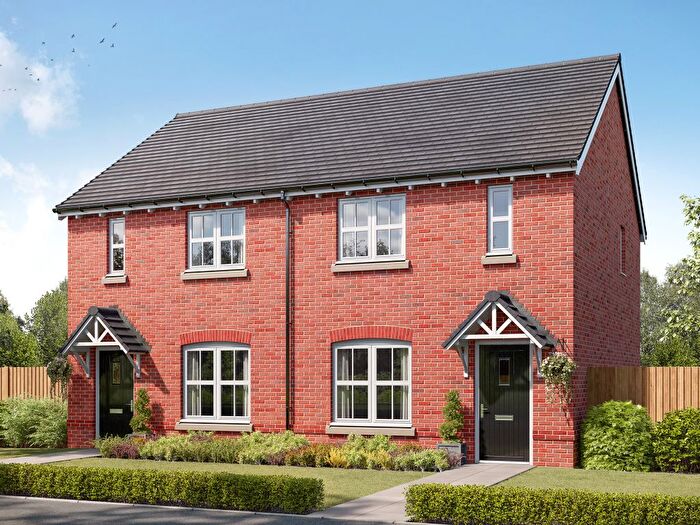
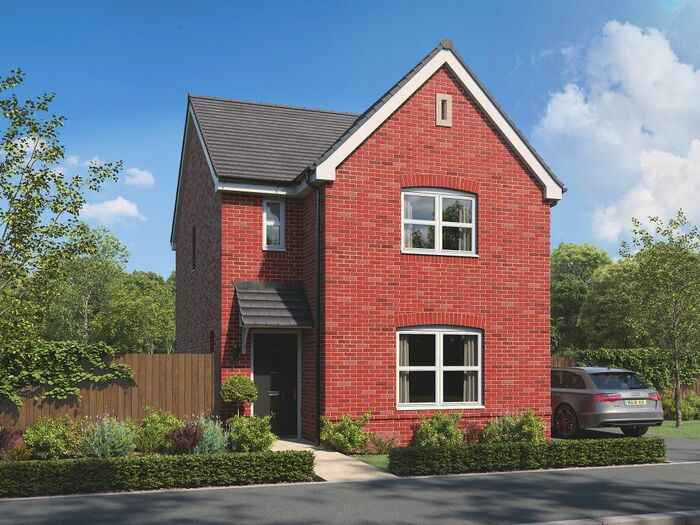
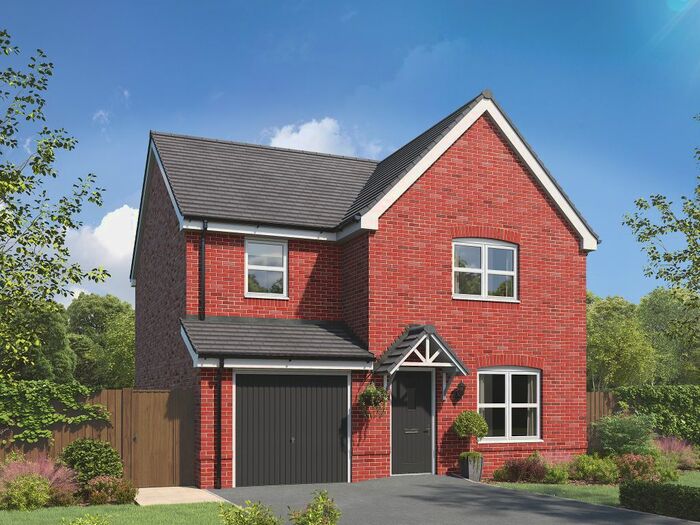
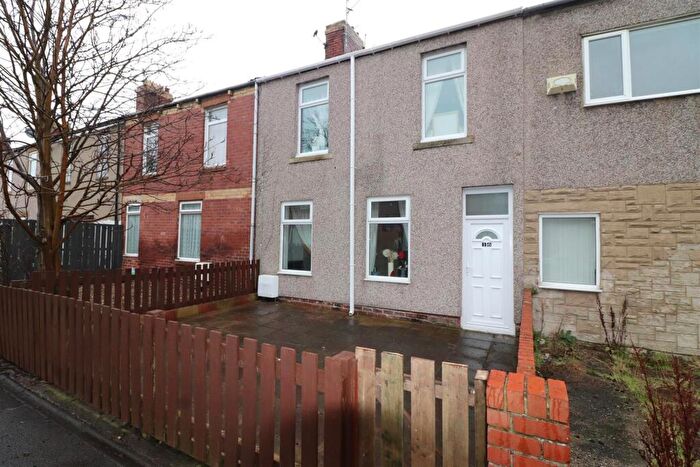
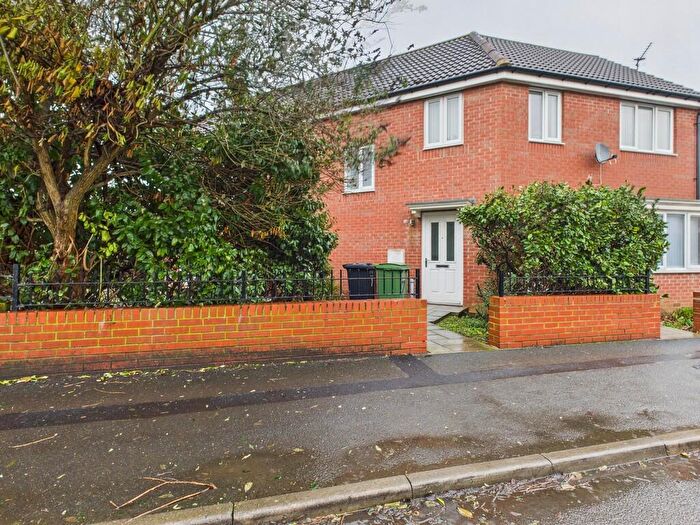
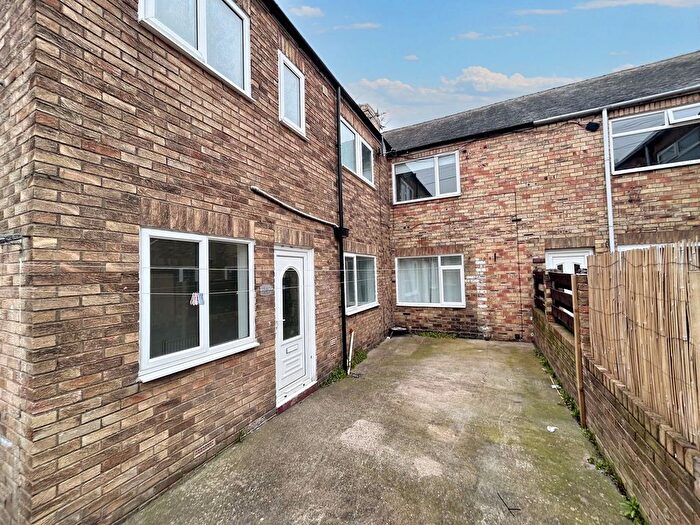
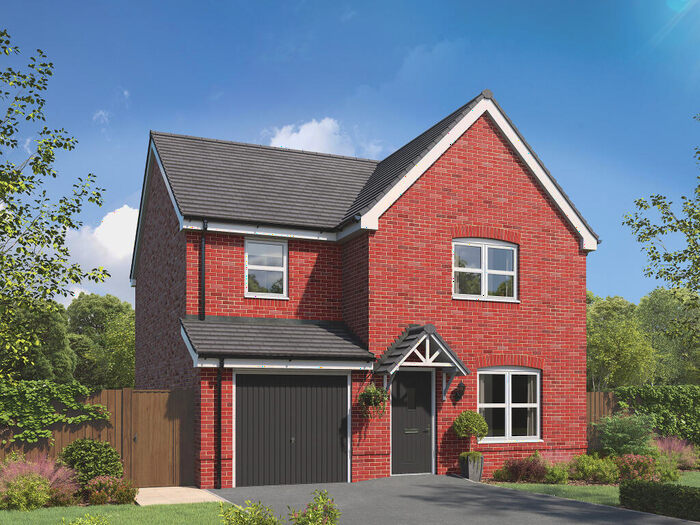
Properties for sale in Hirst
Roads and Postcodes in Hirst
Navigate through our locations to find the location of your next house in Hirst, Ashington for sale or to rent.
| Streets | Postcodes |
|---|---|
| Aged Miners Homes | NE63 9YG |
| Alexandra Road | NE63 9EF NE63 9HG NE63 9HH NE63 9HQ NE63 9LA NE63 9LB NE63 9HN |
| Aln Street | NE63 9HY NE63 9JA |
| Ariel Street | NE63 9EB NE63 9EZ NE63 9HA NE63 9NG NE63 9NQ |
| Ashfield Mews | NE63 9GJ |
| Beatrice Street | NE63 9BL NE63 9BP NE63 9BS NE63 9BT |
| Berrymoor | NE63 9EP |
| Blyth Terrace | NE63 9HW |
| Brinkburn Crescent | NE63 9LF |
| Castle Terrace | NE63 9BX NE63 9EY NE63 9JH NE63 9JQ |
| Catcleugh Walk | NE63 9FT |
| Chestnut Street | NE63 0BP NE63 0BS |
| Cheviot View | NE63 9ER |
| Coneygarth Place | NE63 9FL |
| Coquet Street | NE63 9HL NE63 9HR |
| Ellington Road | NE63 9XS |
| Fontburn Crescent | NE63 9LD |
| George Street | NE63 9HJ |
| Harrogate Court | NE63 9FJ |
| Hawthorn Road | NE63 0QX NE63 0SP NE63 0SW NE63 9AU NE63 9BG NE63 9BH NE63 9BQ |
| Hebron Place | NE63 9LE |
| Hindmarsh Drive | NE63 9FA |
| Hirst Castle Mews | NE63 9FR |
| Howard Walk | NE63 9FP |
| Hudson Walk | NE63 9FN |
| Juliet Street | NE63 9DY NE63 9DZ NE63 9EA |
| Katherine Street | NE63 9BU NE63 9DJ NE63 9DN NE63 9DW |
| Kidland Close | NE63 9LT |
| Marshall Close | NE63 9FQ |
| Moor House Lane | NE63 9LJ |
| Patterson Way | NE63 9FH |
| Percy Street | NE63 9HT |
| Portia Street | NE63 9DL NE63 9DT NE63 9DU NE63 9DX |
| Queen Street | NE63 9HS |
| Reiverdale Road | NE63 9GH NE63 9YY |
| Rosalind Street | NE63 9BJ NE63 9BN NE63 9BW |
| St Andrews Terrace | NE63 9DR NE63 9BD |
| St Christophers Close | NE63 9DG |
| St Nicholas Close | NE63 9BY |
| St Pauls Close | NE63 9BZ |
| Third Avenue | NE63 9DP NE63 9DS NE63 9BE |
| Tosson Place | NE63 9LG |
| Tweed Street | NE63 9HP NE63 9HU NE63 9HZ |
| Tyne Street | NE63 9HX |
| Welfare Crescent | NE63 9LH NE63 9LQ |
| Windy Gyle | NE63 9EL |
| Woodhorn Colliery Houses | NE63 9YF |
| Woodhorn Court | NE63 9AH |
| Woodhorn Lane | NE63 9FW NE63 9GZ |
| Woodhorn Road | NE63 9AN NE63 9AR NE63 9AS NE63 9EN NE63 9ES NE63 9ET NE63 9EU NE63 9EW NE63 9EX |
| Woodhorn Road Back | NE63 9UY |
| Woodhorn Villas | NE63 9JD NE63 9JE NE63 9JF NE63 9JG |
| NE63 9AT NE63 9BA NE63 9LS NE63 9NL NE63 9WP NE63 9YQ NE63 0BR |
Transport near Hirst
- FAQ
- Price Paid By Year
- Property Type Price
Frequently asked questions about Hirst
What is the average price for a property for sale in Hirst?
The average price for a property for sale in Hirst is £70,697. This amount is 42% lower than the average price in Ashington. There are 2,191 property listings for sale in Hirst.
What streets have the most expensive properties for sale in Hirst?
The streets with the most expensive properties for sale in Hirst are Woodhorn Court at an average of £289,000, Coneygarth Place at an average of £162,600 and Cheviot View at an average of £157,500.
What streets have the most affordable properties for sale in Hirst?
The streets with the most affordable properties for sale in Hirst are Queen Street at an average of £33,000, George Street at an average of £41,749 and Juliet Street at an average of £45,538.
Which train stations are available in or near Hirst?
Some of the train stations available in or near Hirst are Pegswood, Widdrington and Morpeth.
Property Price Paid in Hirst by Year
The average sold property price by year was:
| Year | Average Sold Price | Price Change |
Sold Properties
|
|---|---|---|---|
| 2025 | £73,896 | 10% |
65 Properties |
| 2024 | £66,532 | -12% |
94 Properties |
| 2023 | £74,296 | 4% |
51 Properties |
| 2022 | £71,458 | 8% |
126 Properties |
| 2021 | £65,388 | 11% |
91 Properties |
| 2020 | £57,964 | 12% |
53 Properties |
| 2019 | £50,924 | -18% |
79 Properties |
| 2018 | £60,229 | 7% |
75 Properties |
| 2017 | £55,965 | -7% |
79 Properties |
| 2016 | £60,093 | 1% |
72 Properties |
| 2015 | £59,240 | -2% |
75 Properties |
| 2014 | £60,682 | 11% |
65 Properties |
| 2013 | £54,296 | -11% |
47 Properties |
| 2012 | £60,377 | 13% |
31 Properties |
| 2011 | £52,240 | -36% |
48 Properties |
| 2010 | £70,904 | 7% |
39 Properties |
| 2009 | £65,628 | -22% |
45 Properties |
| 2008 | £79,821 | -17% |
75 Properties |
| 2007 | £93,415 | 8% |
222 Properties |
| 2006 | £85,741 | 1% |
213 Properties |
| 2005 | £84,586 | 19% |
171 Properties |
| 2004 | £68,157 | 40% |
170 Properties |
| 2003 | £40,916 | 27% |
169 Properties |
| 2002 | £29,825 | 25% |
132 Properties |
| 2001 | £22,319 | -4% |
100 Properties |
| 2000 | £23,142 | 3% |
68 Properties |
| 1999 | £22,441 | -1% |
60 Properties |
| 1998 | £22,701 | 5% |
62 Properties |
| 1997 | £21,673 | -1% |
42 Properties |
| 1996 | £21,828 | -7% |
63 Properties |
| 1995 | £23,417 | - |
44 Properties |
Property Price per Property Type in Hirst
Here you can find historic sold price data in order to help with your property search.
The average Property Paid Price for specific property types in the last three years are:
| Property Type | Average Sold Price | Sold Properties |
|---|---|---|
| Semi Detached House | £132,796.00 | 15 Semi Detached Houses |
| Detached House | £216,333.00 | 3 Detached Houses |
| Terraced House | £66,256.00 | 173 Terraced Houses |
| Flat | £39,111.00 | 19 Flats |

