
Houses for sale & to rent in Haydon, Ashington
House Prices in Haydon
Properties in Haydon have an average house price of £157k and had 198 Property Transactions within the last 3 years¹.
Haydon is an area in Ashington, Northumberland with 1,944 households², where the most expensive property was sold for £450k.
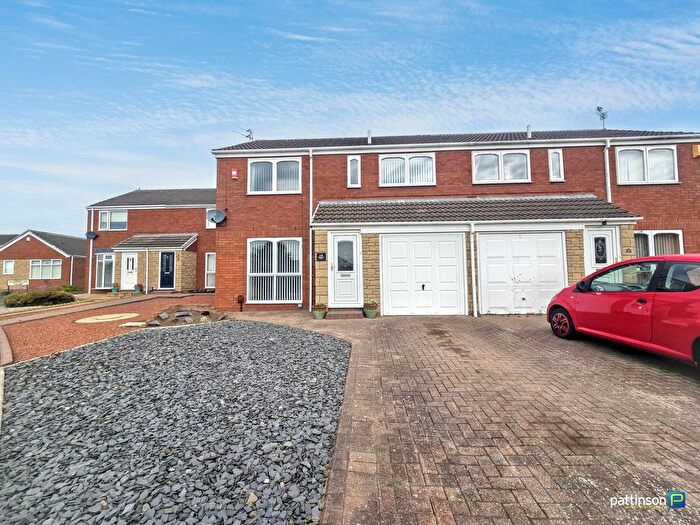
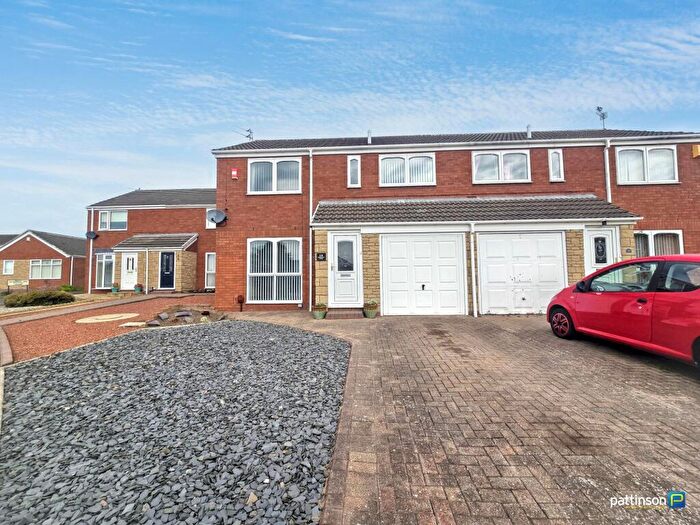
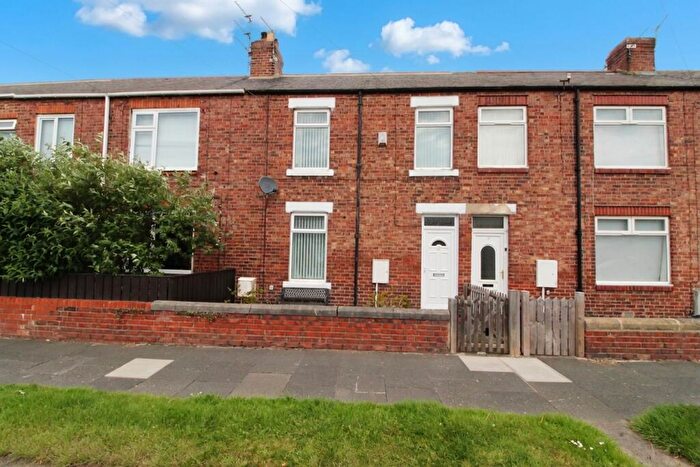
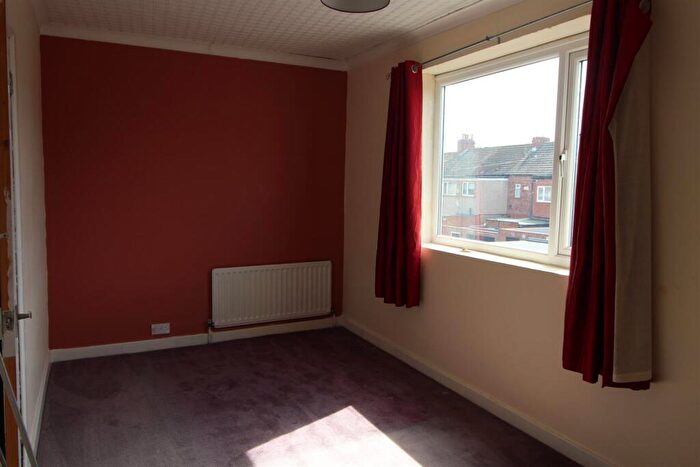
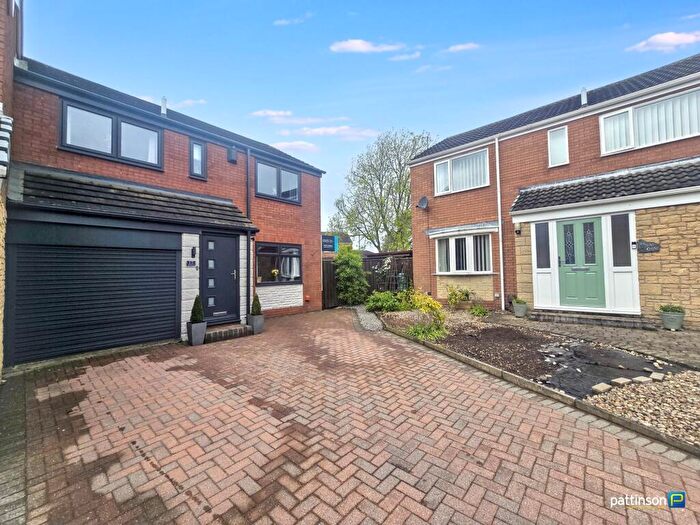
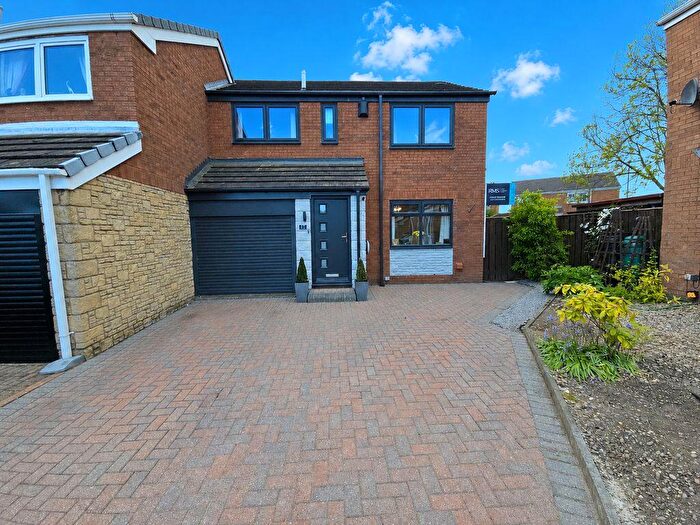
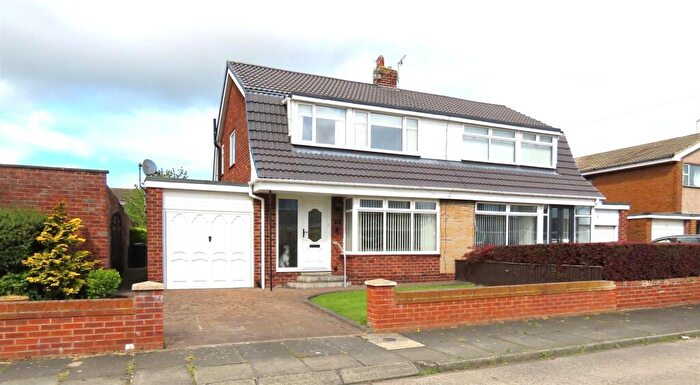
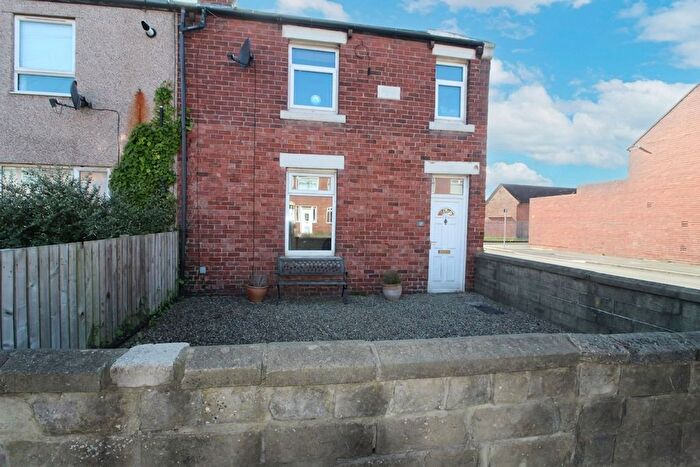
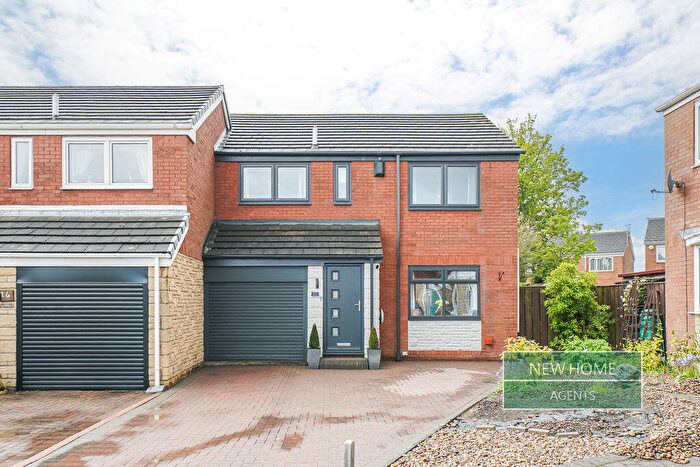
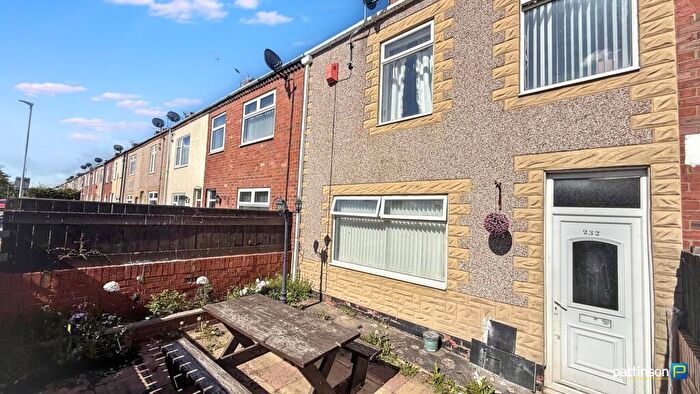
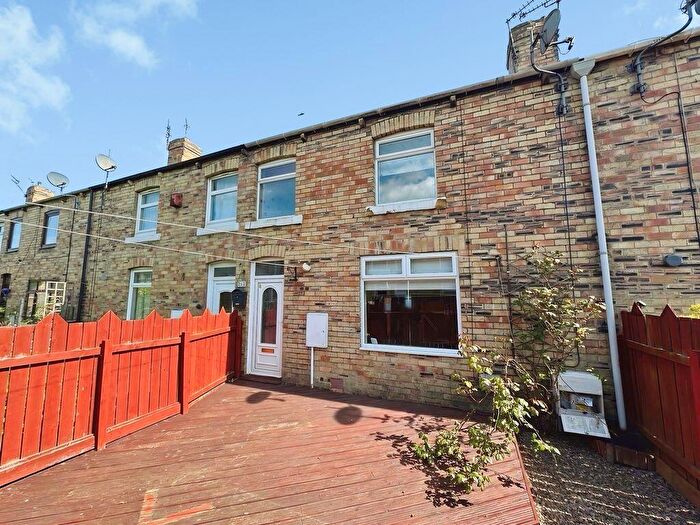
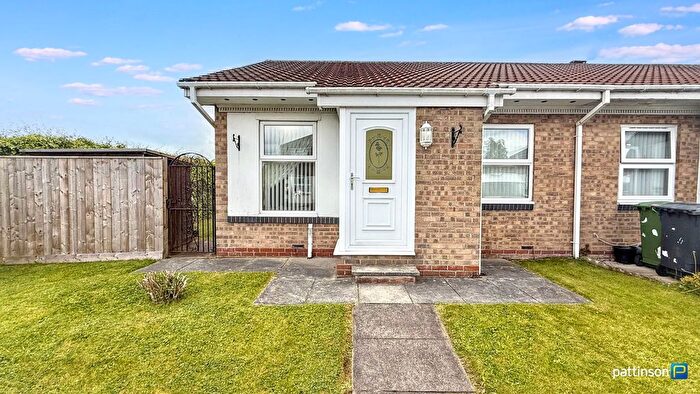
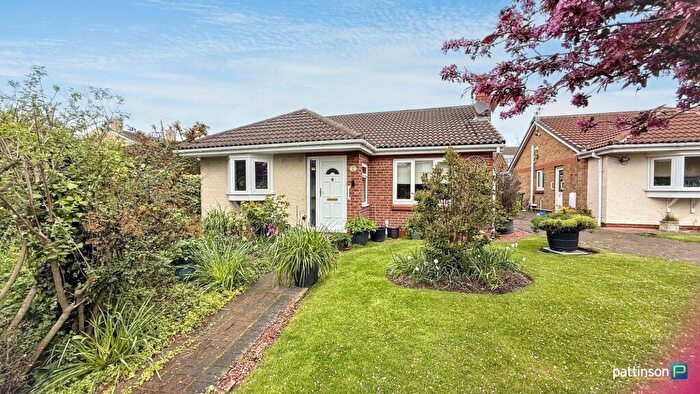
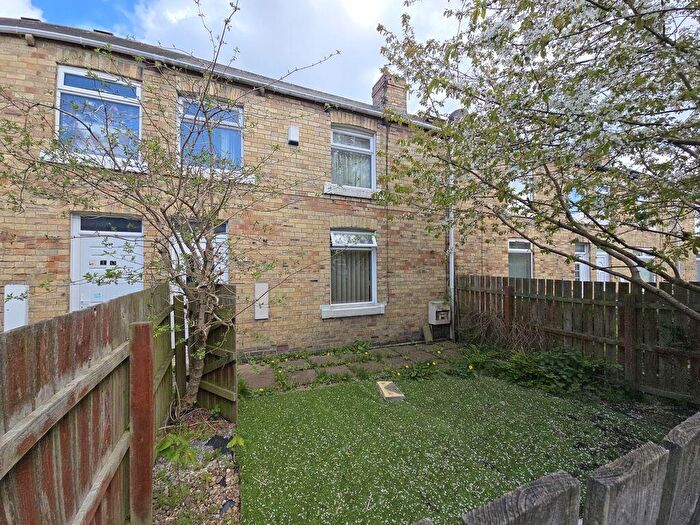
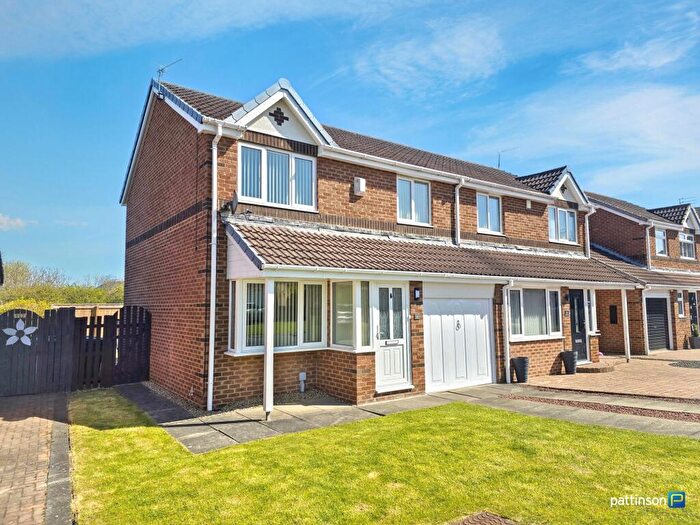
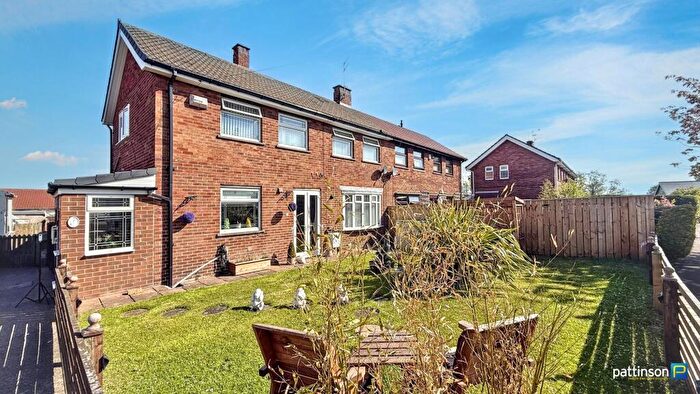
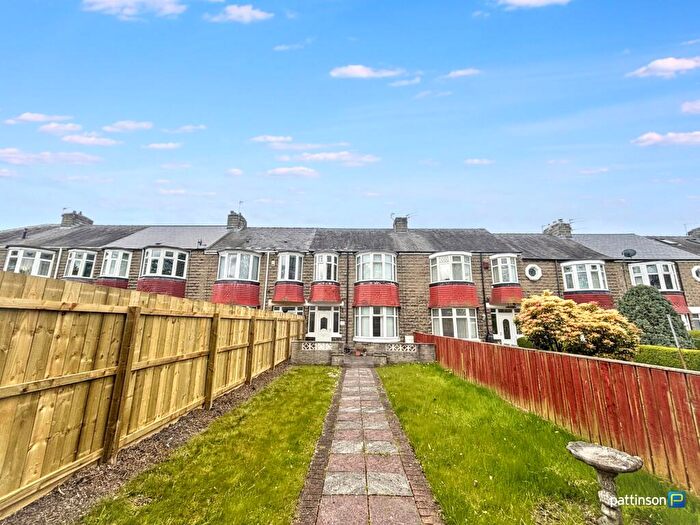
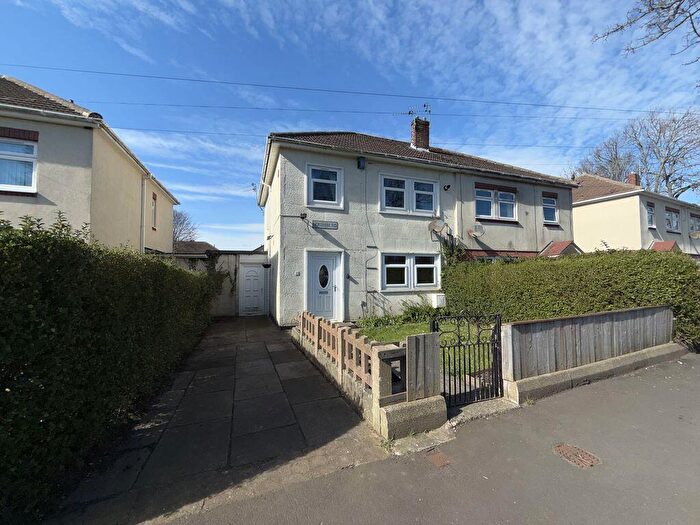
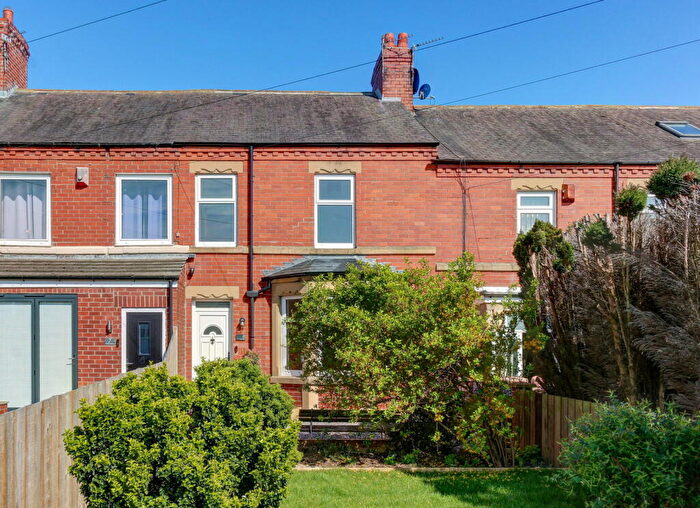
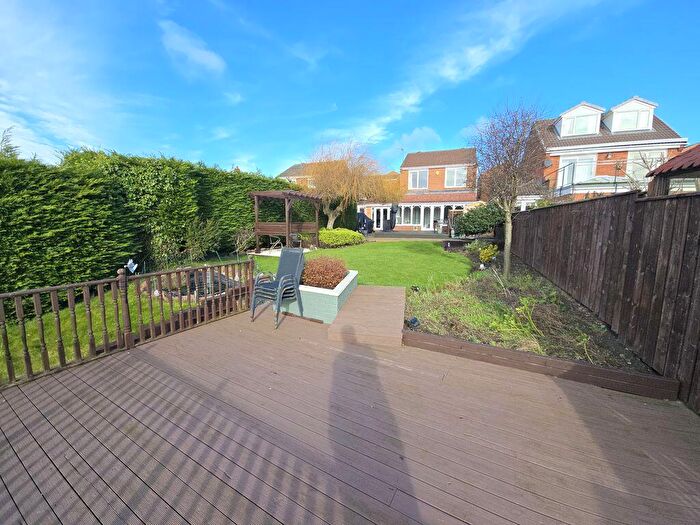
Properties for sale in Haydon
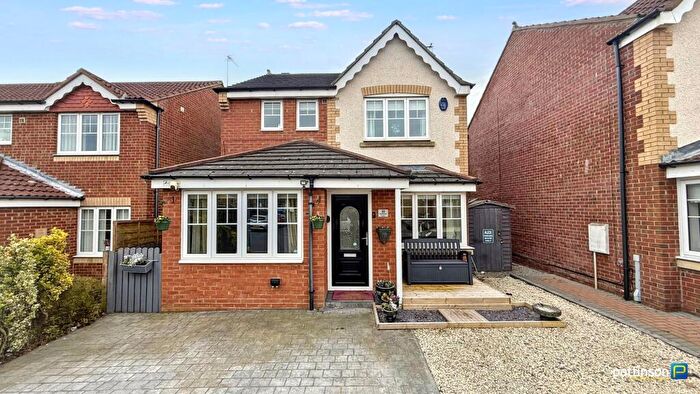
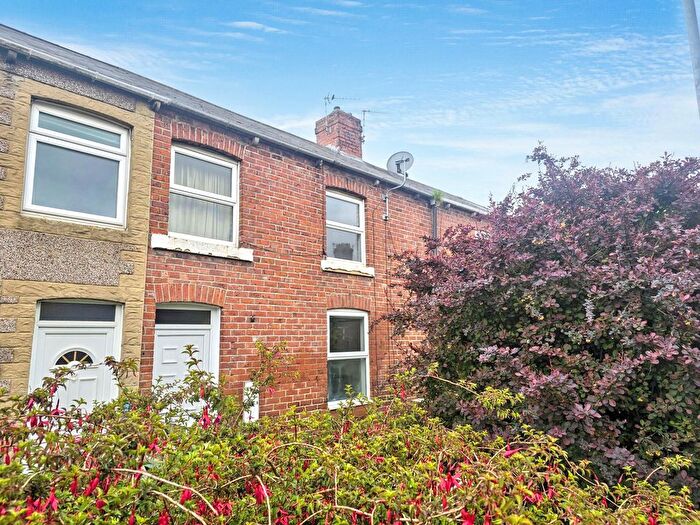
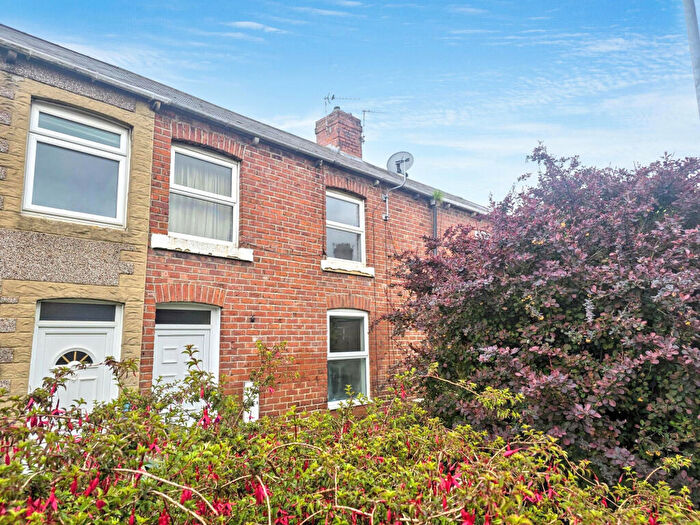
![]()
If you are looking to sell your house, let it out, or receive a property valuation, an expert can help you.
Click the button below to get started.

Roads and Postcodes in Haydon
Navigate through our locations to find the location of your next house in Haydon, Ashington for sale or to rent.
| Streets | Postcodes |
|---|---|
| Aintree Close | NE63 8NB |
| Alderwood | NE63 8EJ |
| Ascot Grove | NE63 8NR |
| Black Close | NE63 8TE |
| Black Close Bank | NE63 8TF |
| Blackthorn Way | NE63 8NW |
| Bowman Square | NE63 0LW |
| Briardene | NE63 8DU |
| Brockwood Close | NE63 8LT |
| Burnet Court | NE63 8ET |
| Bywell Road | NE63 0LE NE63 0LN NE63 0LQ |
| Campion Way | NE63 8JG |
| Celandine Court | NE63 8EU |
| Cheltenham Court | NE63 8NF |
| Cormorant Close | NE63 0DP |
| Coronation Terrace | NE63 0TJ |
| Cranemarsh Close | NE63 8NL |
| Curlew Close | NE63 0DG |
| Cygnet Close | NE63 0DF |
| Dilston Drive | NE63 0LH |
| Epsom Drive | NE63 8NA |
| Falcon Court | NE63 8JR |
| Farne Avenue | NE63 0LS |
| Felton Terrace | NE63 0LJ |
| Ford Avenue | NE63 0LL |
| Glenwood | NE63 8EL |
| Goodwood Court | NE63 8NP |
| Grebe Close | NE63 0DW |
| Green Croft | NE63 8EF NE63 8EG |
| Green Lane | NE63 8EQ NE63 0EY NE63 8EH |
| Grousemoor Drive | NE63 8LU |
| Harelaw Drive | NE63 8LS |
| Hartford Crescent | NE63 0LD |
| Hartside Court | NE63 8BU |
| Hawksmoor Close | NE63 8NN |
| Haydon Road | NE63 0JT NE63 0JU NE63 0JX |
| Heron Close | NE63 0DA |
| Holmdale | NE63 8DX NE63 8ED |
| Jasmine Court | NE63 8XA |
| Jubilee Estate | NE63 8SY NE63 8SZ NE63 8TA NE63 8TB NE63 8TD |
| Jubilee Industrial Estate | NE63 8UA NE63 8UB NE63 8UG NE63 8UQ |
| Kestrel Drive | NE63 8JS |
| Kingfisher Close | NE63 0DL |
| Larchwood Drive | NE63 9FG |
| Laurel Drive | NE63 9FF |
| Lavender Court | NE63 9FE |
| Lennep Way | NE63 8UL |
| Lesbury Avenue | NE63 0LP |
| Lilac Court | NE63 9FB |
| Lyncroft | NE63 8EN |
| Magnolia Drive | NE63 9FD |
| Mallard Close | NE63 0DE |
| Milburn Road | NE63 0NA NE63 0NB NE63 0ND NE63 0NE NE63 0NF |
| Mitford Drive | NE63 0LR |
| Newbiggin Road | NE63 0SY NE63 0TA NE63 0TB NE63 0SZ |
| Norham Road | NE63 0LF NE63 0LT NE63 0LU NE63 0NG |
| North Seaton Road | NE63 0JN NE63 0JR NE63 0JS NE63 0EF NE63 8ST |
| Nursery Park | NE63 0DH NE63 0DQ NE63 0HP |
| Orchid Close | NE63 8JL |
| Orpine Court | NE63 8JQ |
| Ploverfield Close | NE63 8LX |
| Primrose Court | NE63 8ES |
| Remscheid Way | NE63 8UJ |
| Rothley Avenue | NE63 0LG |
| Rowlington Terrace | NE63 0LX NE63 0LY NE63 0LZ |
| Sandmartin Close | NE63 0DJ |
| Sandpiper Way | NE63 0DB |
| Shallon Court | NE63 8JJ |
| Sorrel Close | NE63 8JH |
| Speedwell Court | NE63 8EY |
| Stonecross | NE63 8EE |
| Swallow Close | NE63 0DN |
| Titchfield Terrace | NE63 0JP |
| Valerian Court | NE63 8EX |
| Warren Court | NE63 8LL |
| Waterford Green | NE63 0DD |
| Welbeck Terrace | NE63 0JW |
| Wetherby Close | NE63 8NJ |
Transport near Haydon

- FAQ
- Price Paid By Year
- Property Type Price
Frequently asked questions about Haydon
What is the average price for a property for sale in Haydon?
The average price for a property for sale in Haydon is £157,347. This amount is 28% higher than the average price in Ashington. There are 1,242 property listings for sale in Haydon.
What streets have the most expensive properties for sale in Haydon?
The streets with the most expensive properties for sale in Haydon are Kestrel Drive at an average of £420,000, Laurel Drive at an average of £320,000 and Sandmartin Close at an average of £308,750.
What streets have the most affordable properties for sale in Haydon?
The streets with the most affordable properties for sale in Haydon are Green Croft at an average of £72,666, Alderwood at an average of £81,000 and Holmdale at an average of £85,000.
Which train stations are available in or near Haydon?
Some of the train stations available in or near Haydon are Pegswood, Morpeth and Widdrington.
Property Price Paid in Haydon by Year
The average sold property price by year was:
| Year | Average Sold Price | Price Change |
Sold Properties
|
|---|---|---|---|
| 2026 | £216,696 | 24% |
7 Properties |
| 2025 | £165,657 | 8% |
69 Properties |
| 2024 | £151,841 | 4% |
65 Properties |
| 2023 | £146,278 | -6% |
57 Properties |
| 2022 | £154,825 | 7% |
64 Properties |
| 2021 | £143,613 | 4% |
80 Properties |
| 2020 | £137,471 | 4% |
53 Properties |
| 2019 | £131,397 | 1% |
54 Properties |
| 2018 | £130,696 | 8% |
78 Properties |
| 2017 | £119,963 | 7% |
65 Properties |
| 2016 | £111,242 | -17% |
58 Properties |
| 2015 | £130,187 | 21% |
61 Properties |
| 2014 | £102,637 | -14% |
71 Properties |
| 2013 | £116,706 | 8% |
50 Properties |
| 2012 | £107,503 | -9% |
46 Properties |
| 2011 | £117,533 | 3% |
51 Properties |
| 2010 | £114,330 | -4% |
41 Properties |
| 2009 | £119,154 | -15% |
45 Properties |
| 2008 | £137,062 | 4% |
43 Properties |
| 2007 | £131,548 | - |
92 Properties |
| 2006 | £131,512 | 10% |
93 Properties |
| 2005 | £117,854 | -1% |
80 Properties |
| 2004 | £118,580 | 23% |
96 Properties |
| 2003 | £91,229 | 19% |
100 Properties |
| 2002 | £74,183 | 8% |
107 Properties |
| 2001 | £68,144 | 2% |
196 Properties |
| 2000 | £66,642 | 23% |
165 Properties |
| 1999 | £51,262 | -1% |
89 Properties |
| 1998 | £51,789 | -2% |
68 Properties |
| 1997 | £52,618 | 9% |
94 Properties |
| 1996 | £47,672 | 2% |
93 Properties |
| 1995 | £46,823 | - |
64 Properties |
Property Price per Property Type in Haydon
Here you can find historic sold price data in order to help with your property search.
The average Property Paid Price for specific property types in the last three years are:
| Property Type | Average Sold Price | Sold Properties |
|---|---|---|
| Semi Detached House | £153,780.00 | 60 Semi Detached Houses |
| Detached House | £256,375.00 | 51 Detached Houses |
| Terraced House | £102,648.00 | 83 Terraced Houses |
| Flat | £83,250.00 | 4 Flats |