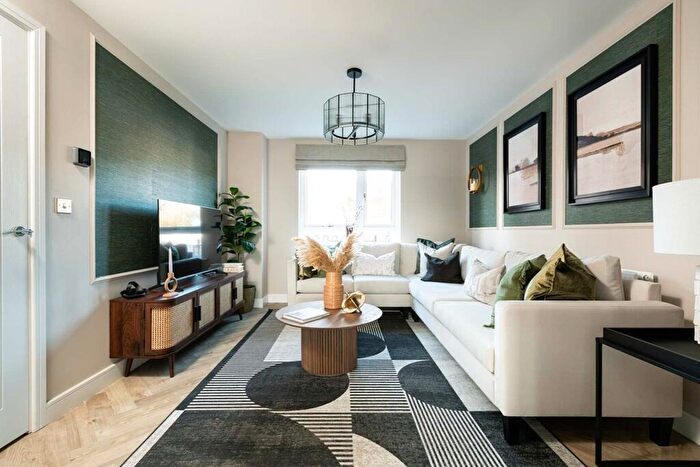
Houses for sale & to rent in Bedlington Central, Bedlington
House Prices in Bedlington Central
Properties in Bedlington Central have an average house price of £180,513.00 and had 213 Property Transactions within the last 3 years¹.
Bedlington Central is an area in Bedlington, Northumberland with 2,055 households², where the most expensive property was sold for £785,000.00.
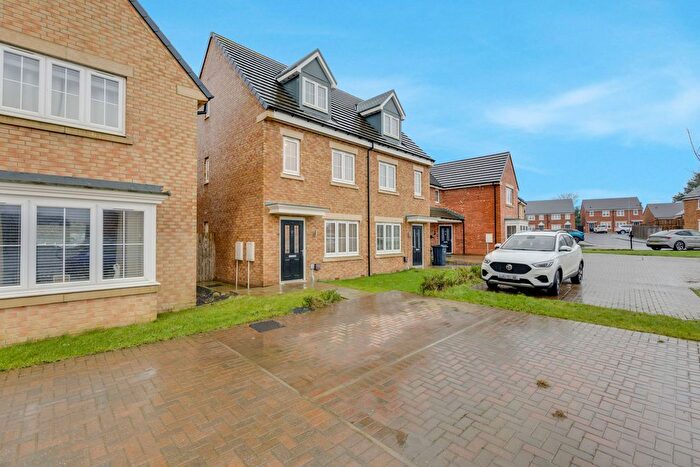
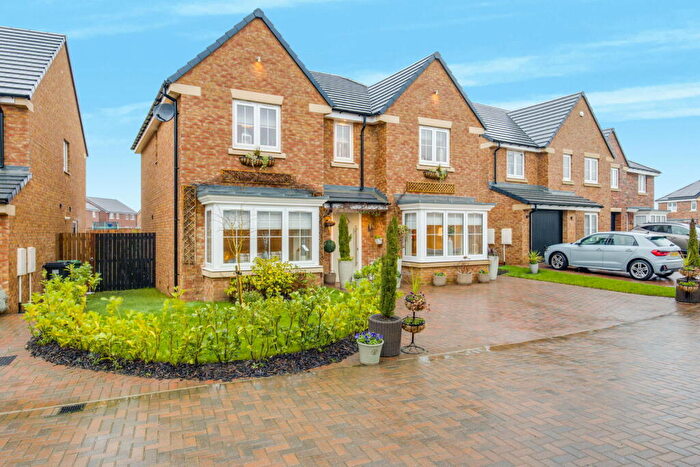
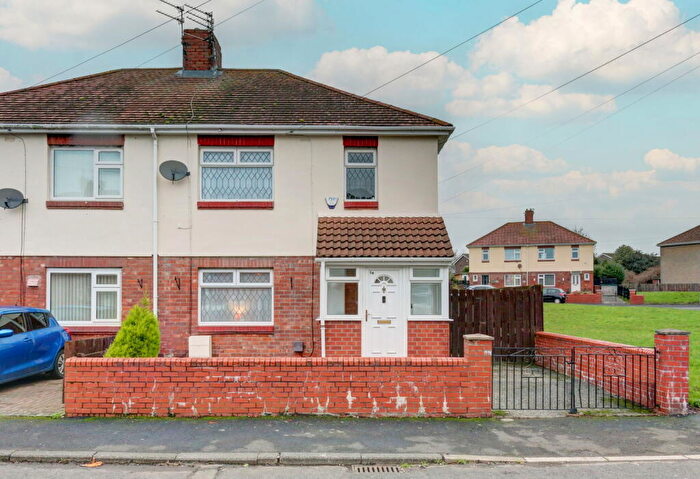
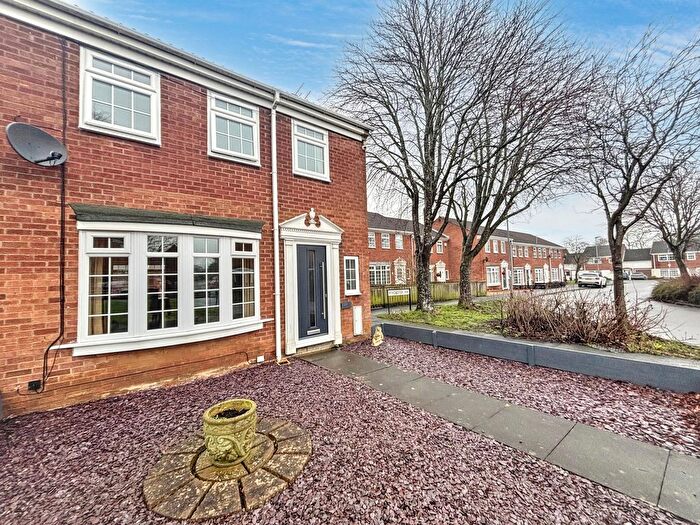
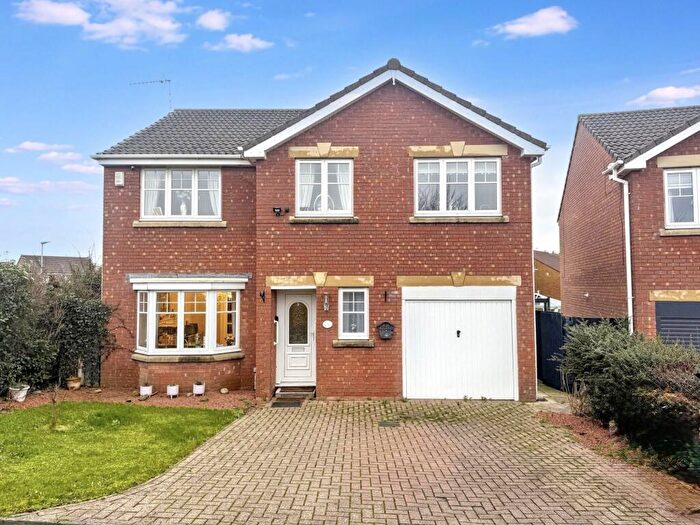
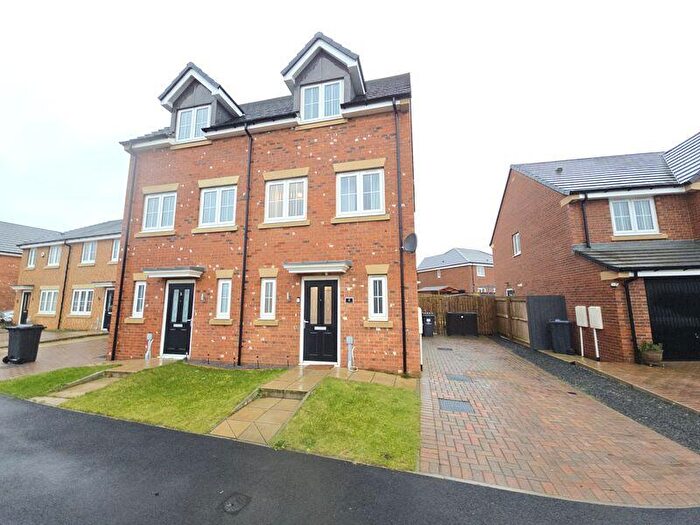
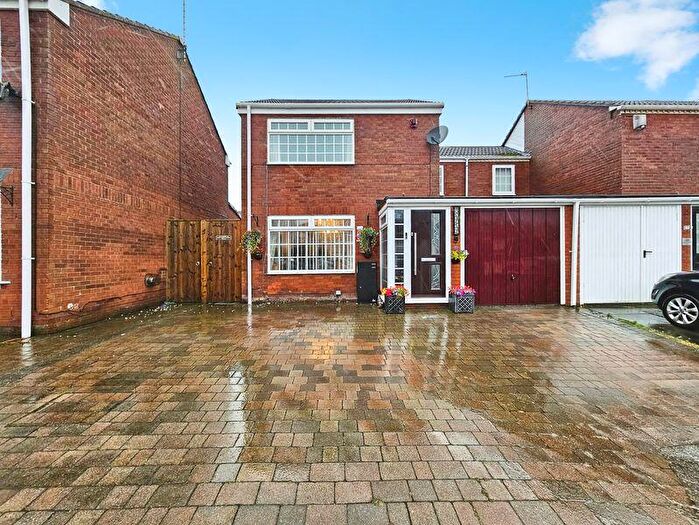
Properties for sale in Bedlington Central
Roads and Postcodes in Bedlington Central
Navigate through our locations to find the location of your next house in Bedlington Central, Bedlington for sale or to rent.
| Streets | Postcodes |
|---|---|
| Acomb Court | NE22 5QP |
| Acorn Avenue | NE22 5SN NE22 5SP NE22 5SW |
| Ashtree Drive | NE22 7LS |
| Barrington Court | NE22 5DH |
| Bayberry Close | NE22 7FA |
| Beech Grove | NE22 5DA |
| Bellingham Court | NE22 5QS |
| Bells Place | NE22 5AQ |
| Birtley Crescent | NE22 5BP |
| Brook Court | NE22 5DF |
| Browns Buildings | NE22 6EG |
| Burdon Terrace | NE22 6DA |
| Carisbrooke | NE22 7LB |
| Carlton House | NE22 6LN |
| Catholic Row | NE22 6HS |
| Cedar Close | NE22 7LW |
| Centenary Cottages | NE22 6JD |
| Cherrytree Drive | NE22 7LP |
| Chollerton Drive | NE22 5QW |
| Choppington Road | NE22 6LA |
| Church Close | NE22 5SR |
| Church Court | NE22 5ST |
| Church Lane | NE22 5EL NE22 5BS NE22 5RS |
| Clovelly Gardens | NE22 5UG |
| Court Road | NE22 7LD |
| Cumberland Avenue | NE22 6DH |
| Demesne Drive | NE22 5SL |
| Dr Pit Cottages | NE22 7LY |
| East Riggs | NE22 5SH |
| Eden Court | NE22 5DG |
| Elm Drive | NE22 5TF |
| Florin Court | NE22 6BL |
| Fountain Close | NE22 7LZ |
| Front Street East | NE22 5AA NE22 5AB NE22 5AE NE22 5DS NE22 5DT |
| Front Street West | NE22 5TT NE22 5TX NE22 5TZ NE22 5UB NE22 5TL NE22 5TU NE22 5UA NE22 5UD |
| Gladstone Terrace | NE22 5DB |
| Glebe Road | NE22 6JX NE22 6LR |
| Gordon Terrace | NE22 5DE |
| Hapenny Gate | NE22 6BJ |
| Hartford Bridge | NE22 6AQ |
| Hartford Court | NE22 6LP |
| Hartford Crescent | NE22 6JB |
| Hartford Hall Estate | NE22 6AG |
| Hartford Road East | NE22 6HX NE22 6HY NE22 6HZ |
| Hartford Road West | NE22 6HU |
| Hartlands | NE22 6JF NE22 6JG NE22 6JH NE22 6JJ NE22 6JQ |
| Hassop Way | NE22 7LE |
| High Ridge | NE22 6EF |
| Hirst Head | NE22 5QH |
| Hirst Terrace North | NE22 5BX |
| Hirst Villas | NE22 5QQ |
| Hollymount Square | NE22 5AH |
| Horton Avenue | NE22 5TA |
| Hotspur Avenue | NE22 5TB NE22 5TD NE22 5TE |
| Humford Way | NE22 5ET |
| John Brown Court | NE22 7LJ |
| Kyloe Place | NE22 5BF |
| Maple Close | NE22 7LU |
| Market Place | NE22 5TN |
| Millbank Crescent | NE22 5QJ |
| Millbank Terrace | NE22 5BY |
| Millfield | NE22 5DY NE22 5DZ NE22 5EA |
| Millfield Court | NE22 5EN NE22 5EP NE22 5EW |
| Millfield East | NE22 5ED |
| Millfield North | NE22 5EF NE22 5EG NE22 5EJ NE22 5EQ NE22 5EH |
| Millfield South | NE22 5EE |
| Millfield West | NE22 5EB |
| Millne Court | NE22 5PA |
| Nether Riggs | NE22 5SJ |
| North Ridge | NE22 6DB NE22 6DD |
| Northumberland Energy Park | NE22 7FJ |
| Oakapple Close | NE22 7LL |
| Penny Lane | NE22 6HD |
| Perry Stone Mews | NE22 5BH |
| Ridge Terrace | NE22 6EB |
| Rowan Close | NE22 7LG |
| Russell Terrace | NE22 5SZ |
| Saxon Court | NE22 5AD |
| Schalksmuhle Road | NE22 6BP NE22 7LA NE22 7LX NE22 7FH |
| Slaley Court | NE22 5QR |
| South Riggs | NE22 5SQ |
| St Aidan Close | NE22 5SB |
| St Bede Wynd | NE22 5SA |
| St Cuthberts Terrace | NE22 5QL |
| St James Gardens | NE22 5SD |
| St Nicholas Drive | NE22 5SE |
| Swiftdale Close | NE22 7LF |
| Swinside Gardens | NE22 6BX |
| Thorntree Drive | NE22 7LR |
| Towers Close | NE22 5ER |
| Vicarage Gardens | NE22 5AF |
| Vicarage Terrace | NE22 5DR |
| Vulcan Place | NE22 5DJ NE22 5DN NE22 5DW NE22 5DL |
| West Riggs | NE22 5SG |
| Westmorland Avenue | NE22 6DJ |
| Windsor Court | NE22 5PB |
| Windsor Gardens | NE22 5SY |
| Woolsington Court | NE22 5UH |
| Yewtree Drive | NE22 7LT |
| NE22 5RT NE22 6AA NE22 6HR NE22 6JE |
Transport near Bedlington Central
- FAQ
- Price Paid By Year
- Property Type Price
Frequently asked questions about Bedlington Central
What is the average price for a property for sale in Bedlington Central?
The average price for a property for sale in Bedlington Central is £180,513. This amount is 10% higher than the average price in Bedlington. There are 1,406 property listings for sale in Bedlington Central.
What streets have the most expensive properties for sale in Bedlington Central?
The streets with the most expensive properties for sale in Bedlington Central are Penny Lane at an average of £711,250, Florin Court at an average of £435,000 and St James Gardens at an average of £381,250.
What streets have the most affordable properties for sale in Bedlington Central?
The streets with the most affordable properties for sale in Bedlington Central are Front Street West at an average of £55,000, Millbank Terrace at an average of £62,241 and Brook Court at an average of £67,816.
Which train stations are available in or near Bedlington Central?
Some of the train stations available in or near Bedlington Central are Cramlington, Pegswood and Morpeth.
Property Price Paid in Bedlington Central by Year
The average sold property price by year was:
| Year | Average Sold Price | Price Change |
Sold Properties
|
|---|---|---|---|
| 2025 | £176,430 | -0,1% |
61 Properties |
| 2024 | £176,534 | -6% |
77 Properties |
| 2023 | £187,920 | -9% |
75 Properties |
| 2022 | £204,503 | 23% |
79 Properties |
| 2021 | £158,293 | 2% |
95 Properties |
| 2020 | £154,541 | -4% |
62 Properties |
| 2019 | £160,781 | 18% |
71 Properties |
| 2018 | £131,078 | -16% |
69 Properties |
| 2017 | £152,177 | -19% |
81 Properties |
| 2016 | £181,798 | 7% |
112 Properties |
| 2015 | £168,581 | 25% |
85 Properties |
| 2014 | £127,272 | 3% |
68 Properties |
| 2013 | £123,364 | -3% |
52 Properties |
| 2012 | £126,813 | -12% |
52 Properties |
| 2011 | £142,281 | 4% |
44 Properties |
| 2010 | £137,222 | -15% |
41 Properties |
| 2009 | £157,985 | -3% |
34 Properties |
| 2008 | £162,034 | 6% |
59 Properties |
| 2007 | £152,031 | 3% |
97 Properties |
| 2006 | £147,226 | 4% |
98 Properties |
| 2005 | £140,991 | 9% |
100 Properties |
| 2004 | £128,186 | 29% |
133 Properties |
| 2003 | £90,830 | 25% |
119 Properties |
| 2002 | £67,702 | 14% |
114 Properties |
| 2001 | £58,362 | 4% |
76 Properties |
| 2000 | £56,195 | -22% |
92 Properties |
| 1999 | £68,541 | 7% |
107 Properties |
| 1998 | £63,986 | 24% |
89 Properties |
| 1997 | £48,384 | -4% |
84 Properties |
| 1996 | £50,362 | -3% |
84 Properties |
| 1995 | £51,622 | - |
86 Properties |
Property Price per Property Type in Bedlington Central
Here you can find historic sold price data in order to help with your property search.
The average Property Paid Price for specific property types in the last three years are:
| Property Type | Average Sold Price | Sold Properties |
|---|---|---|
| Semi Detached House | £157,921.00 | 84 Semi Detached Houses |
| Detached House | £302,398.00 | 55 Detached Houses |
| Terraced House | £119,521.00 | 56 Terraced Houses |
| Flat | £103,272.00 | 18 Flats |

