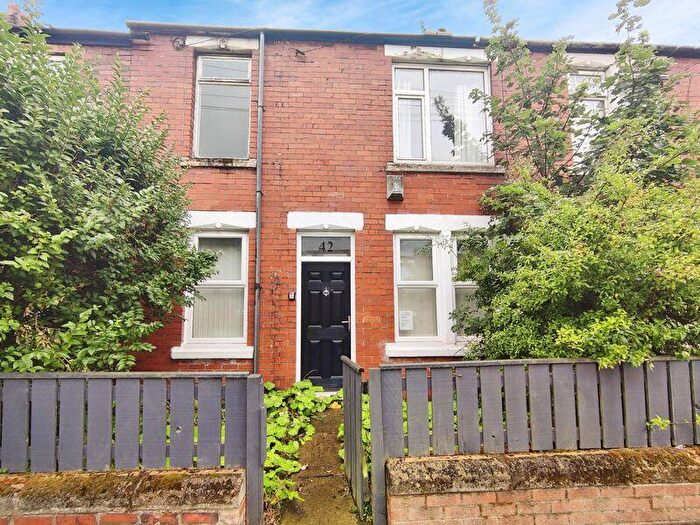
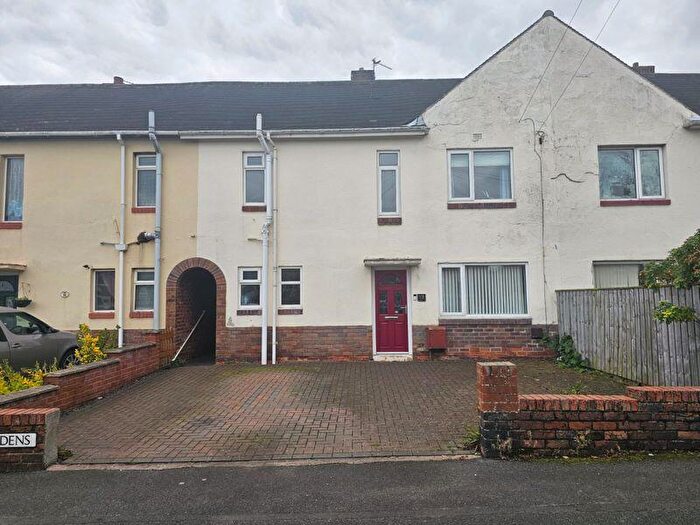
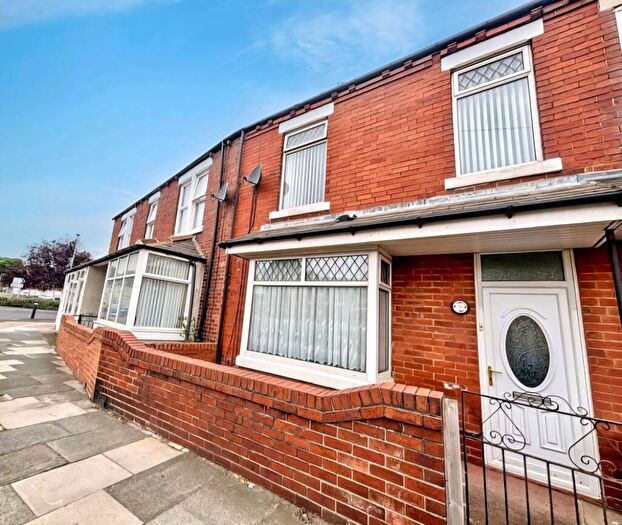
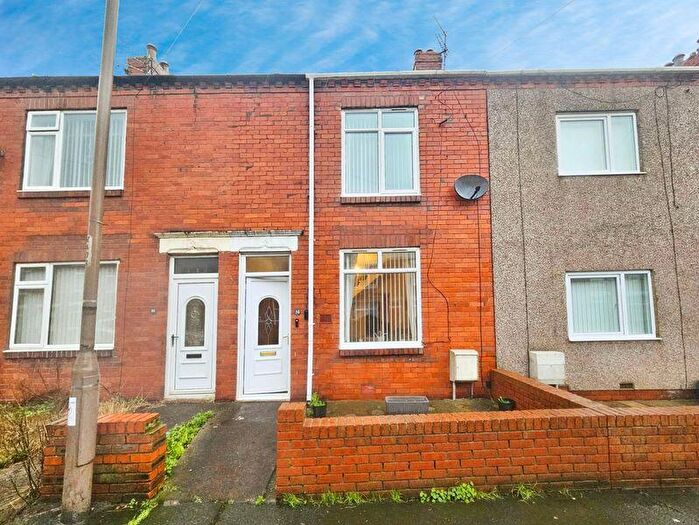
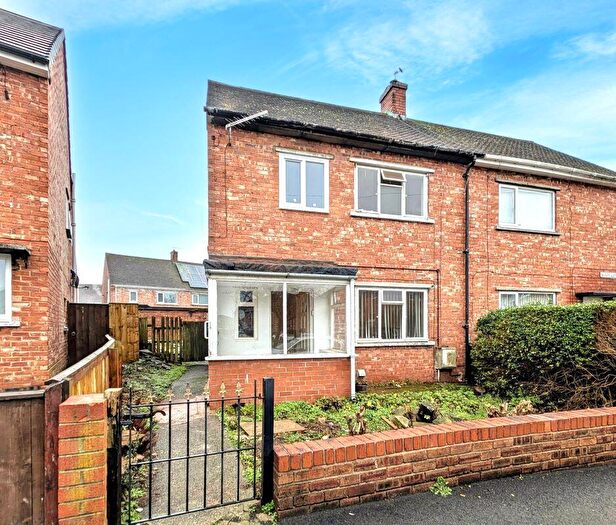
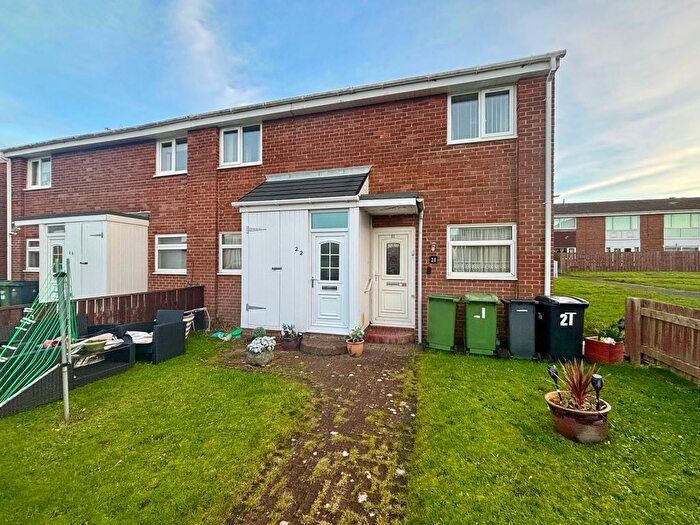
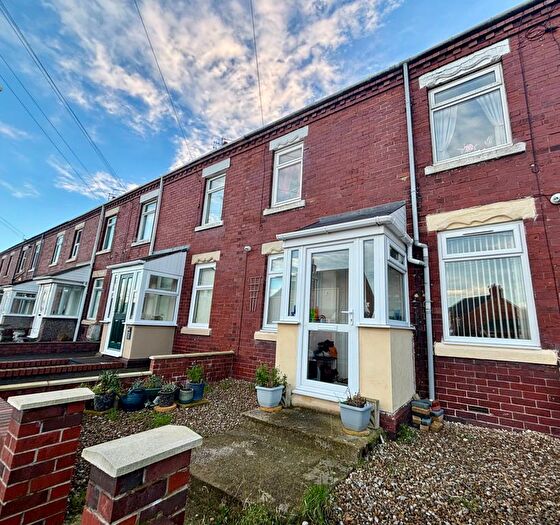
Houses for sale & to rent in Bedlington East, Bedlington
House Prices in Bedlington East
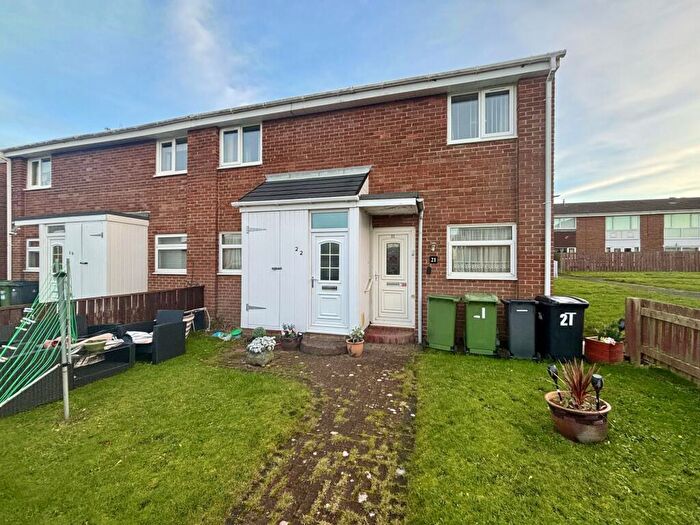
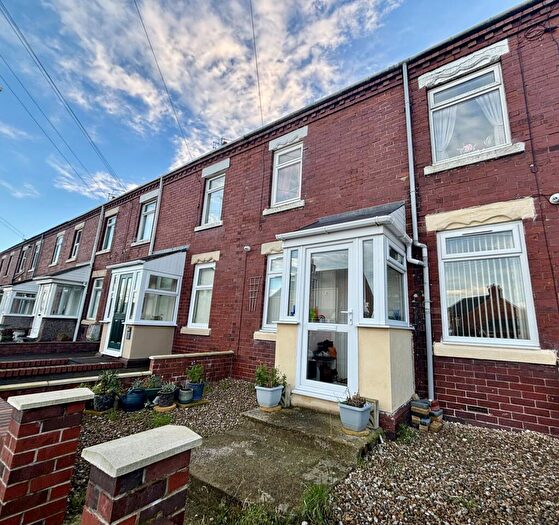
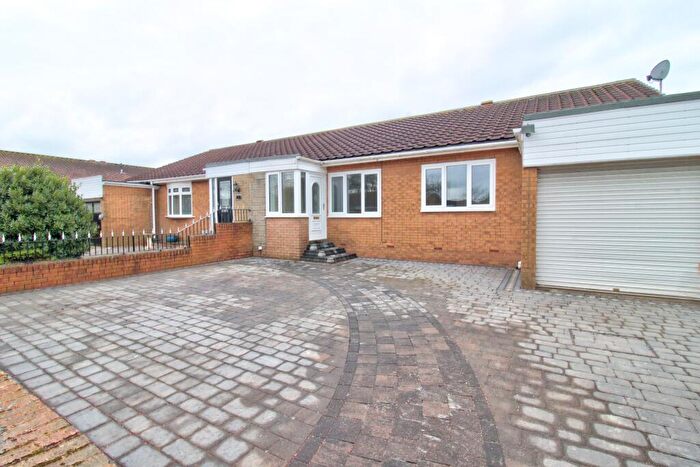
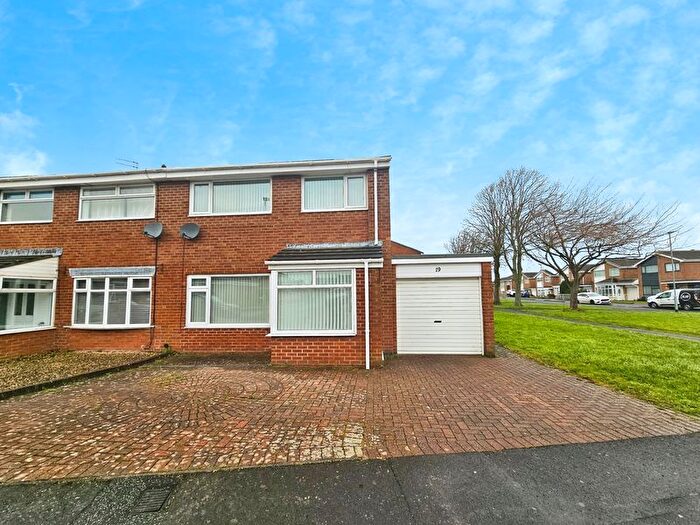
Properties in Bedlington East have an average house price of £108,211.00 and had 189 Property Transactions within the last 3 years¹.
Bedlington East is an area in Bedlington, Northumberland with 2,088 households², where the most expensive property was sold for £320,000.00.
Properties for sale in Bedlington East
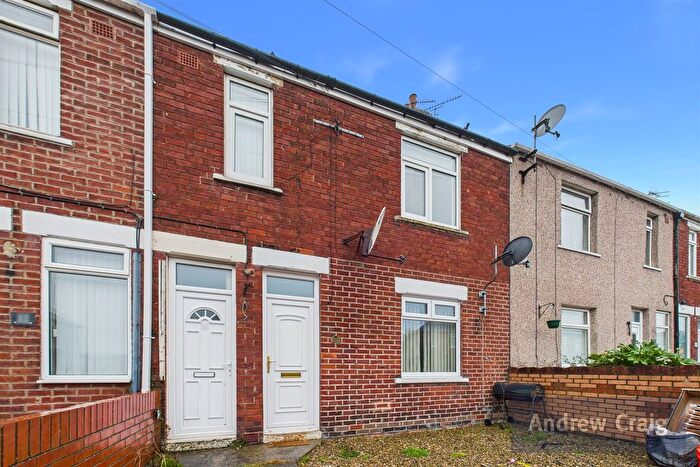
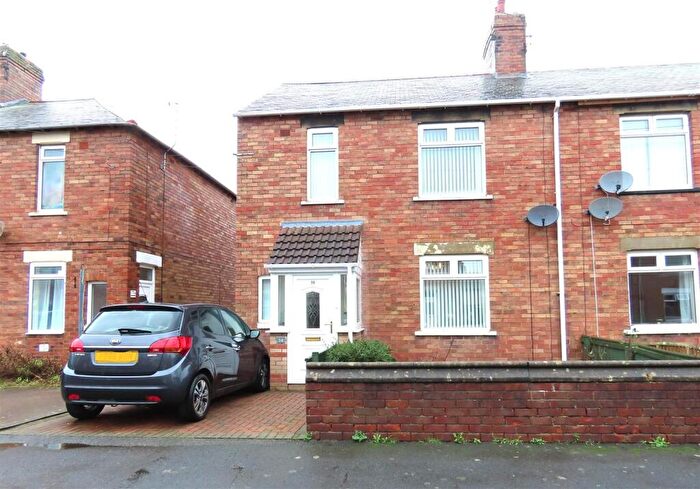
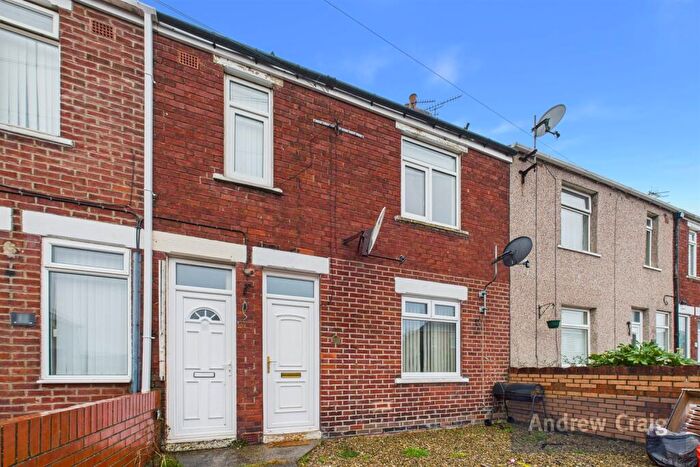
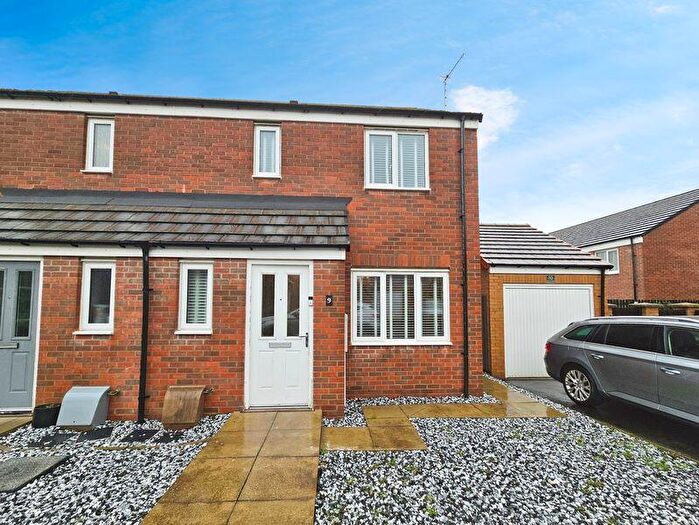
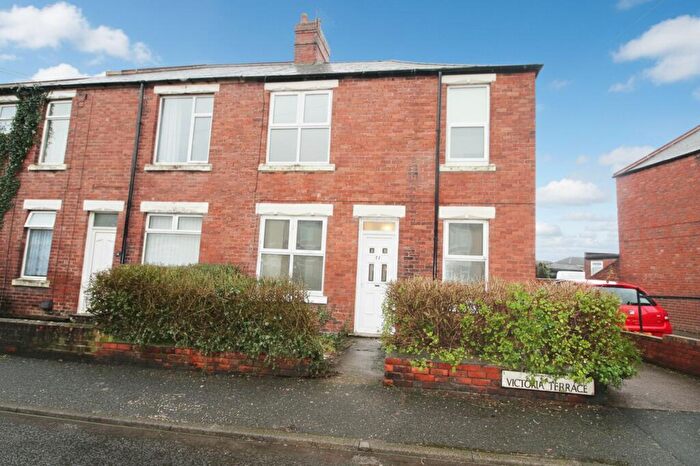
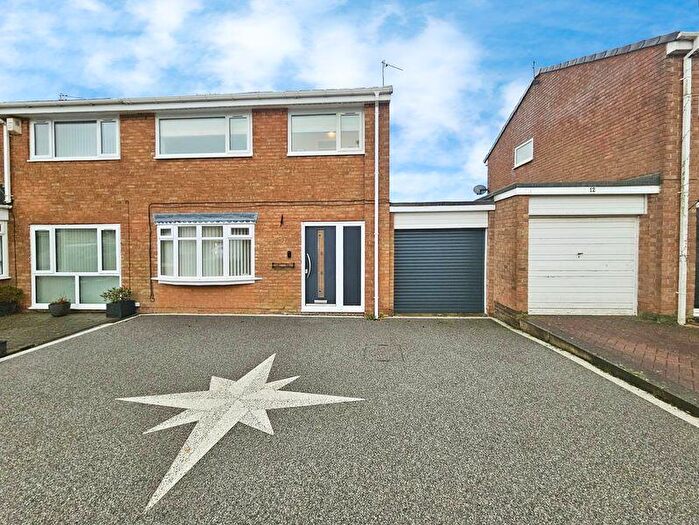
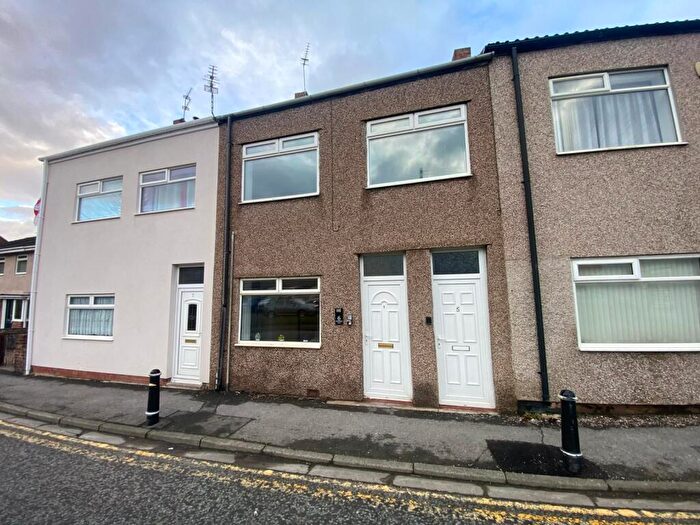
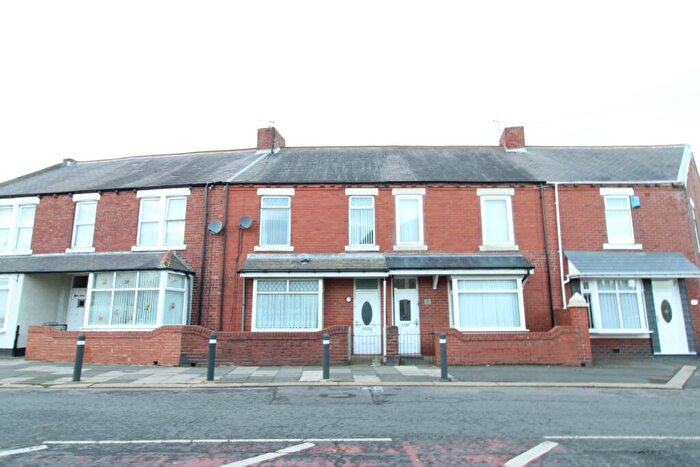
Previously listed properties in Bedlington East
Roads and Postcodes in Bedlington East
Navigate through our locations to find the location of your next house in Bedlington East, Bedlington for sale or to rent.
| Streets | Postcodes |
|---|---|
| Alexander Terrace | NE22 5QG |
| Alfred Avenue | NE22 5AZ |
| Allgood Terrace | NE22 5QN NE22 5QX |
| Arundel Close | NE22 5YJ |
| Balmoral Close | NE22 5YD |
| Beatty Road | NE22 5AR |
| Bedlington Bank | NE22 5RX NE22 5RU |
| Belsay Grove | NE22 5YU |
| Blagdon Court | NE22 5YP |
| Blenheim Drive | NE22 5YR |
| Cambo Avenue | NE22 5NJ |
| Chatsworth Drive | NE22 5YS |
| Clement Avenue | NE22 5NH |
| Coquetdale Place | NE22 5JD NE22 5JF NE22 5JE |
| Cornwell Crescent | NE22 5AP |
| Cragside Gardens | NE22 5YX |
| Delaval Court | NE22 5YL |
| Dene View | NE22 5NW |
| Dene View East | NE22 5NN |
| Dene View West | NE22 5NP |
| Edgewood Avenue | NE22 5NL |
| Follet Close | NE22 5PY |
| Fontburn Road | NE22 5JA NE22 5JB |
| Front Street East | NE22 5BU |
| Haig Road | NE22 5AW |
| Harewood Drive | NE22 5YW |
| Hastings Court | NE22 5YN |
| Hatfield Chase | NE22 5LB |
| Hogarth Cottages | NE22 5AN |
| Hollymount Avenue | NE22 5AJ |
| Hollymount Terrace | NE22 5AL |
| Hudson Avenue | NE22 5NS |
| Kelso Gardens | NE22 5HX NE22 5HY NE22 5HZ |
| Knox Road | NE22 5AS |
| Lambton Court | NE22 5YQ |
| Lily Avenue | NE22 5BB |
| Lumley Court | NE22 5YG |
| Millbank Place | NE22 5AT NE22 5AU |
| Millbank Road | NE22 5AX |
| Newby Close | NE22 5YT |
| Osborne Close | NE22 5YE |
| Park Road | NE22 5DP |
| Poplar Grove | NE22 5NF NE22 5NQ NE22 5NG |
| Puddlers Drive | NE22 5GZ |
| Rosalind Avenue | NE22 5BA |
| Roslin Park | NE22 5HL NE22 5HN NE22 5HP NE22 5HW NE22 5HR |
| Rothesay Mews | NE22 5PD |
| Rothesay Terrace | NE22 5PS NE22 5PT NE22 5PU NE22 5PX |
| Seaton Avenue | NE22 5AY |
| Spring Park | NE22 5BJ |
| Stanley Grove | NE22 5NT |
| Station Road | NE22 5PP NE22 5NX |
| Stead Lane | NE22 5LT NE22 5LU NE22 5LX NE22 5LY NE22 5QY NE22 5JS NE22 5LZ |
| Steadlands Square | NE22 5JW NE22 5JL NE22 5JN |
| Stirling Drive | NE22 5YF |
| Terrier Close | NE22 5JP NE22 5JR |
| The Oval | NE22 5HS NE22 5HT NE22 5HU |
| Tosson Close | NE22 5JH |
| Trevelyan Avenue | NE22 5NU |
| Victoria Terrace | NE22 5QA NE22 5QB NE22 5QD NE22 5QE |
| Victoria Villas | NE22 5QF |
| Wallington Close | NE22 5YA |
| Wanny Road | NE22 5NR |
| Warnhead Road | NE22 5RE |
| Waverley Avenue | NE22 5HG NE22 5HQ |
| Waverley Court | NE22 5JT |
| Whitsun Avenue | NE22 5BG |
| Whitsun Gardens | NE22 5BE |
| Whitsun Grove | NE22 5BD |
| Woburn Drive | NE22 5YB |
| Wood Lane | NE22 5RA NE22 5RB NE22 5RD |
| Woodside | NE22 5NE |
| Wynyard Drive | NE22 5YH |
| NE22 5PR NE22 5RZ |
Transport near Bedlington East
- FAQ
- Price Paid By Year
- Property Type Price
Frequently asked questions about Bedlington East
What is the average price for a property for sale in Bedlington East?
The average price for a property for sale in Bedlington East is £108,211. This amount is 34% lower than the average price in Bedlington. There are 555 property listings for sale in Bedlington East.
What streets have the most expensive properties for sale in Bedlington East?
The streets with the most expensive properties for sale in Bedlington East are Cragside Gardens at an average of £291,250, Belsay Grove at an average of £258,750 and Newby Close at an average of £248,333.
What streets have the most affordable properties for sale in Bedlington East?
The streets with the most affordable properties for sale in Bedlington East are Hastings Court at an average of £45,062, Arundel Close at an average of £46,000 and Blenheim Drive at an average of £59,900.
Which train stations are available in or near Bedlington East?
Some of the train stations available in or near Bedlington East are Cramlington, Pegswood and Morpeth.
Property Price Paid in Bedlington East by Year
The average sold property price by year was:
| Year | Average Sold Price | Price Change |
Sold Properties
|
|---|---|---|---|
| 2025 | £109,360 | 0,3% |
65 Properties |
| 2024 | £109,029 | 3% |
64 Properties |
| 2023 | £106,095 | -10% |
60 Properties |
| 2022 | £116,224 | 19% |
76 Properties |
| 2021 | £94,071 | -3% |
73 Properties |
| 2020 | £96,722 | 9% |
55 Properties |
| 2019 | £88,395 | 3% |
59 Properties |
| 2018 | £85,413 | 8% |
66 Properties |
| 2017 | £78,739 | -12% |
65 Properties |
| 2016 | £88,403 | -16% |
72 Properties |
| 2015 | £102,677 | 12% |
58 Properties |
| 2014 | £90,693 | 8% |
54 Properties |
| 2013 | £83,538 | 4% |
47 Properties |
| 2012 | £80,145 | -14% |
50 Properties |
| 2011 | £91,559 | -1% |
32 Properties |
| 2010 | £92,766 | 3% |
34 Properties |
| 2009 | £89,709 | -27% |
42 Properties |
| 2008 | £113,764 | 7% |
58 Properties |
| 2007 | £106,343 | 7% |
140 Properties |
| 2006 | £98,394 | 5% |
108 Properties |
| 2005 | £93,109 | 22% |
124 Properties |
| 2004 | £72,990 | -12% |
151 Properties |
| 2003 | £81,805 | 25% |
176 Properties |
| 2002 | £61,217 | 15% |
146 Properties |
| 2001 | £51,930 | 19% |
145 Properties |
| 2000 | £42,255 | 23% |
108 Properties |
| 1999 | £32,442 | 2% |
75 Properties |
| 1998 | £31,889 | 9% |
55 Properties |
| 1997 | £29,047 | 3% |
75 Properties |
| 1996 | £28,139 | -0,2% |
69 Properties |
| 1995 | £28,184 | - |
64 Properties |
Property Price per Property Type in Bedlington East
Here you can find historic sold price data in order to help with your property search.
The average Property Paid Price for specific property types in the last three years are:
| Property Type | Average Sold Price | Sold Properties |
|---|---|---|
| Semi Detached House | £114,478.00 | 38 Semi Detached Houses |
| Detached House | £228,940.00 | 25 Detached Houses |
| Terraced House | £97,222.00 | 82 Terraced Houses |
| Flat | £54,685.00 | 44 Flats |

