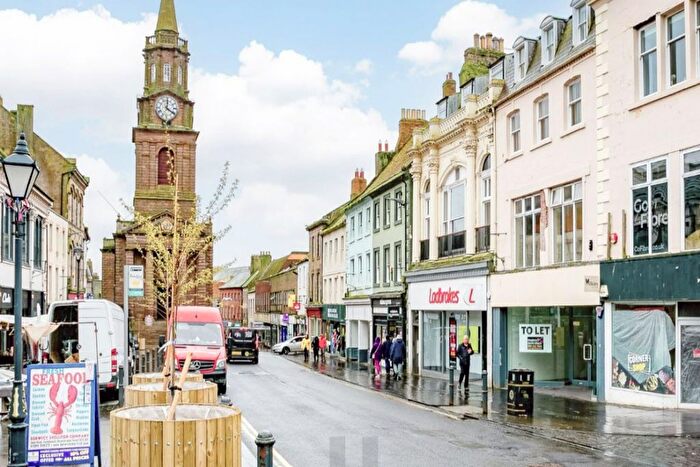
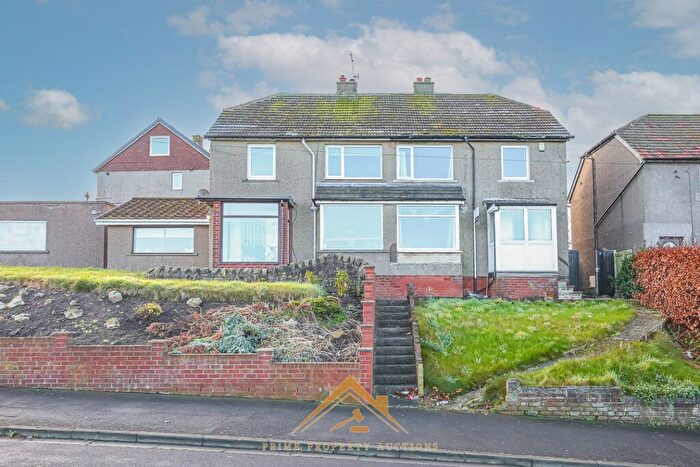
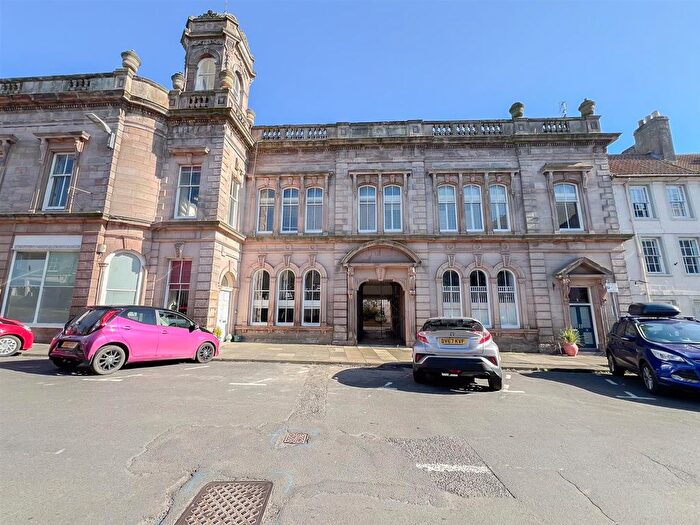
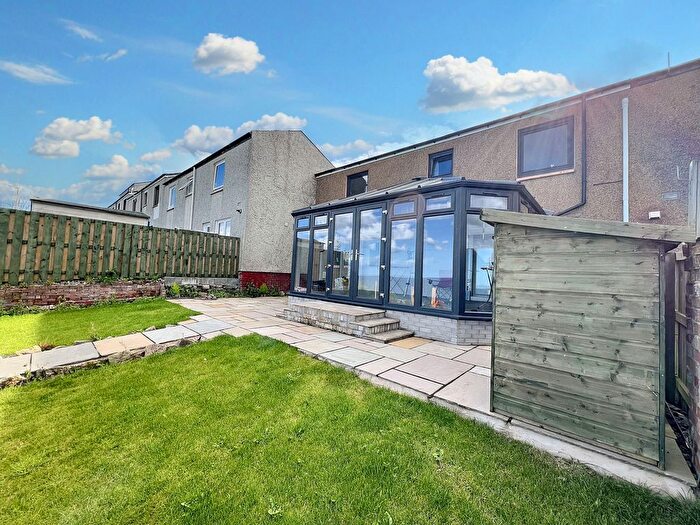
Houses for sale & to rent in Berwick East, Berwick-upon-tweed
House Prices in Berwick East
Properties in Berwick East have an average house price of £161,278.00 and had 184 Property Transactions within the last 3 years¹.
Berwick East is an area in Berwick-upon-tweed, Northumberland with 2,197 households², where the most expensive property was sold for £840,000.00.
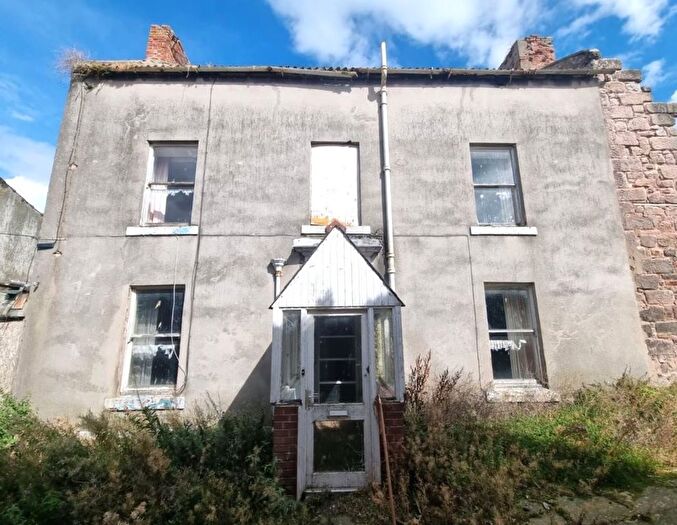
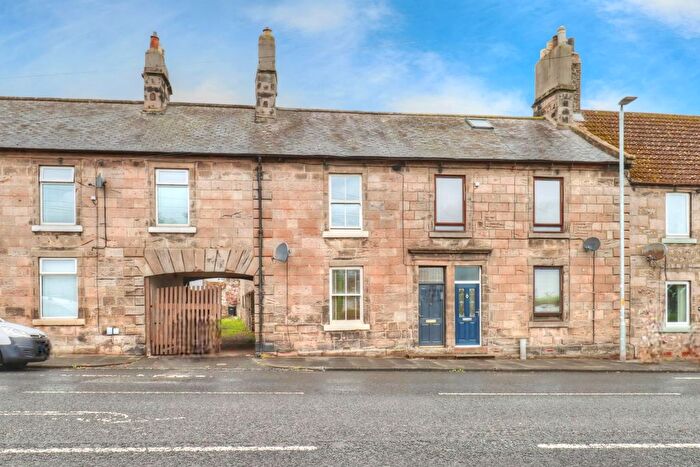
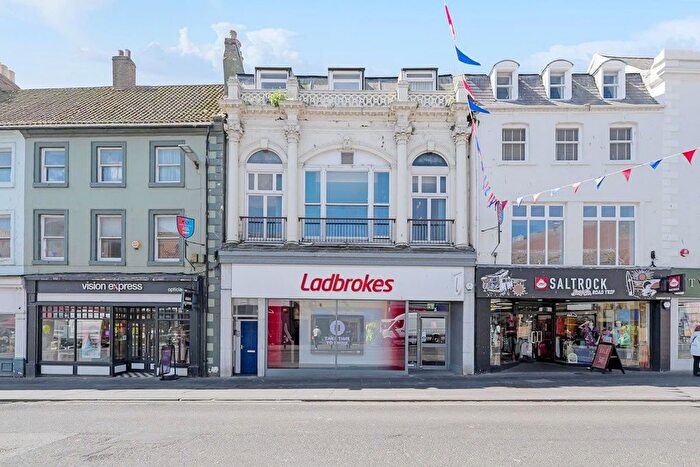
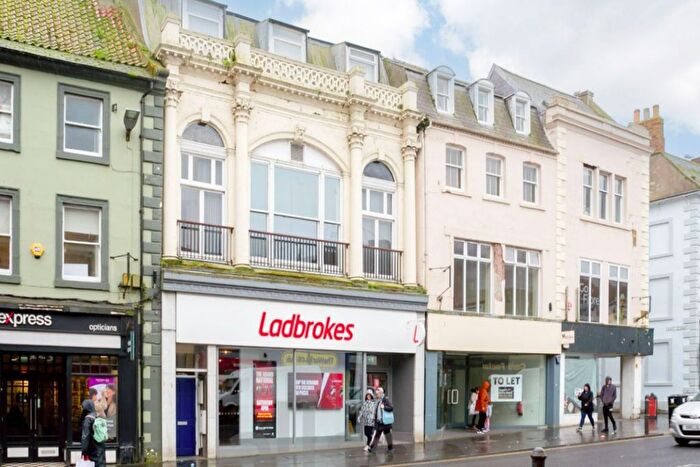
Previously listed properties in Berwick East
Roads and Postcodes in Berwick East
Navigate through our locations to find the location of your next house in Berwick East, Berwick-upon-tweed for sale or to rent.
| Streets | Postcodes |
|---|---|
| Adams Drive | TD15 2JF TD15 2JG TD15 2JQ |
| Albert Road | TD15 1RX |
| Askew Crescent | TD15 2AU |
| Barley Rise | TD15 2WL |
| Berwick Hill | TD15 2RS |
| Billendean Road | TD15 1QS |
| Billendean Terrace | TD15 2AX TD15 2DJ |
| Blakewell Gardens | TD15 2HJ |
| Blakewell Lane | TD15 2HF |
| Blakewell Road | TD15 2HG |
| Blenheim Place | TD15 1RA |
| Bowers Crescent | TD15 2HH |
| Brewery Bank | TD15 2AQ |
| Brewery Lane | TD15 2AH |
| Church Road | TD15 2AJ TD15 2AN |
| Commercial Road | TD15 1RQ |
| Cow Road | TD15 1RY TD15 2QR |
| Crosthwaite Terrace | TD15 2BN |
| Dock Road | TD15 2BE TD15 2BG |
| East Street | TD15 1RF |
| Eastcliffe | TD15 2JA TD15 2JT TD15 2JU |
| Falloden Terrace | TD15 2AY |
| Farne Road | TD15 2DW |
| Fetters Lane | TD15 2BH |
| Hallowstell View | TD15 1QT |
| Highcliffe | TD15 2JH TD15 2JJ TD15 2JL TD15 2JN TD15 2JR TD15 2JS |
| Howick Terrace | TD15 2AZ |
| Kiln Hill | TD15 2EZ |
| Knowe Head | TD15 2EU |
| Ladywell Place | TD15 2AE |
| Ladywell Road | TD15 2AF TD15 2AG |
| Lees Lane | TD15 2BQ TD15 2BL |
| Main Street | TD15 1QY TD15 1RD TD15 1RP TD15 1RR TD15 2AA TD15 2AD TD15 2AW TD15 2HD TD15 1RS TD15 2DS TD15 2EP |
| Middle Street | TD15 1RZ |
| Mill Strand | TD15 2BJ |
| Mill Wharf | TD15 2BP |
| Mount Road | TD15 2BA |
| North Greenwich Road | TD15 1RG |
| Northumberland Road | TD15 2AS |
| Ord Drive | TD15 2HR TD15 2HZ |
| Ord Road | TD15 2XE TD15 2XU |
| Osborne Crescent | TD15 2HU TD15 2HX |
| Osborne Place | TD15 2HT |
| Osborne Road | TD15 2HS |
| Prince Edward Road | TD15 2EX |
| Princes Street | TD15 1QX |
| Riverdene | TD15 2JD |
| Riverside Road | TD15 2HQ |
| Riverview Park | TD15 1QR |
| Rowntree Avenue | TD15 2BW |
| Sandstell Road | TD15 1RE |
| Sea Road | TD15 1RN |
| South Greenwich Road | TD15 1RW |
| Spittal Hall Place | TD15 2JP |
| Spittal Hall Road | TD15 2JW |
| Spittal Mews | TD15 1RB |
| St Bartholomews Crescent | TD15 2DN |
| St Helens Terrace | TD15 1RJ |
| Sunnyside Crescent | TD15 2DL |
| The Crescent | TD15 1RT |
| The Promenade | TD15 1SE |
| Tower Road | TD15 2BD TD15 2GZ |
| Tweed Dock | TD15 2AB |
| Tweedside Trading Estate | TD15 2UY TD15 2UZ TD15 2XB TD15 2XZ |
| Union Brae | TD15 2HB |
| Union Park Road | TD15 2HY |
| Waterloo Place | TD15 1SA |
| Well Road | TD15 2BB |
| Well Square | TD15 2AL |
| West End | TD15 2HE |
| West End Court | TD15 2JE |
| West End Place | TD15 2HW |
| West End Road | TD15 2HL |
| West Street | TD15 1SB |
| Yard Heads | TD15 2HA |
| TD15 2HP TD15 2QS TD15 1QU TD15 2UU |
Transport near Berwick East
- FAQ
- Price Paid By Year
- Property Type Price
Frequently asked questions about Berwick East
What is the average price for a property for sale in Berwick East?
The average price for a property for sale in Berwick East is £161,278. This amount is 29% lower than the average price in Berwick-upon-tweed. There are 277 property listings for sale in Berwick East.
What streets have the most expensive properties for sale in Berwick East?
The streets with the most expensive properties for sale in Berwick East are St Helens Terrace at an average of £425,166, Cow Road at an average of £358,000 and Sea Road at an average of £345,000.
What streets have the most affordable properties for sale in Berwick East?
The streets with the most affordable properties for sale in Berwick East are Yard Heads at an average of £40,000, Union Park Road at an average of £78,666 and Albert Road at an average of £80,000.
Which train stations are available in or near Berwick East?
Some of the train stations available in or near Berwick East are Berwick-Upon-Tweed, Chathill and Dunbar.
Property Price Paid in Berwick East by Year
The average sold property price by year was:
| Year | Average Sold Price | Price Change |
Sold Properties
|
|---|---|---|---|
| 2025 | £170,722 | 12% |
46 Properties |
| 2024 | £149,895 | -11% |
71 Properties |
| 2023 | £166,858 | 4% |
67 Properties |
| 2022 | £159,879 | 9% |
71 Properties |
| 2021 | £145,711 | 10% |
81 Properties |
| 2020 | £131,221 | 3% |
68 Properties |
| 2019 | £126,763 | 9% |
52 Properties |
| 2018 | £115,607 | -10% |
79 Properties |
| 2017 | £127,204 | 3% |
79 Properties |
| 2016 | £123,062 | 3% |
65 Properties |
| 2015 | £118,775 | 8% |
57 Properties |
| 2014 | £108,770 | 4% |
67 Properties |
| 2013 | £104,803 | -14% |
54 Properties |
| 2012 | £119,848 | 14% |
43 Properties |
| 2011 | £103,312 | -8% |
47 Properties |
| 2010 | £111,925 | -2% |
61 Properties |
| 2009 | £113,675 | -0,5% |
49 Properties |
| 2008 | £114,214 | -2% |
51 Properties |
| 2007 | £116,154 | 13% |
105 Properties |
| 2006 | £101,329 | 3% |
103 Properties |
| 2005 | £98,676 | 8% |
95 Properties |
| 2004 | £91,139 | 30% |
97 Properties |
| 2003 | £63,684 | 3% |
104 Properties |
| 2002 | £62,048 | 19% |
118 Properties |
| 2001 | £50,430 | 11% |
89 Properties |
| 2000 | £44,683 | 2% |
70 Properties |
| 1999 | £43,621 | 4% |
57 Properties |
| 1998 | £41,725 | 4% |
74 Properties |
| 1997 | £40,227 | 13% |
58 Properties |
| 1996 | £35,031 | -11% |
53 Properties |
| 1995 | £38,985 | - |
50 Properties |
Property Price per Property Type in Berwick East
Here you can find historic sold price data in order to help with your property search.
The average Property Paid Price for specific property types in the last three years are:
| Property Type | Average Sold Price | Sold Properties |
|---|---|---|
| Semi Detached House | £166,020.00 | 49 Semi Detached Houses |
| Detached House | £273,000.00 | 14 Detached Houses |
| Terraced House | £158,381.00 | 91 Terraced Houses |
| Flat | £110,185.00 | 30 Flats |

