
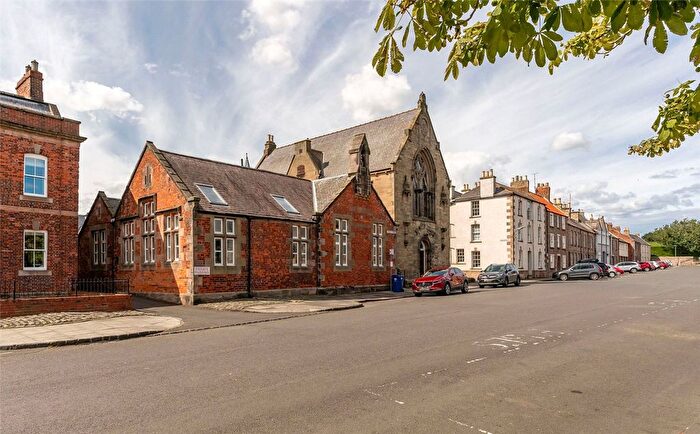
Houses for sale & to rent in East Berwickshire, Berwick-upon-tweed
House Prices in East Berwickshire
Properties in East Berwickshire have an average house price of £227k and had 172 Property Transactions within the last 3 years¹.
East Berwickshire is an area in Berwick-upon-tweed, Scottish Borders with 4,813 households², where the most expensive property was sold for £910k.
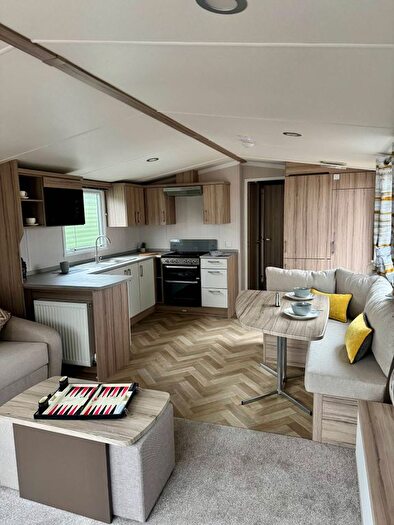
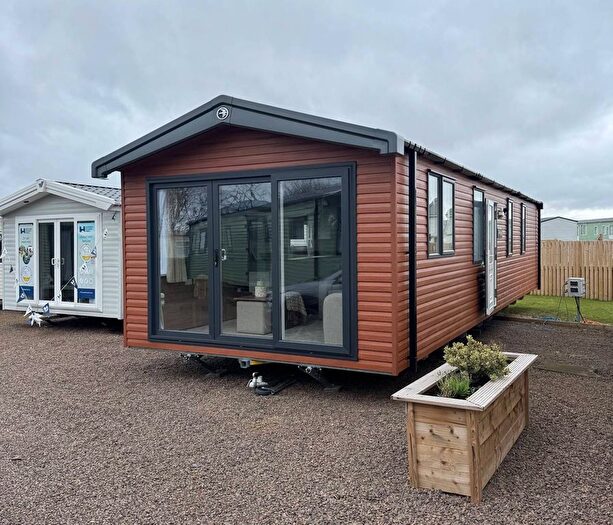
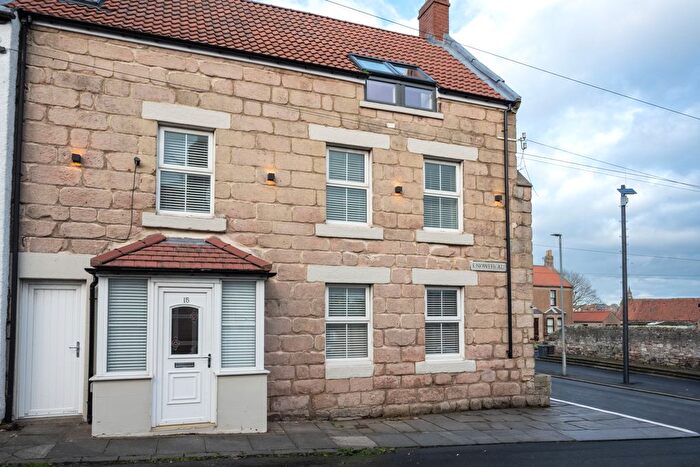
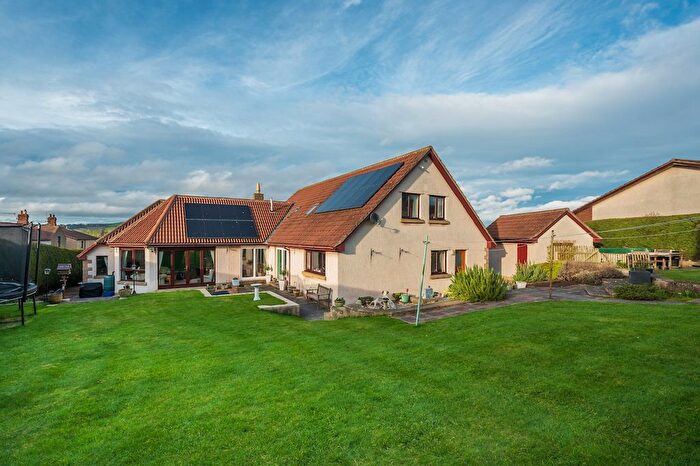
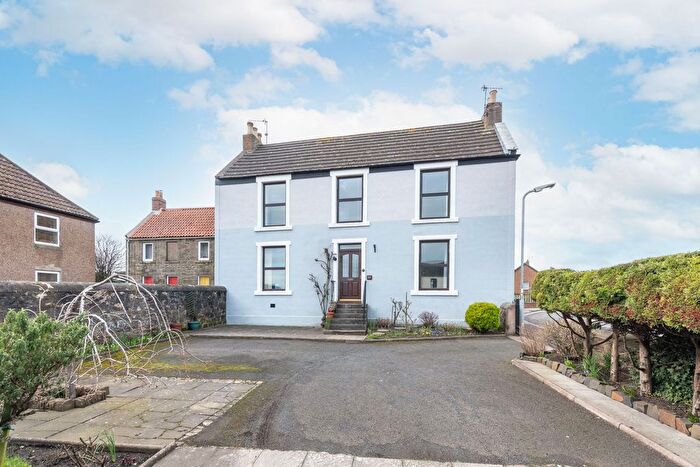
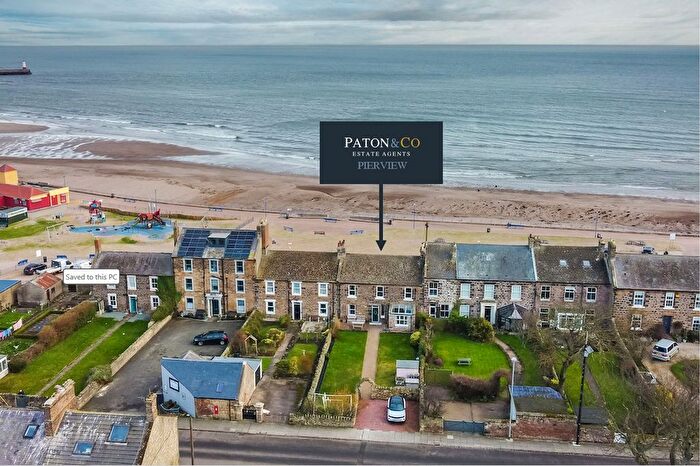
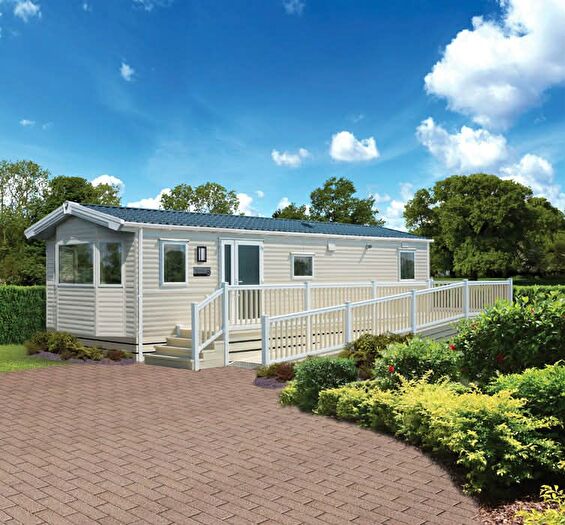
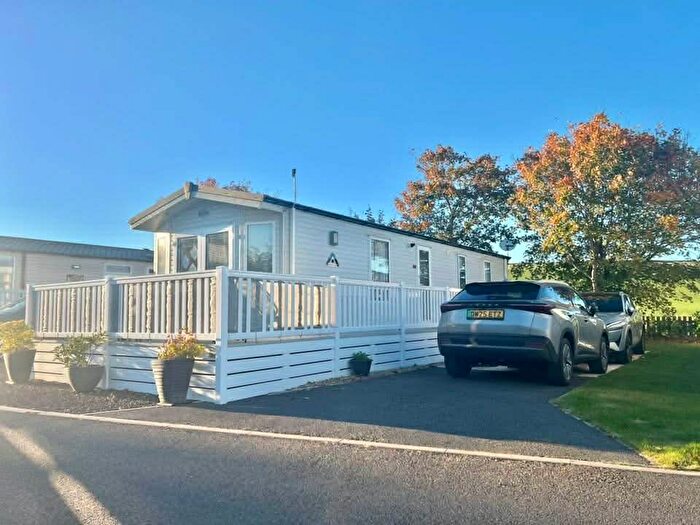
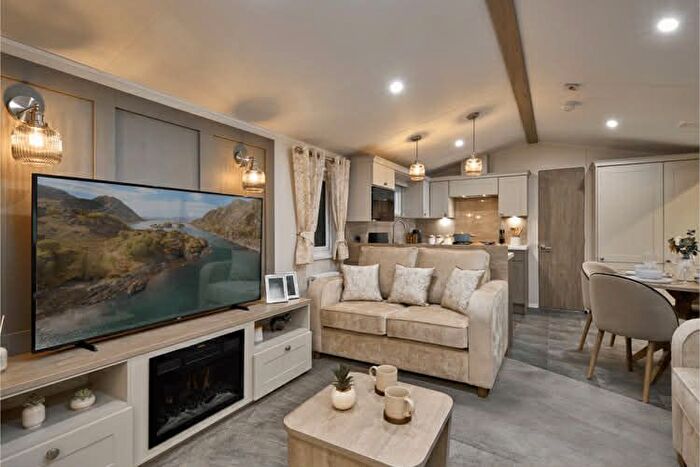
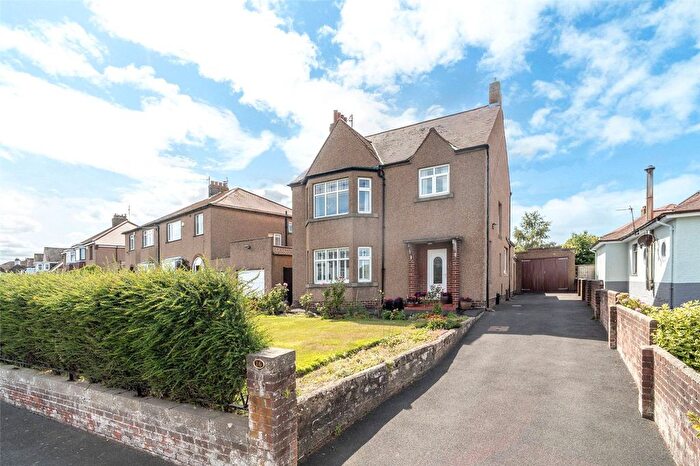
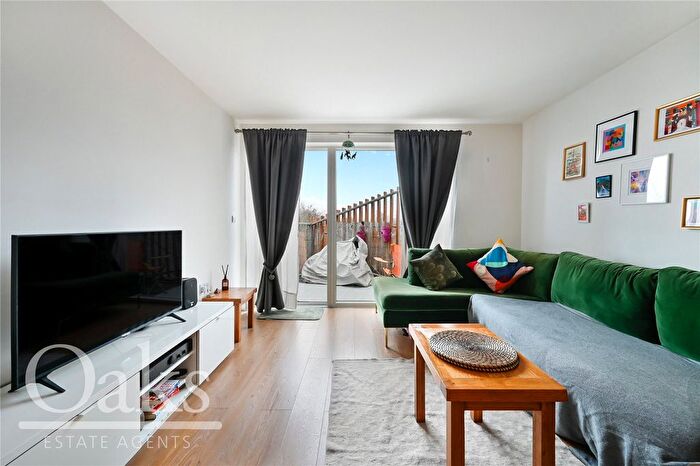
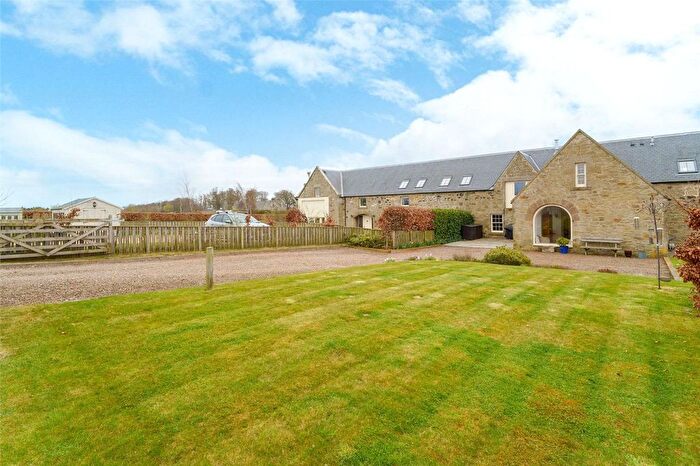
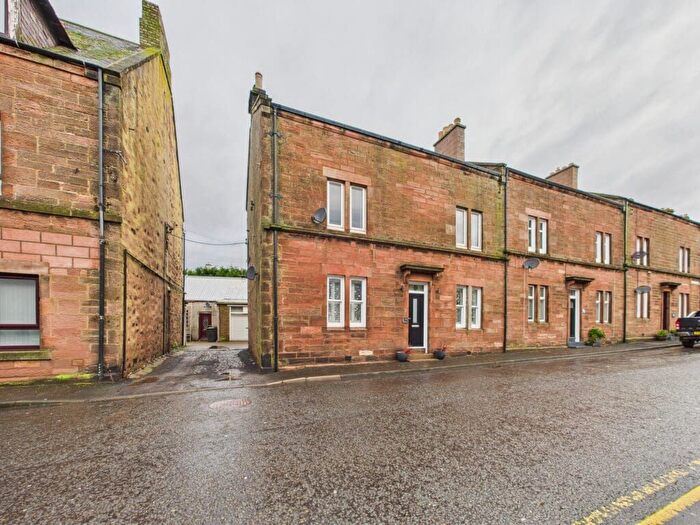
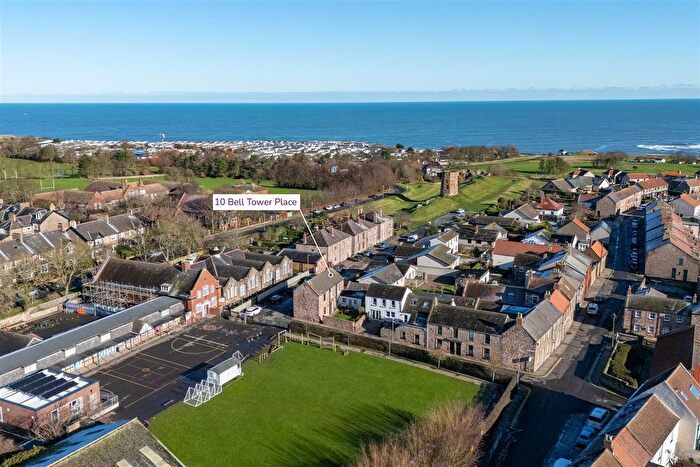
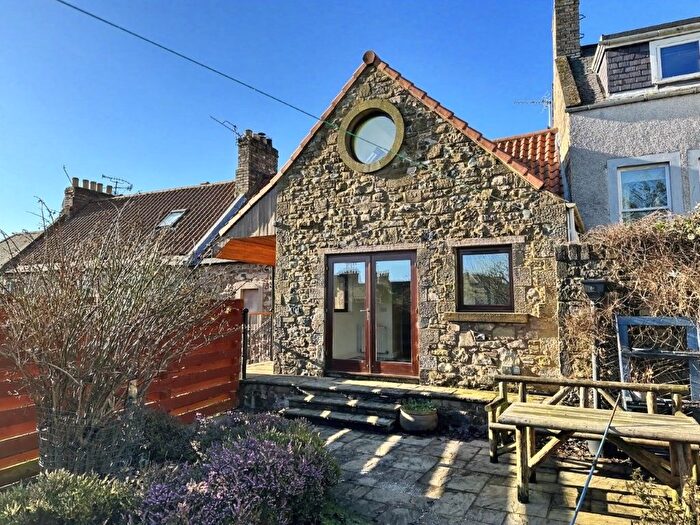
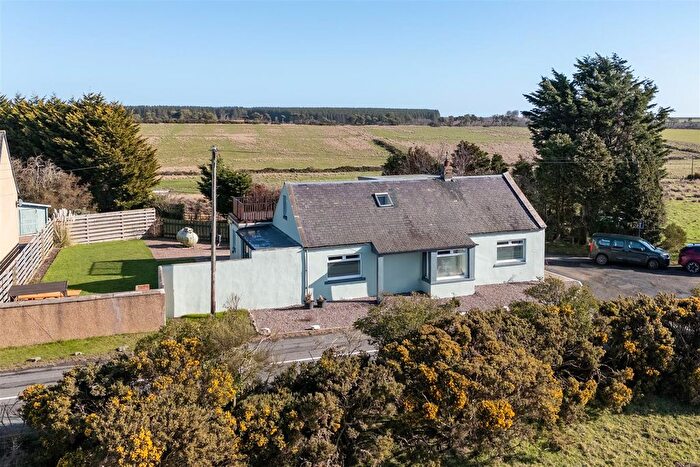
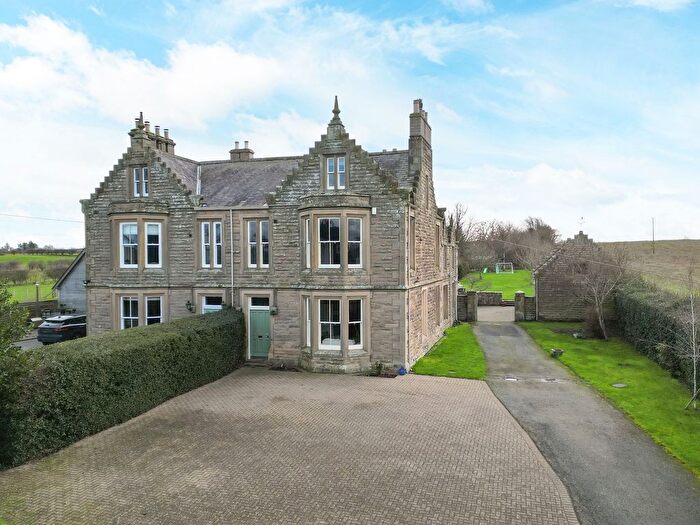
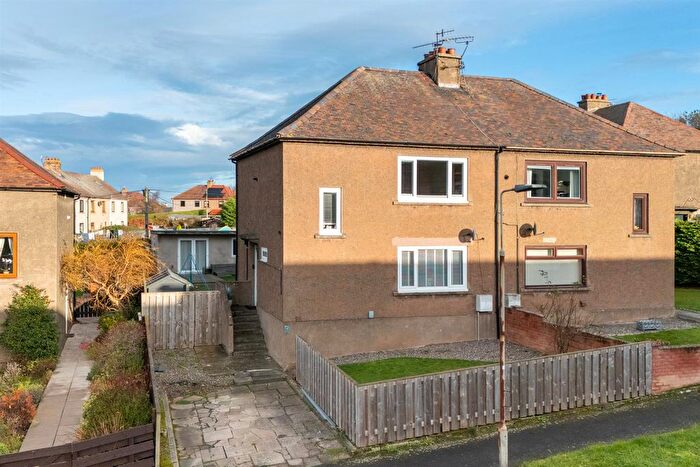
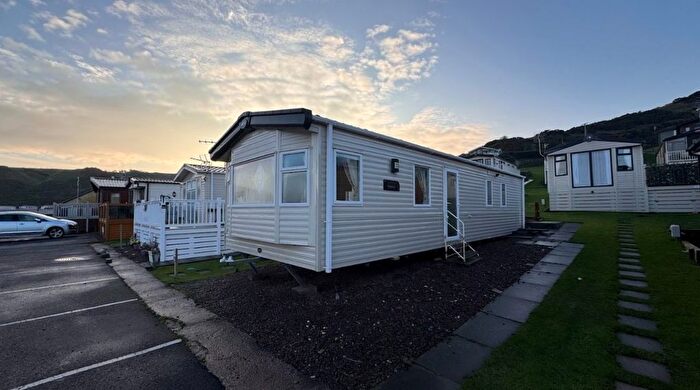
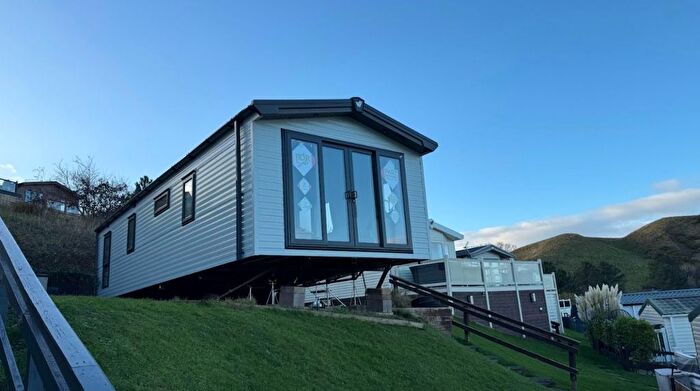
Properties for sale in East Berwickshire
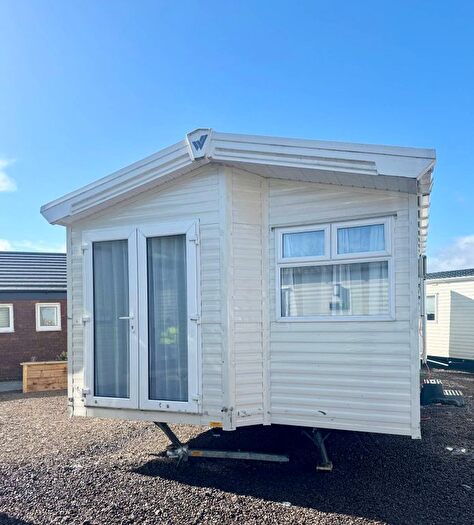

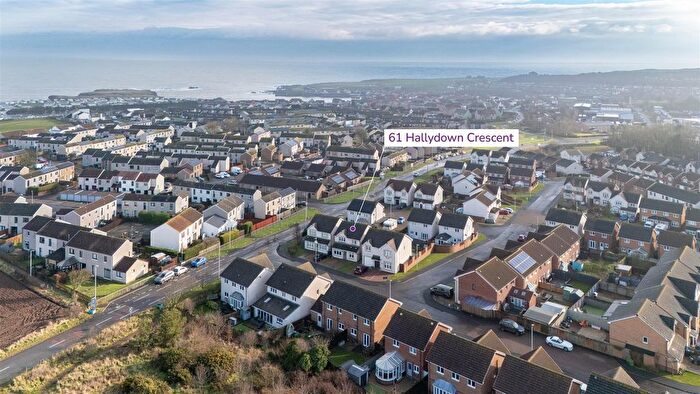
![]()
If you are looking to sell your house, let it out, or receive a property valuation, an expert can help you.
Click the button below to get started.
Roads and Postcodes in East Berwickshire
Navigate through our locations to find the location of your next house in East Berwickshire, Berwick-upon-tweed for sale or to rent.
Transport near East Berwickshire
-
 Berwick-Upon-Tweed Station
 -
Dunbar Station
-
North Berwick Station
-
Drem Station
-
Chathill Station
-
Tweedbank Station
-
Longniddry Station
-
Stow Station
-
Galashiels Station
- FAQ
- Price Paid By Year
Frequently asked questions about East Berwickshire
What is the average price for a property for sale in East Berwickshire?
The average price for a property for sale in East Berwickshire is £226,880. This amount is 6% higher than the average price in Berwick-upon-tweed. There are 1,349 property listings for sale in East Berwickshire.
What streets have the most expensive properties for sale in East Berwickshire?
The streets with the most expensive properties for sale in East Berwickshire are Lower Burnmouth at an average of £530,000, Beanburn at an average of £425,000 and Kanes Close at an average of £410,000.
What streets have the most affordable properties for sale in East Berwickshire?
The streets with the most affordable properties for sale in East Berwickshire are Applin Cross at an average of £105,000, Hurkur Crescent at an average of £114,975 and Gunsgreen Crescent at an average of £119,987.
Which train stations are available in or near East Berwickshire?
Some of the train stations available in or near East Berwickshire are Berwick-Upon-Tweed, Dunbar and North Berwick.
Property Price Paid in East Berwickshire by Year
The average sold property price by year was:
| Year | Average Sold Price | Price Change |
Sold Properties
|
|---|---|---|---|
| 2025 | £213,355 | -3% |
39 Properties |
| 2024 | £220,485 | -8% |
56 Properties |
| 2023 | £238,381 | -11% |
77 Properties |
| 2022 | £264,356 | 7% |
166 Properties |
| 2021 | £245,546 | 3% |
237 Properties |
| 2020 | £237,725 | 22% |
159 Properties |
| 2019 | £185,052 | -2% |
181 Properties |
| 2018 | £188,952 | -3% |
203 Properties |
| 2017 | £193,849 | 3% |
227 Properties |
| 2016 | £188,997 | 4% |
193 Properties |
| 2015 | £181,300 | 3% |
182 Properties |
| 2014 | £175,939 | 2% |
183 Properties |
| 2013 | £171,859 | 5% |
139 Properties |
| 2012 | £162,697 | -16% |
143 Properties |
| 2011 | £188,064 | 2% |
124 Properties |
| 2010 | £184,092 | 15% |
126 Properties |
| 2009 | £156,614 | -6% |
138 Properties |
| 2008 | £166,321 | 2% |
223 Properties |
| 2007 | £163,199 | 12% |
263 Properties |
| 2006 | £144,320 | 2% |
276 Properties |
| 2005 | £141,976 | 7% |
220 Properties |
| 2004 | £131,716 | 24% |
240 Properties |
| 2003 | £100,541 | -3% |
212 Properties |
| 2002 | £103,738 | 34% |
293 Properties |
| 2001 | £68,542 | -427% |
18 Properties |
| 1997 | £361,000 | - |
1 Property |