Houses for sale & to rent in Bamburgh, Chathill
House Prices in Bamburgh
Properties in Bamburgh have an average house price of £330,164.00 and had 77 Property Transactions within the last 3 years¹.
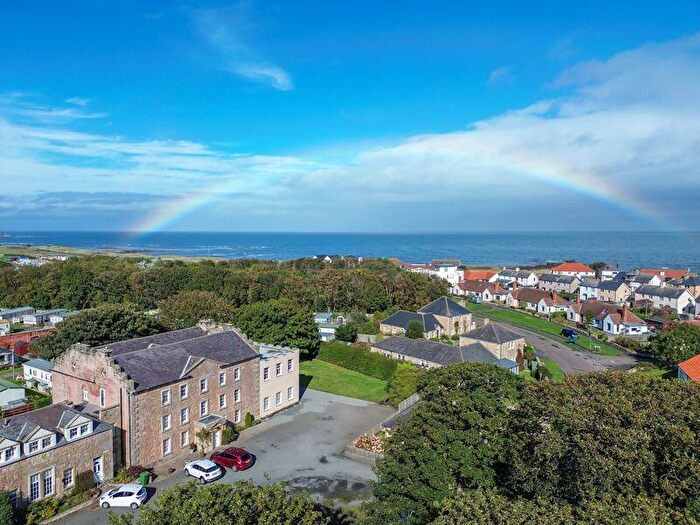
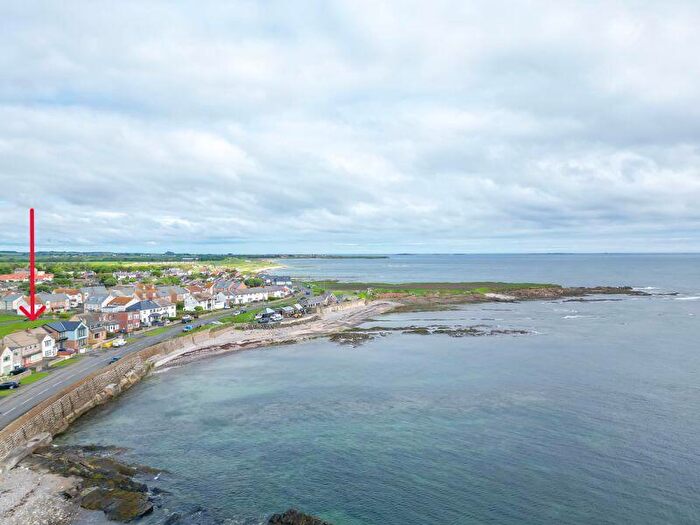
Bamburgh is an area in Chathill, Northumberland with 318 households², where the most expensive property was sold for £775,000.00.
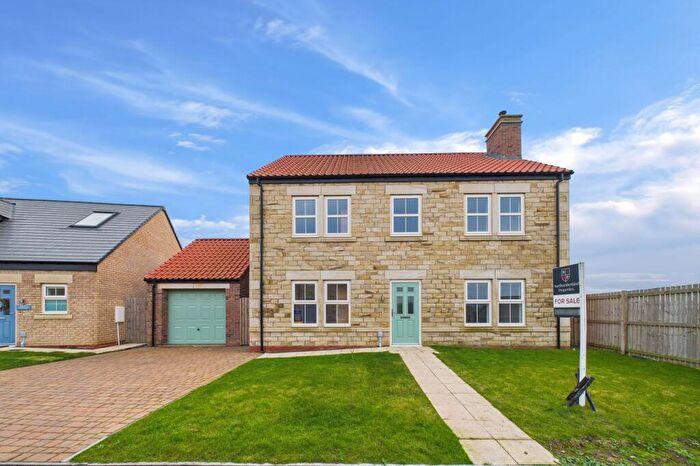
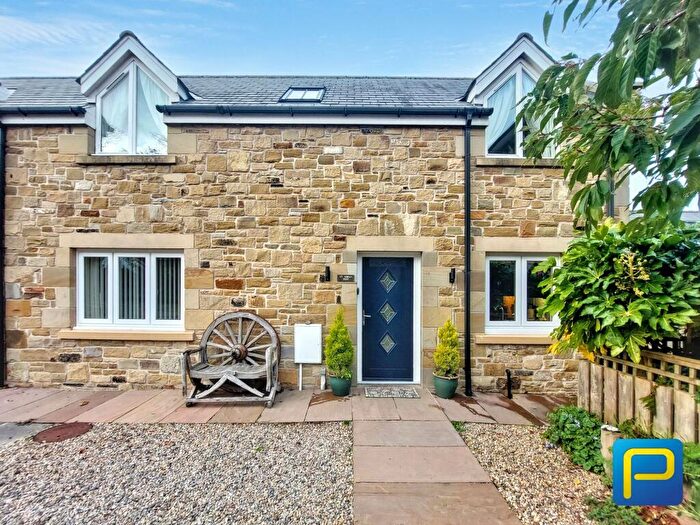
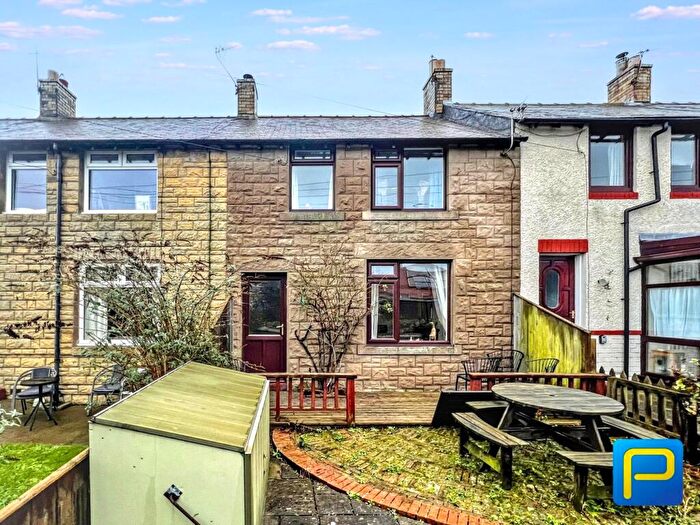
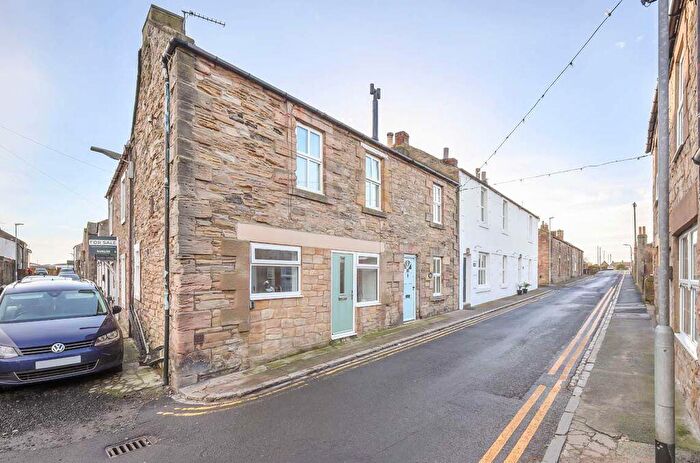
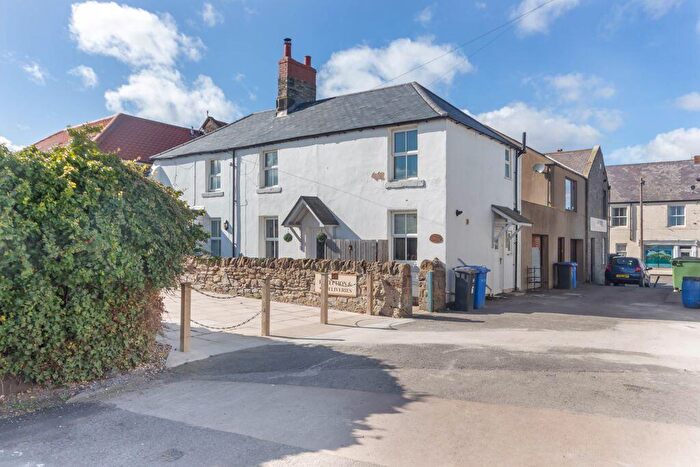
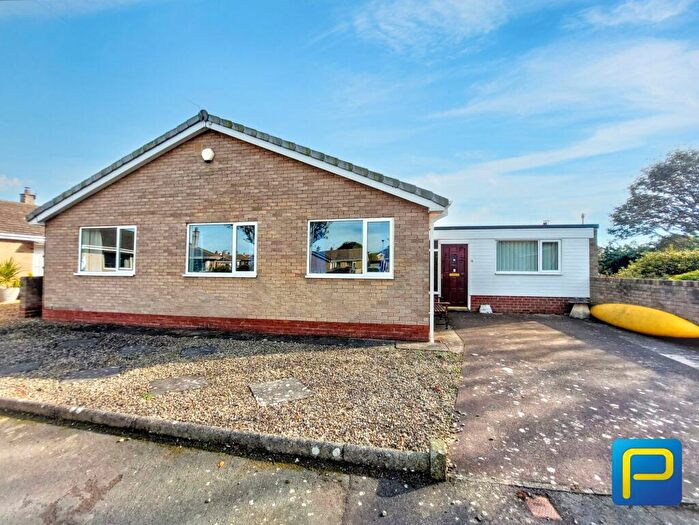
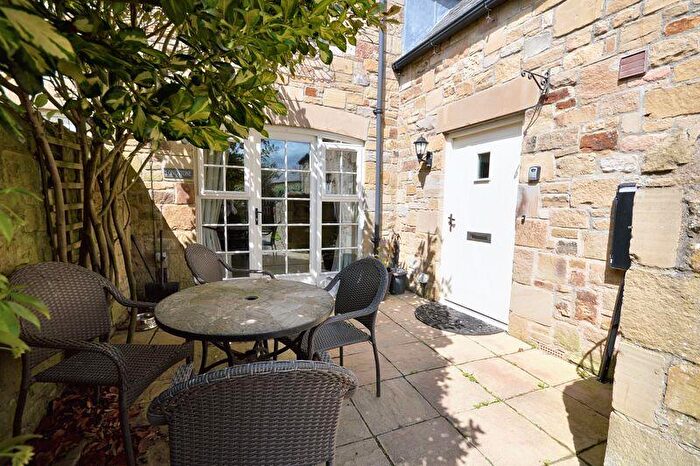
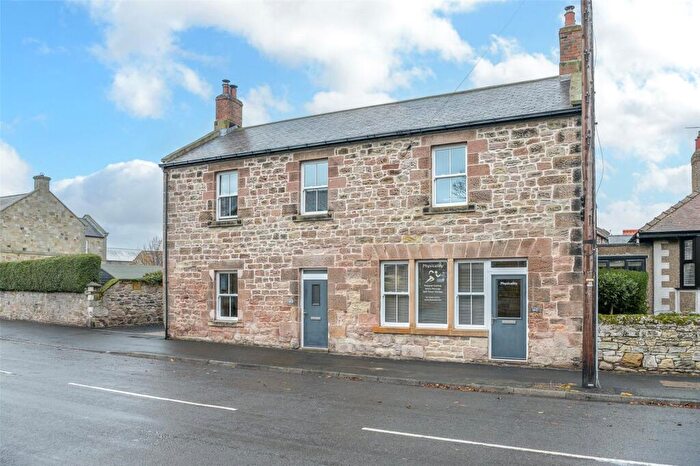
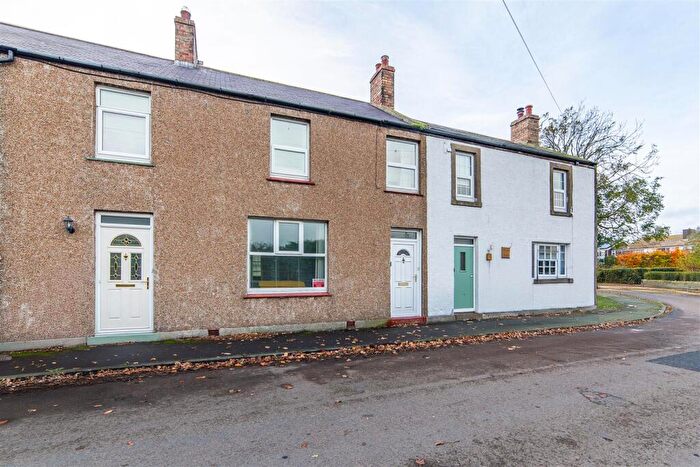
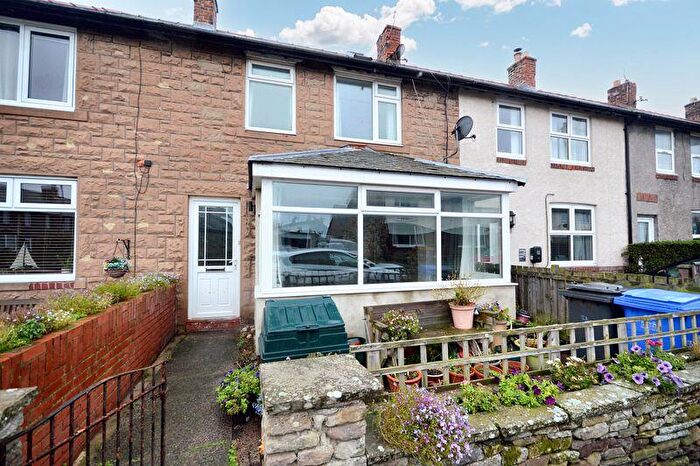
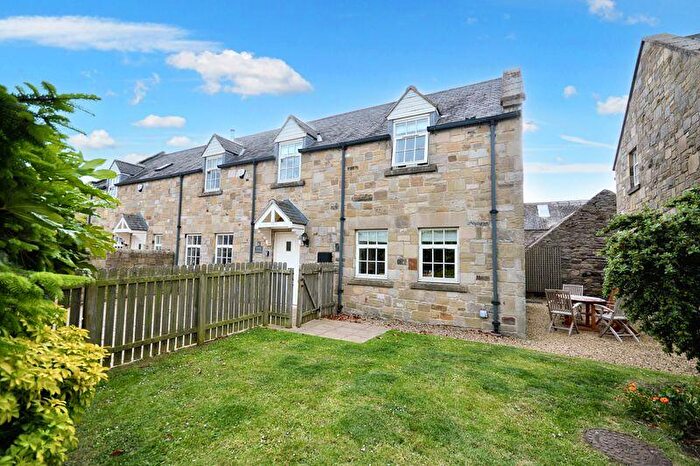
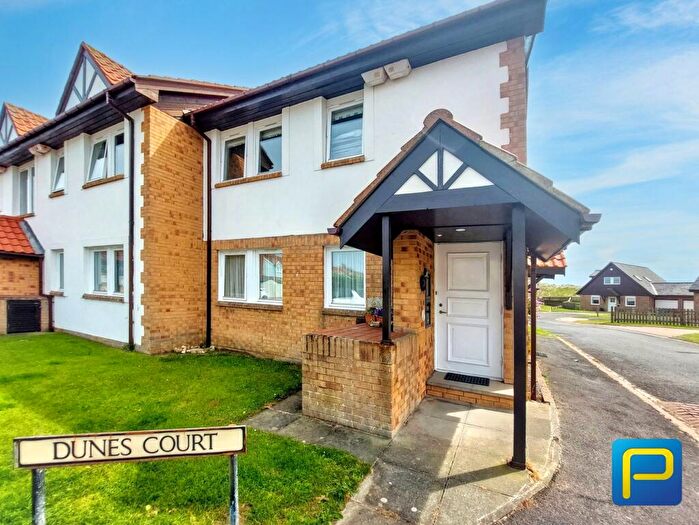
Properties for sale in Bamburgh
Roads and Postcodes in Bamburgh
Navigate through our locations to find the location of your next house in Bamburgh, Chathill for sale or to rent.
| Streets | Postcodes |
|---|---|
| Beadnell House Court | NE67 5BZ |
| Benthall | NE67 5BQ NE67 5FD |
| Benthall Farm | NE67 5JQ |
| Bernicia Way | NE67 5EJ |
| Church Cottages | NE67 5AS |
| Coble Way | NE67 5EP |
| Dunes Court | NE67 5EE |
| Harbour Road | NE67 5BB NE67 5BD NE67 5BE NE67 5BH NE67 5BJ |
| Kennedy Green | NE67 5DD |
| Longbeach Drive | NE67 5EG |
| Longstone Close | NE67 5BS |
| Longstone Crescent | NE67 5AL |
| Longstone Park | NE67 5BP |
| Meadow Lane | NE67 5AJ NE67 5AQ NE67 5AR |
| Sandy Lane Court | NE67 5EH |
| Smugglers Cove | NE67 5DB |
| St Ebbas Way | NE67 5GH |
| Swinhoe Road | NE67 5AG NE67 5BF |
| Tamarin Close | NE67 5JE |
| The Anchorage | NE67 5BY |
| The Haven | NE67 5AW |
| The Wamses | NE67 5BL |
| The Wynding | NE67 5AX NE67 5AY NE67 5AZ NE67 5BU |
| NE67 5AA NE67 5AD NE67 5AN NE67 5AT NE67 5BA NE67 5BT NE67 5EN NE67 5ER NE67 5EW NE67 5JP NE67 5JR NE67 5JU NE67 5AB NE67 5AE NE67 5BN NE67 5BX NE67 5DJ NE67 5HJ NE67 5HL NE67 5HQ NE67 5JS NE67 5JT NE67 5JX NE67 5LG NE67 5LH |
Transport near Bamburgh
- FAQ
- Price Paid By Year
- Property Type Price
Frequently asked questions about Bamburgh
What is the average price for a property for sale in Bamburgh?
The average price for a property for sale in Bamburgh is £330,164. This amount is 7% lower than the average price in Chathill. There are 384 property listings for sale in Bamburgh.
What streets have the most expensive properties for sale in Bamburgh?
The streets with the most expensive properties for sale in Bamburgh are Swinhoe Road at an average of £586,000, Bernicia Way at an average of £529,500 and Church Cottages at an average of £507,500.
What streets have the most affordable properties for sale in Bamburgh?
The streets with the most affordable properties for sale in Bamburgh are Longstone Park at an average of £188,266, Longstone Crescent at an average of £239,617 and Meadow Lane at an average of £242,000.
Which train stations are available in or near Bamburgh?
Some of the train stations available in or near Bamburgh are Chathill, Alnmouth and Acklington.
Property Price Paid in Bamburgh by Year
The average sold property price by year was:
| Year | Average Sold Price | Price Change |
Sold Properties
|
|---|---|---|---|
| 2025 | £303,233 | -12% |
15 Properties |
| 2024 | £340,357 | 2% |
35 Properties |
| 2023 | £331,912 | -29% |
27 Properties |
| 2022 | £429,078 | 20% |
16 Properties |
| 2021 | £344,120 | 19% |
25 Properties |
| 2020 | £277,277 | 2% |
32 Properties |
| 2019 | £272,518 | 10% |
24 Properties |
| 2018 | £246,527 | -4% |
24 Properties |
| 2017 | £256,429 | 22% |
29 Properties |
| 2016 | £198,810 | -27% |
53 Properties |
| 2015 | £253,203 | 1% |
41 Properties |
| 2014 | £251,149 | 15% |
26 Properties |
| 2013 | £213,618 | -3% |
22 Properties |
| 2012 | £219,394 | 9% |
19 Properties |
| 2011 | £199,274 | 3% |
46 Properties |
| 2010 | £193,875 | -15% |
18 Properties |
| 2009 | £223,546 | -12% |
27 Properties |
| 2008 | £251,289 | 5% |
30 Properties |
| 2007 | £239,092 | 20% |
52 Properties |
| 2006 | £191,403 | -6% |
25 Properties |
| 2005 | £202,559 | 8% |
39 Properties |
| 2004 | £187,286 | 29% |
26 Properties |
| 2003 | £132,667 | 15% |
43 Properties |
| 2002 | £113,304 | 9% |
52 Properties |
| 2001 | £102,976 | 32% |
56 Properties |
| 2000 | £69,519 | -14% |
23 Properties |
| 1999 | £79,306 | 1% |
38 Properties |
| 1998 | £78,705 | 25% |
28 Properties |
| 1997 | £58,932 | -3% |
24 Properties |
| 1996 | £60,650 | -4% |
23 Properties |
| 1995 | £63,226 | - |
18 Properties |
Property Price per Property Type in Bamburgh
Here you can find historic sold price data in order to help with your property search.
The average Property Paid Price for specific property types in the last three years are:
| Property Type | Average Sold Price | Sold Properties |
|---|---|---|
| Semi Detached House | £310,813.00 | 26 Semi Detached Houses |
| Detached House | £496,815.00 | 19 Detached Houses |
| Terraced House | £253,619.00 | 21 Terraced Houses |
| Flat | £234,181.00 | 11 Flats |

