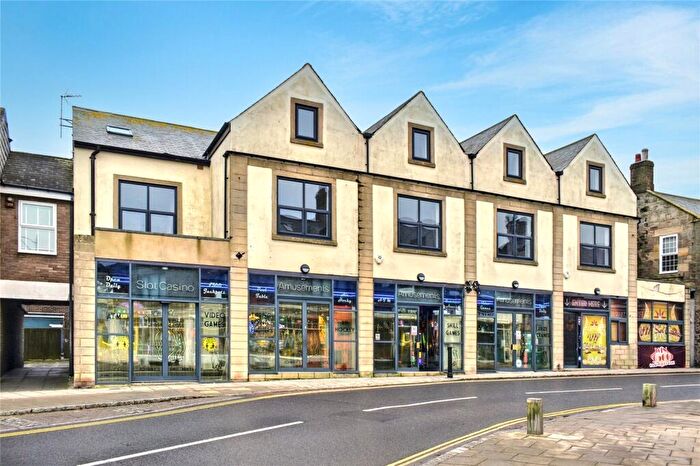
Houses for sale & to rent in Bamburgh, Seahouses
House Prices in Bamburgh
Properties in Bamburgh have an average house price of £312,478.00 and had 128 Property Transactions within the last 3 years¹.
Bamburgh is an area in Seahouses, Northumberland with 958 households², where the most expensive property was sold for £1,502,203.00.
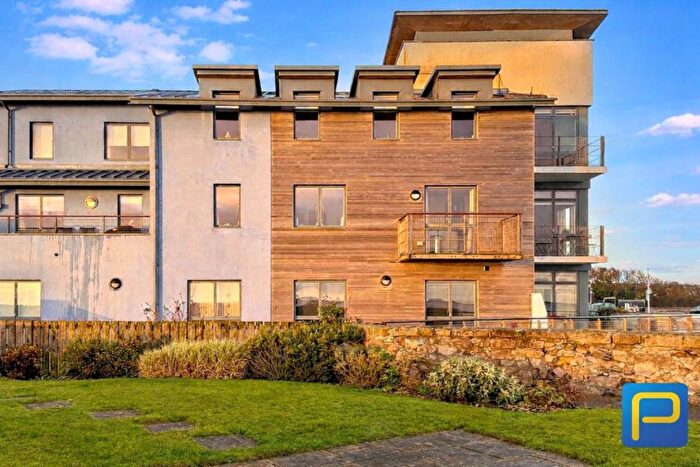
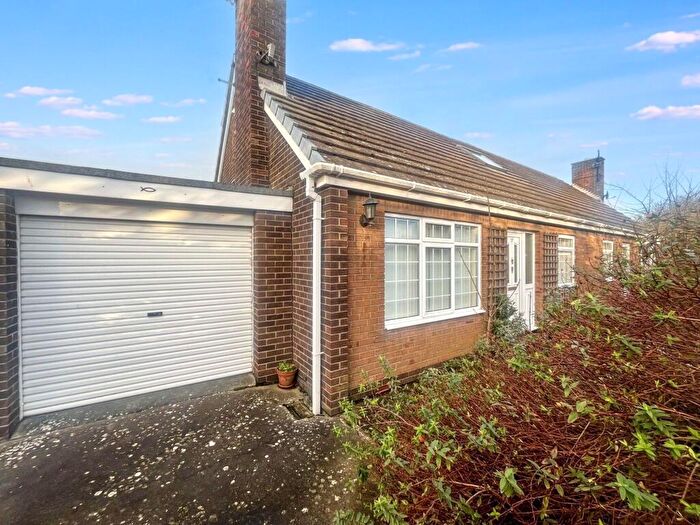
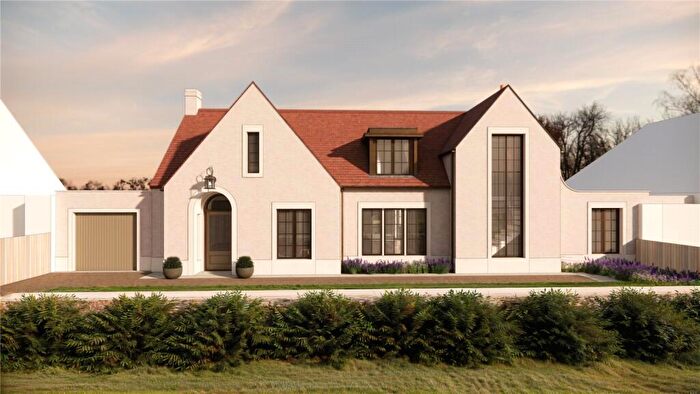
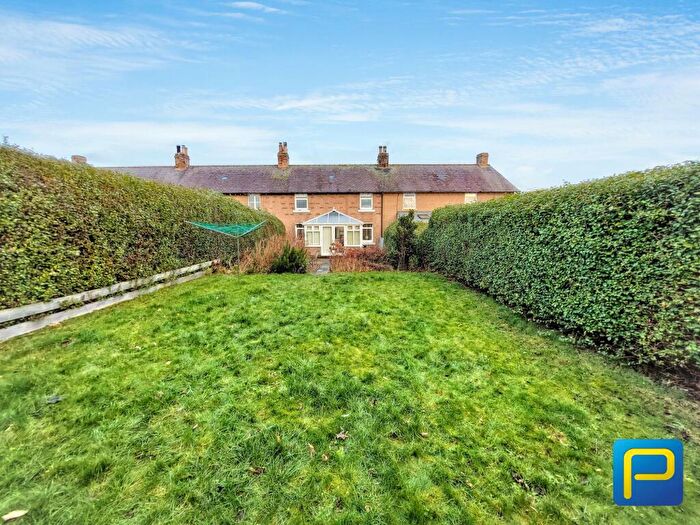
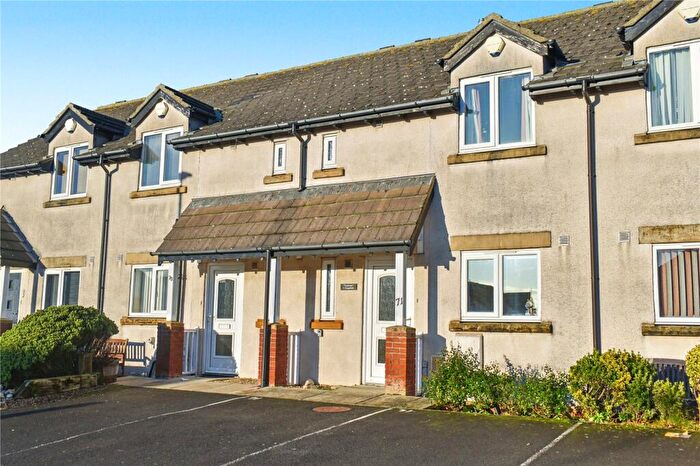
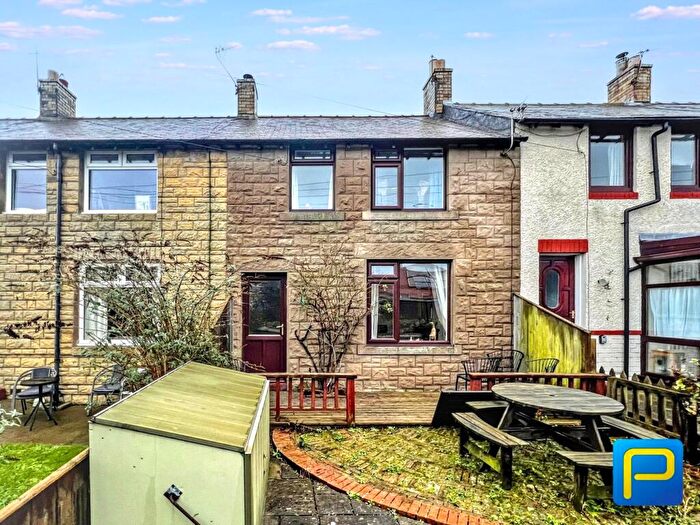
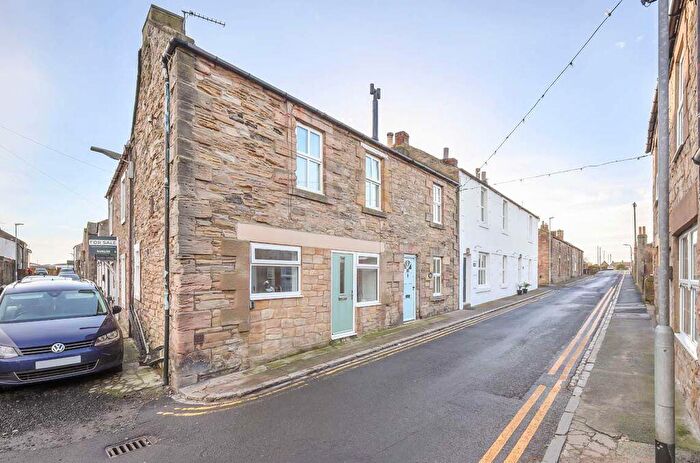
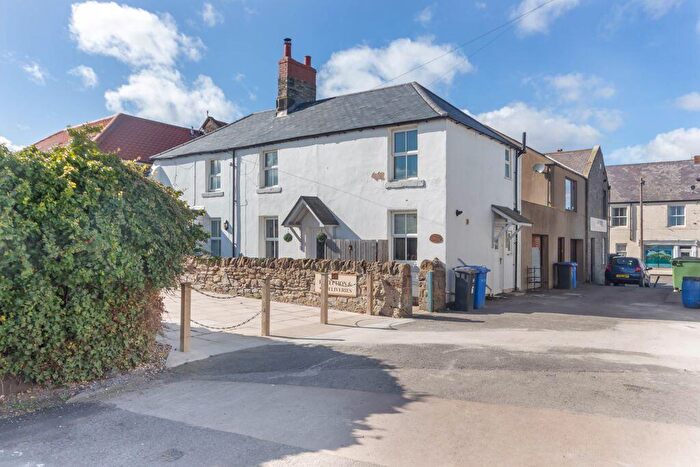
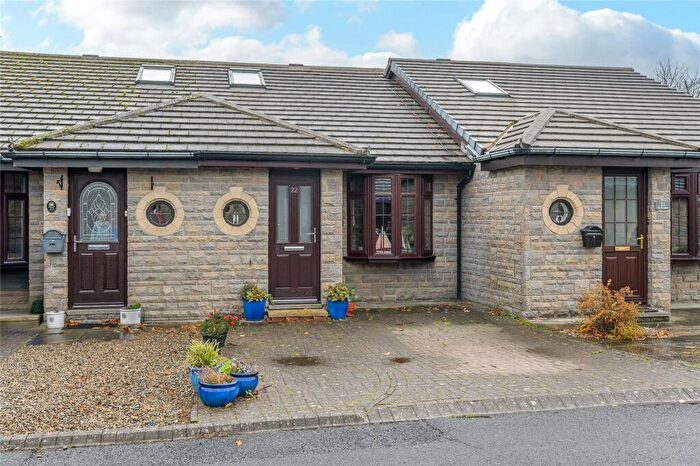
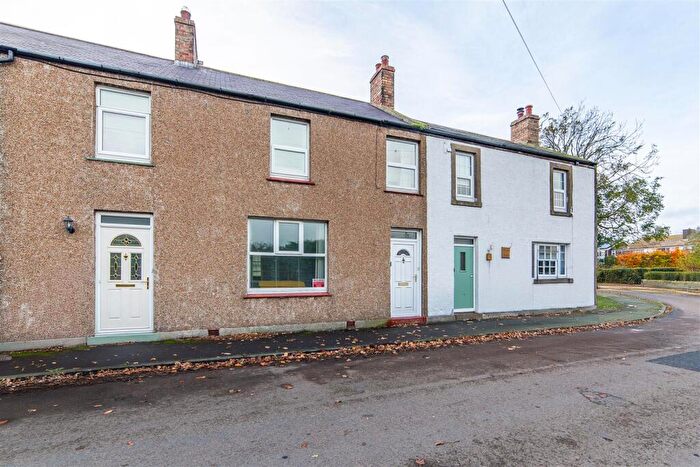
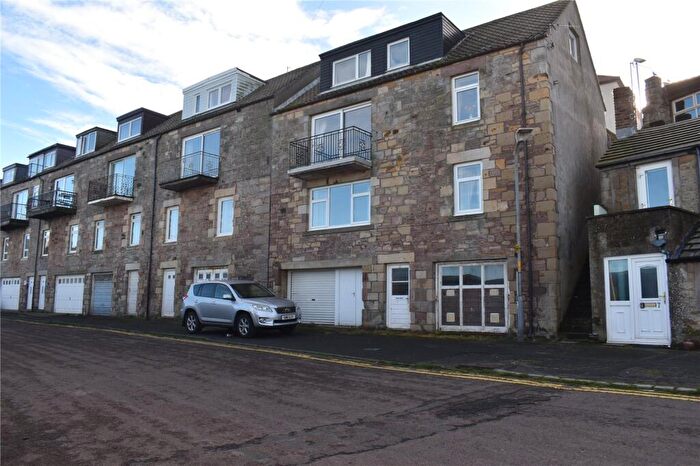
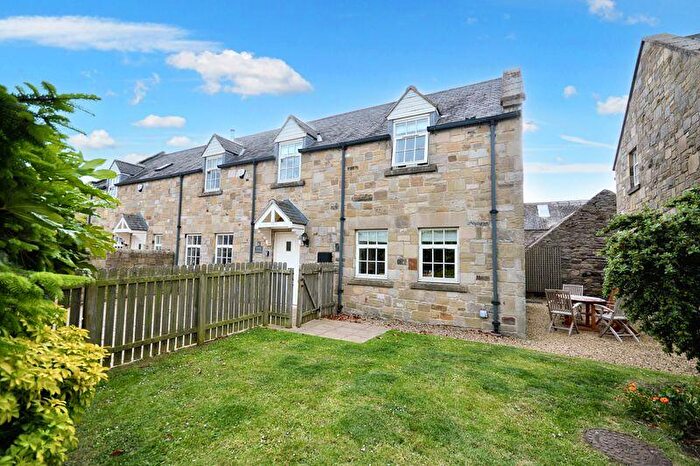
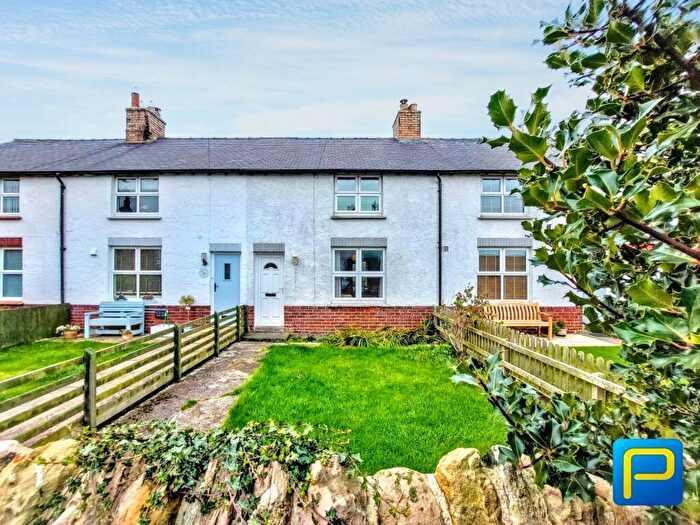
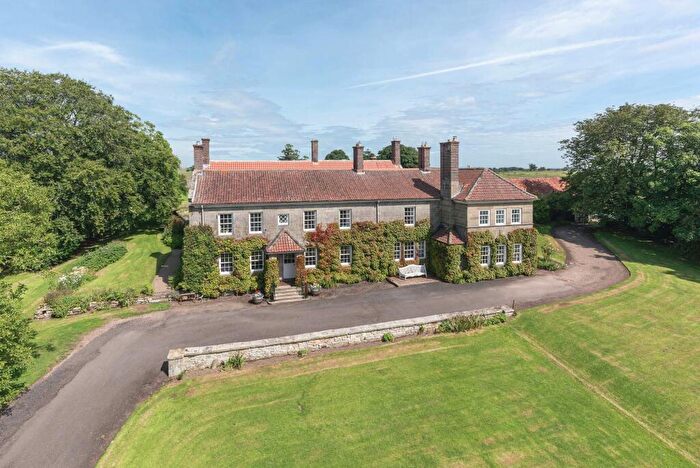
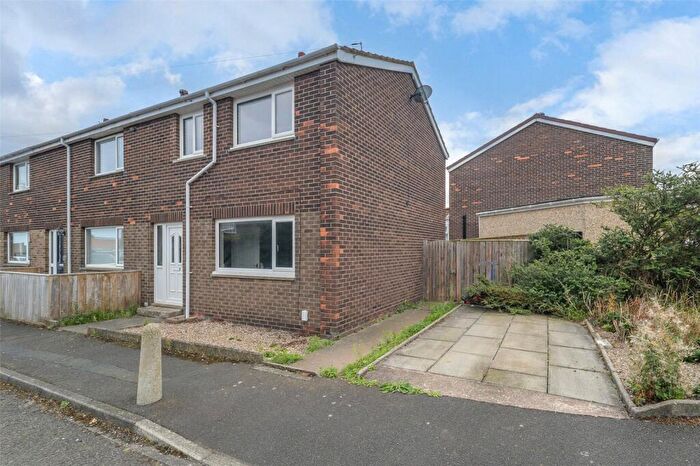
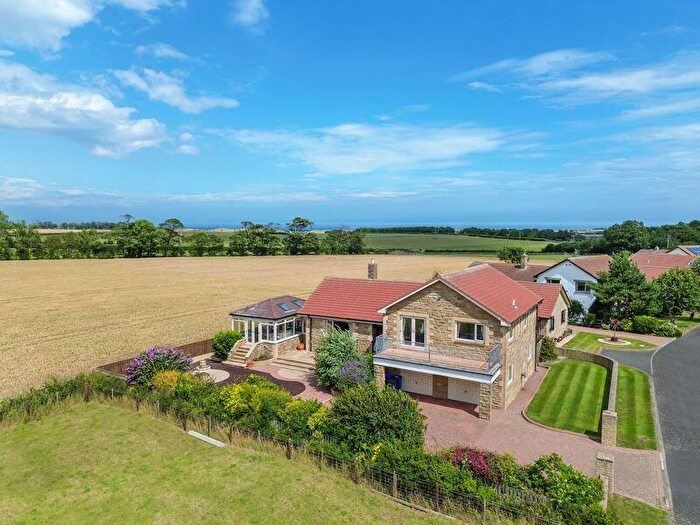
Properties for sale in Bamburgh
Roads and Postcodes in Bamburgh
Navigate through our locations to find the location of your next house in Bamburgh, Seahouses for sale or to rent.
| Streets | Postcodes |
|---|---|
| Bamburgh View | NE68 7WE |
| Beechcroft | NE68 7SE |
| Blackstone Lane | NE68 7AB |
| Brady Street | NE68 7RX |
| Braidstone Square | NE68 7RP |
| Brindles Manse | NE68 7WJ |
| Broad Road | NE68 7SU NE68 7UP |
| Broad Road Industrial Estate | NE68 7WF NE68 7WH |
| Brownsman Court | NE68 7YR |
| Castle Close | NE68 7BA |
| Castle Court | NE68 7BE |
| Castle Drive | NE68 7BB |
| Castle View | NE68 7BD |
| Chapel Row | NE68 7RL NE68 7TD |
| Craster Square | NE68 7RS |
| Crewe Street | NE68 7RW |
| Crown Street | NE68 7TQ NE68 7XL |
| Crumstone | NE68 7RJ |
| Dunstan View | NE68 7SF |
| East Fleetham Farm Cottages | NE68 7UX |
| Elford Farm Cottages | NE68 7UT |
| Farne Crescent | NE68 7ST |
| George Street | NE68 7RY |
| Harbour Road | NE68 7RN |
| Harcar Court | NE68 7YU |
| Islestone Drive | NE68 7XB |
| Jackson Place | NE68 7YJ |
| James Street | NE68 7XZ NE68 7YA NE68 7YB NE68 7YD NE68 7YE NE68 7YF |
| Jubilee Place | NE68 7RZ |
| King Street | NE68 7XN NE68 7XP NE68 7XR NE68 7XS NE68 7XW |
| Kings Field | NE68 7PA |
| Kippy Law | NE68 7YH |
| Main Street | NE68 7RD NE68 7RE NE68 7RG NE68 7RQ NE68 7TN NE68 7TP NE68 7TR NE68 7TS NE68 7TT NE68 7TU NE68 7TW NE68 7TX NE68 7TY NE68 7TZ NE68 7UA NE68 7UB NE68 7RF NE68 7UD NE68 7UE |
| Mayfield | NE68 7SG |
| Megstone Close | NE68 7XJ |
| Mitchell Avenue | NE68 7XY |
| North Lane | NE68 7UG NE68 7UQ |
| North Street | NE68 7SB NE68 7SD |
| Osborne Gardens | NE68 7UF |
| Osborne Terrace | NE68 7UH |
| Quarryfields | NE68 7TB |
| Regal Close | NE68 7US |
| Seafield Road | NE68 7QP NE68 7SJ NE68 7SL NE68 7SN NE68 7SP NE68 7SW |
| South Lane | NE68 7UJ NE68 7UL NE68 7UN |
| South Street | NE68 7RB |
| Southfield Avenue | NE68 7YT |
| St Aidans | NE68 7SR NE68 7SS |
| St Cuthbert Close | NE68 7WG |
| Staple Court | NE68 7YN |
| Stone Close | NE68 7YL NE68 7YW |
| Sunnieside Place | NE68 7RR |
| Taylor Street | NE68 7RU |
| The Croft | NE68 7XA |
| The Viking | NE68 7TA |
| Union Street | NE68 7RT |
| Village Farm | NE68 7TE |
| Weatherley Street | NE68 7SA |
| West View | NE68 7UW |
| NE68 7SX NE68 7SY NE68 7UR NE68 7SH NE68 7SQ NE68 7SZ NE68 7UU NE68 7UY NE68 7UZ NE68 7XT NE68 7YS |
Transport near Bamburgh
- FAQ
- Price Paid By Year
- Property Type Price
Frequently asked questions about Bamburgh
What is the average price for a property for sale in Bamburgh?
The average price for a property for sale in Bamburgh is £312,478. There are 344 property listings for sale in Bamburgh.
What streets have the most expensive properties for sale in Bamburgh?
The streets with the most expensive properties for sale in Bamburgh are St Aidans at an average of £559,000, St Cuthbert Close at an average of £550,000 and Harbour Road at an average of £525,000.
What streets have the most affordable properties for sale in Bamburgh?
The streets with the most affordable properties for sale in Bamburgh are Stone Close at an average of £155,833, James Street at an average of £156,875 and Craster Square at an average of £160,000.
Which train stations are available in or near Bamburgh?
Some of the train stations available in or near Bamburgh are Chathill, Alnmouth and Acklington.
Property Price Paid in Bamburgh by Year
The average sold property price by year was:
| Year | Average Sold Price | Price Change |
Sold Properties
|
|---|---|---|---|
| 2025 | £302,524 | -5% |
43 Properties |
| 2024 | £318,761 | 1% |
41 Properties |
| 2023 | £316,351 | -6% |
44 Properties |
| 2022 | £333,858 | 16% |
46 Properties |
| 2021 | £281,965 | 10% |
63 Properties |
| 2020 | £253,443 | 12% |
65 Properties |
| 2019 | £224,150 | -10% |
63 Properties |
| 2018 | £247,356 | 19% |
46 Properties |
| 2017 | £200,841 | -4% |
41 Properties |
| 2016 | £209,250 | 14% |
63 Properties |
| 2015 | £181,000 | -0,2% |
54 Properties |
| 2014 | £181,449 | -13% |
55 Properties |
| 2013 | £205,420 | 13% |
52 Properties |
| 2012 | £178,972 | -15% |
46 Properties |
| 2011 | £205,520 | -1% |
52 Properties |
| 2010 | £207,978 | 9% |
32 Properties |
| 2009 | £189,969 | -33% |
62 Properties |
| 2008 | £252,943 | 21% |
53 Properties |
| 2007 | £199,782 | 8% |
74 Properties |
| 2006 | £183,800 | -5% |
56 Properties |
| 2005 | £192,506 | 24% |
51 Properties |
| 2004 | £146,177 | 19% |
129 Properties |
| 2003 | £119,129 | 21% |
91 Properties |
| 2002 | £94,205 | 6% |
68 Properties |
| 2001 | £88,689 | 16% |
60 Properties |
| 2000 | £74,451 | 2% |
43 Properties |
| 1999 | £72,609 | 9% |
41 Properties |
| 1998 | £66,404 | 16% |
49 Properties |
| 1997 | £55,890 | 9% |
49 Properties |
| 1996 | £50,622 | -1% |
39 Properties |
| 1995 | £51,289 | - |
38 Properties |
Property Price per Property Type in Bamburgh
Here you can find historic sold price data in order to help with your property search.
The average Property Paid Price for specific property types in the last three years are:
| Property Type | Average Sold Price | Sold Properties |
|---|---|---|
| Semi Detached House | £298,261.00 | 26 Semi Detached Houses |
| Detached House | £401,051.00 | 43 Detached Houses |
| Terraced House | £249,686.00 | 52 Terraced Houses |
| Flat | £287,642.00 | 7 Flats |

