
Houses for sale & to rent in Sleekburn, Choppington
House Prices in Sleekburn
Properties in Sleekburn have an average house price of £87k and had 13 Property Transactions within the last 3 years¹.
Sleekburn is an area in Choppington, Northumberland with 134 households², where the most expensive property was sold for £130k.
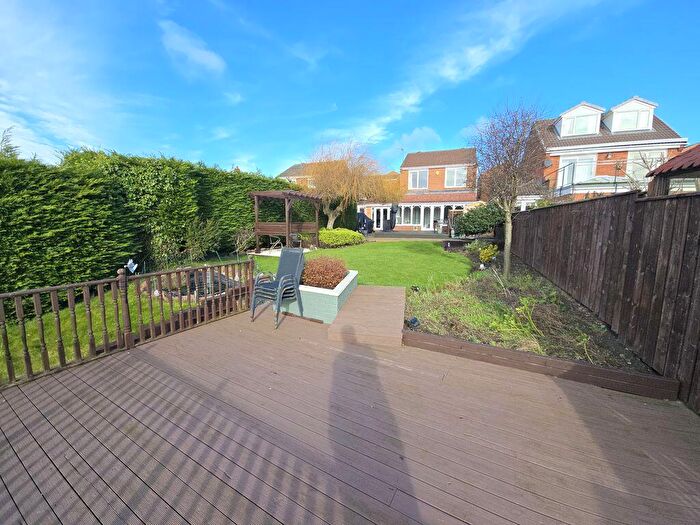
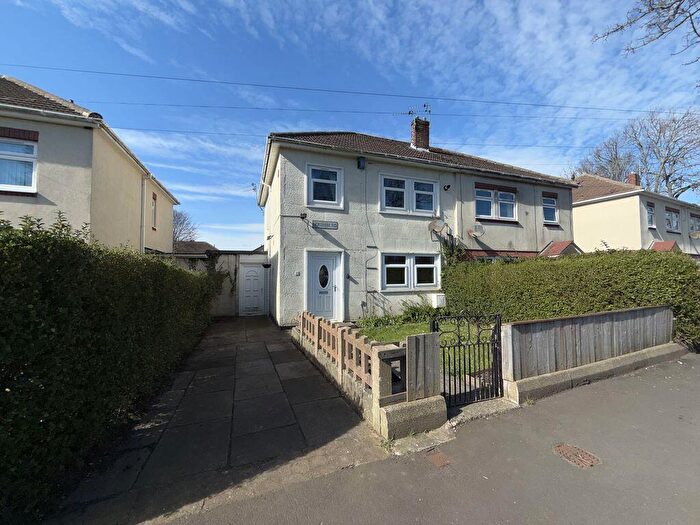
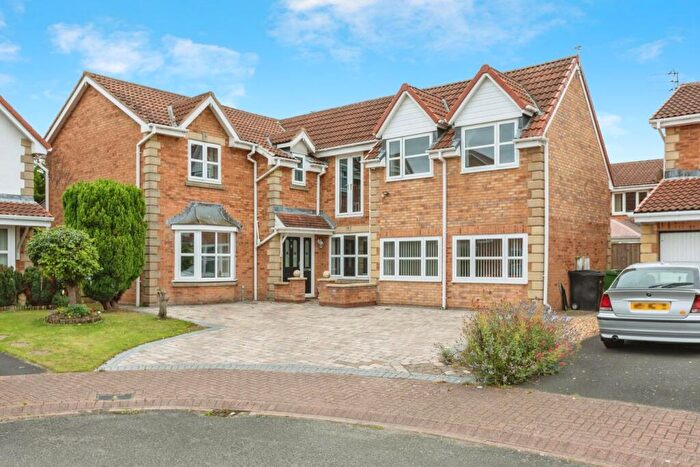
Properties for sale in Sleekburn
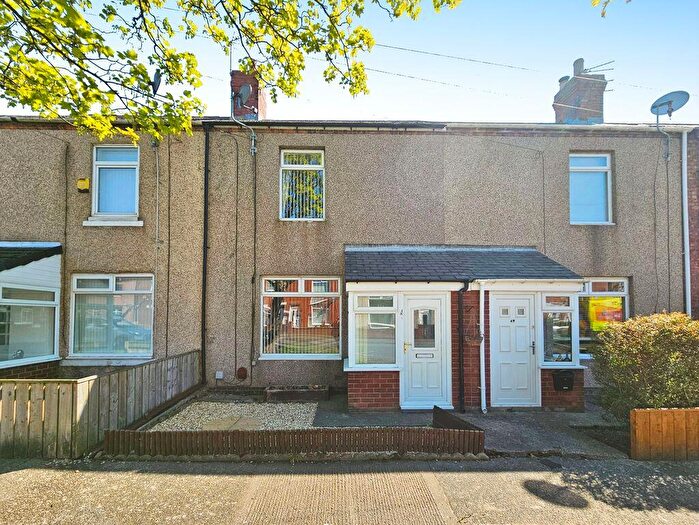

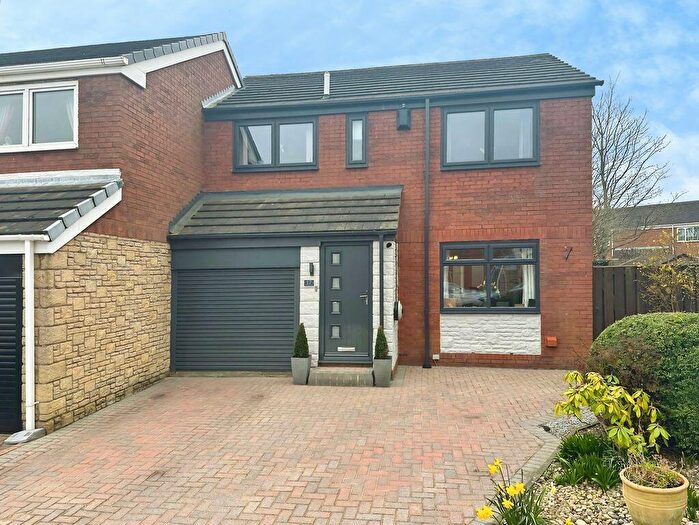
![]()
If you are looking to sell your house, let it out, or receive a property valuation, an expert can help you.
Click the button below to get started.


Previously listed properties in Sleekburn

Roads and Postcodes in Sleekburn
Navigate through our locations to find the location of your next house in Sleekburn, Choppington for sale or to rent.
| Streets | Postcodes |
|---|---|
| Chatton Wynd | NE62 5BW |
| Church Avenue | NE62 5XF NE62 5XG |
| Marshes Houses | NE62 5XD |
| Wansbeck Terrace | NE62 5XB |
| NE62 5XE |
Transport near Sleekburn

- FAQ
- Price Paid By Year
- Property Type Price
Frequently asked questions about Sleekburn
What is the average price for a property for sale in Sleekburn?
The average price for a property for sale in Sleekburn is £87,069. This amount is 35% lower than the average price in Choppington. There are 481 property listings for sale in Sleekburn.
What streets have the most expensive properties for sale in Sleekburn?
The streets with the most expensive properties for sale in Sleekburn are Chatton Wynd at an average of £114,862 and Church Avenue at an average of £81,492.
What streets have the most affordable properties for sale in Sleekburn?
The street with the most affordable properties for sale in Sleekburn is Marshes Houses at an average of £51,000.
Which train stations are available in or near Sleekburn?
Some of the train stations available in or near Sleekburn are Pegswood, Morpeth and Cramlington.
Property Price Paid in Sleekburn by Year
The average sold property price by year was:
| Year | Average Sold Price | Price Change |
Sold Properties
|
|---|---|---|---|
| 2025 | £89,741 | -6% |
6 Properties |
| 2024 | £95,500 | 20% |
3 Properties |
| 2023 | £76,737 | 10% |
4 Properties |
| 2022 | £68,745 | 2% |
10 Properties |
| 2021 | £67,250 | -21% |
4 Properties |
| 2020 | £81,500 | 18% |
2 Properties |
| 2019 | £66,600 | -8% |
5 Properties |
| 2018 | £71,800 | 31% |
3 Properties |
| 2017 | £49,900 | 2% |
5 Properties |
| 2016 | £48,750 | -47% |
2 Properties |
| 2015 | £71,600 | 17% |
5 Properties |
| 2014 | £59,500 | -13% |
2 Properties |
| 2012 | £67,000 | -50% |
1 Property |
| 2011 | £100,500 | 11% |
2 Properties |
| 2010 | £89,700 | -229% |
5 Properties |
| 2009 | £295,000 | 70% |
2 Properties |
| 2008 | £87,483 | -9% |
15 Properties |
| 2007 | £95,400 | 28% |
8 Properties |
| 2006 | £68,250 | -38% |
4 Properties |
| 2005 | £94,500 | 43% |
2 Properties |
| 2004 | £53,774 | 35% |
6 Properties |
| 2003 | £34,885 | 9% |
7 Properties |
| 2002 | £31,600 | 36% |
5 Properties |
| 2001 | £20,190 | 3% |
5 Properties |
| 2000 | £19,658 | -2% |
6 Properties |
| 1999 | £20,000 | -23% |
1 Property |
| 1998 | £24,500 | 35% |
2 Properties |
| 1997 | £15,900 | 28% |
5 Properties |
| 1996 | £11,500 | -87% |
1 Property |
| 1995 | £21,500 | - |
2 Properties |
Property Price per Property Type in Sleekburn
Here you can find historic sold price data in order to help with your property search.
The average Property Paid Price for specific property types in the last three years are:
| Property Type | Average Sold Price | Sold Properties |
|---|---|---|
| Semi Detached House | £81,492.00 | 7 Semi Detached Houses |
| Terraced House | £114,862.00 | 4 Terraced Houses |
| Flat | £51,000.00 | 2 Flats |