
Houses for sale & to rent in NE48 2AL, Brookside Place, Bellingham, Hexham
House Prices in NE48 2AL, Brookside Place, Bellingham
Properties in NE48 2AL have no sales history available within the last 3 years. NE48 2AL is a postcode in Brookside Place located in Bellingham, an area in Hexham, Northumberland, with 2 households².
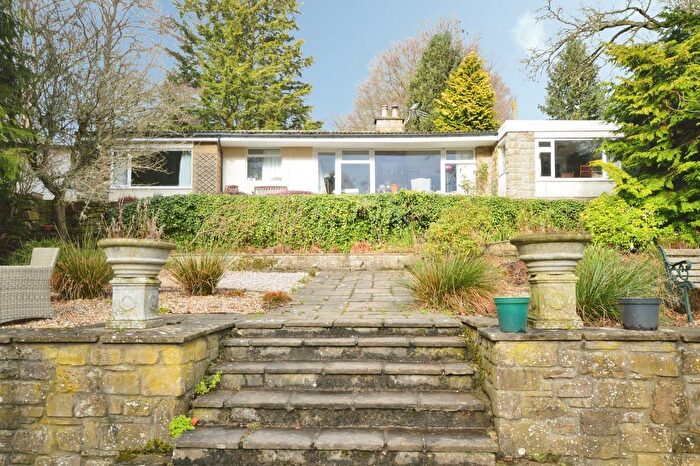
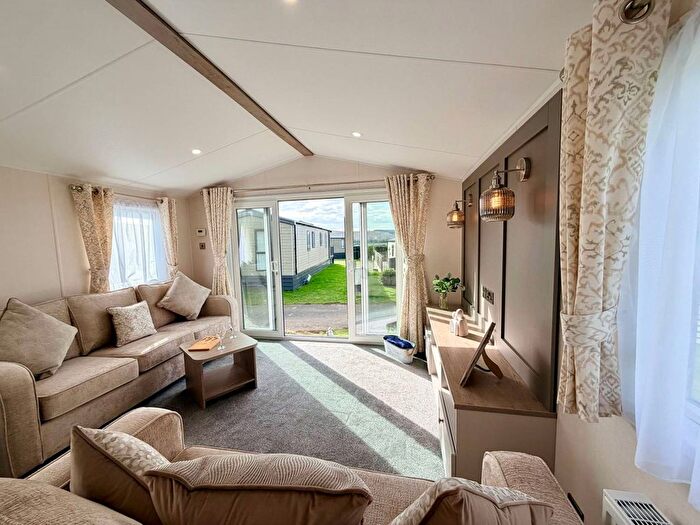
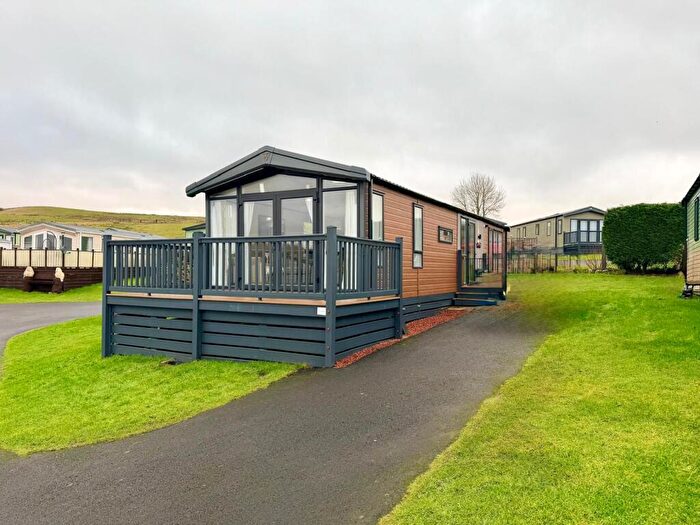
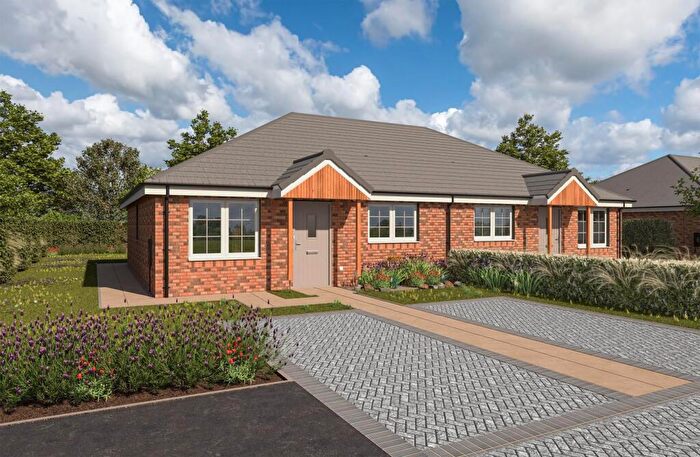
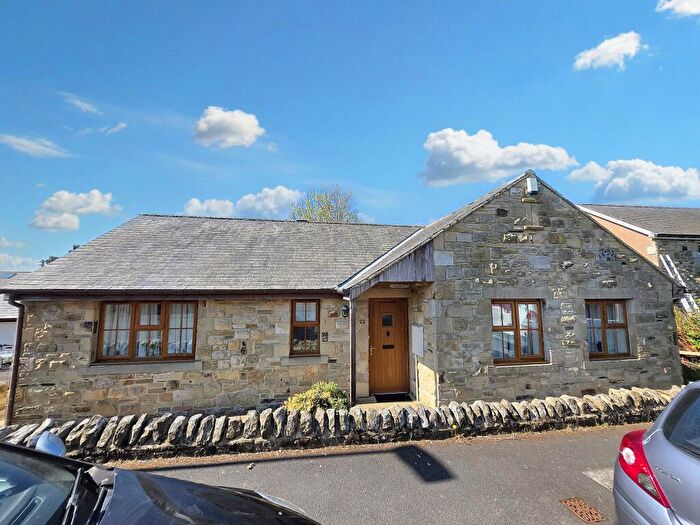
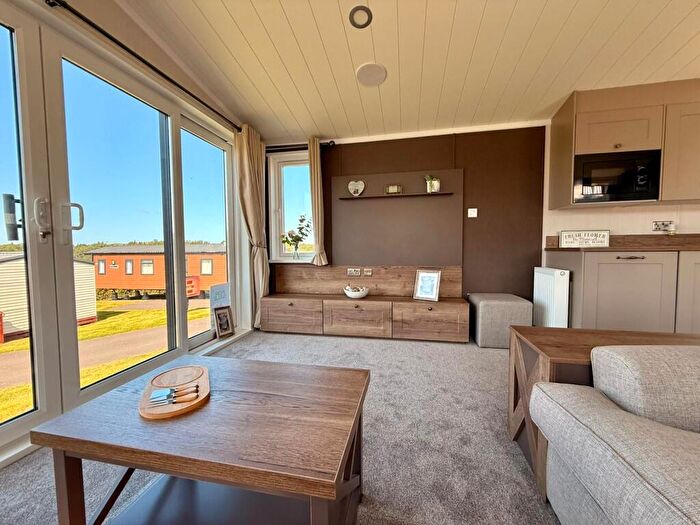
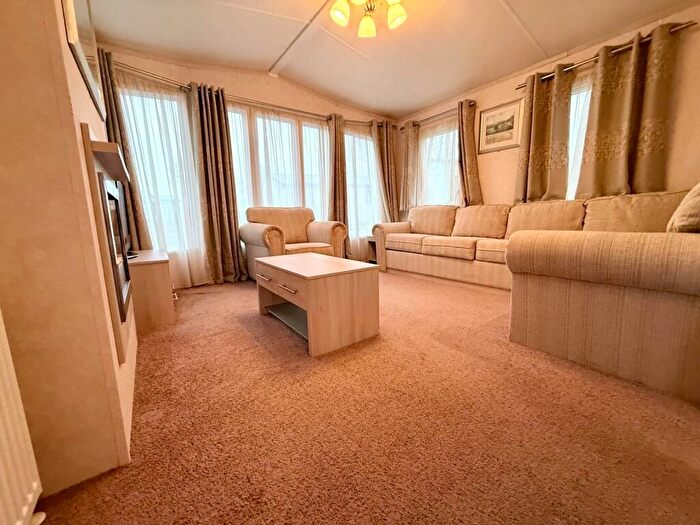
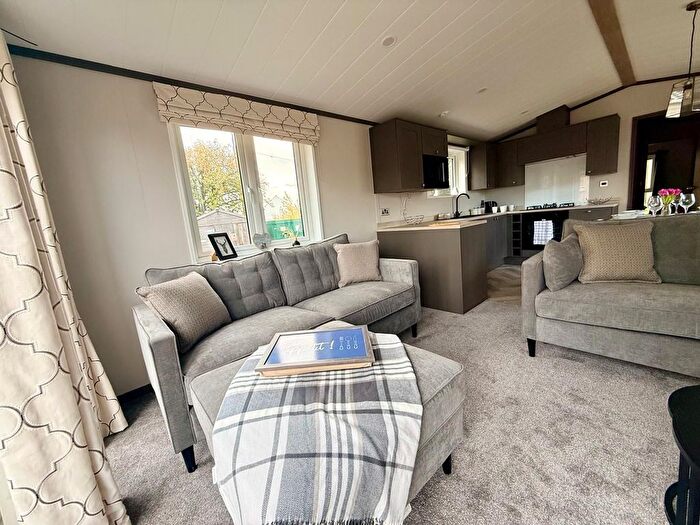
Properties for sale near NE48 2AL, Brookside Place

![]()
If you are looking to sell your house, let it out, or receive a property valuation, an expert can help you.
Click the button below to get started.
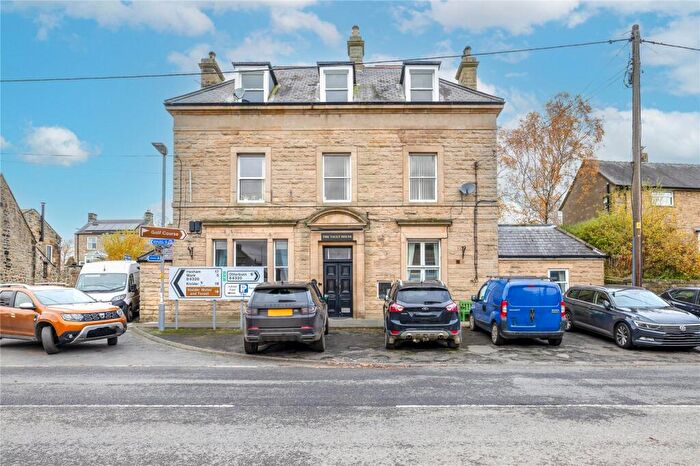
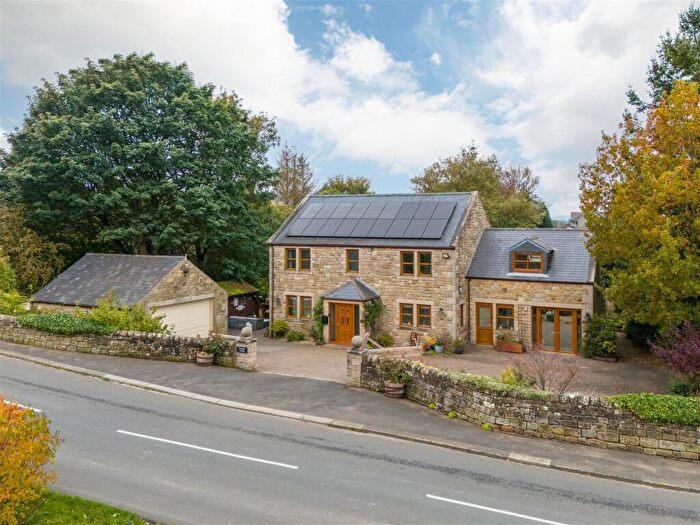
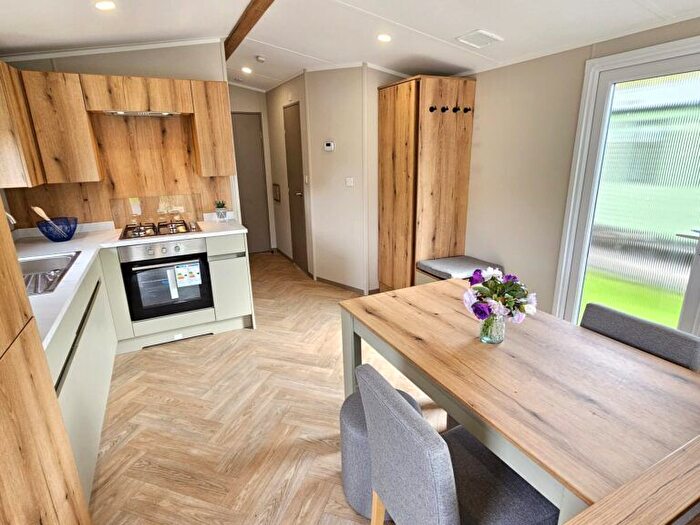
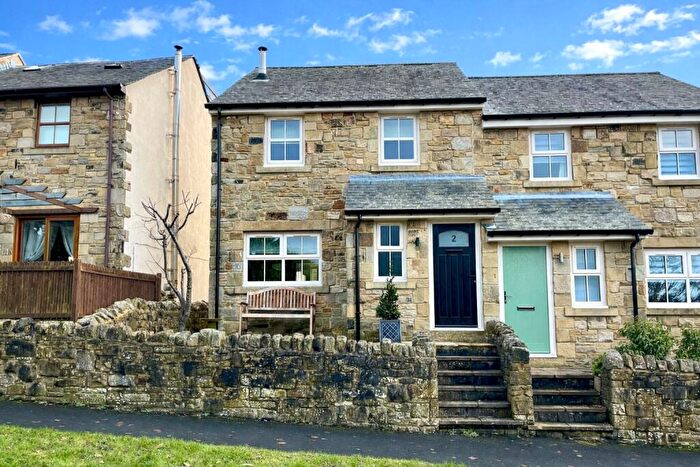
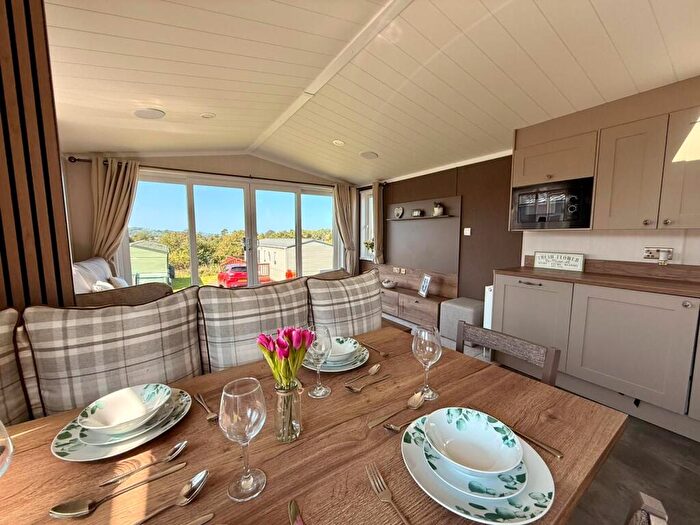
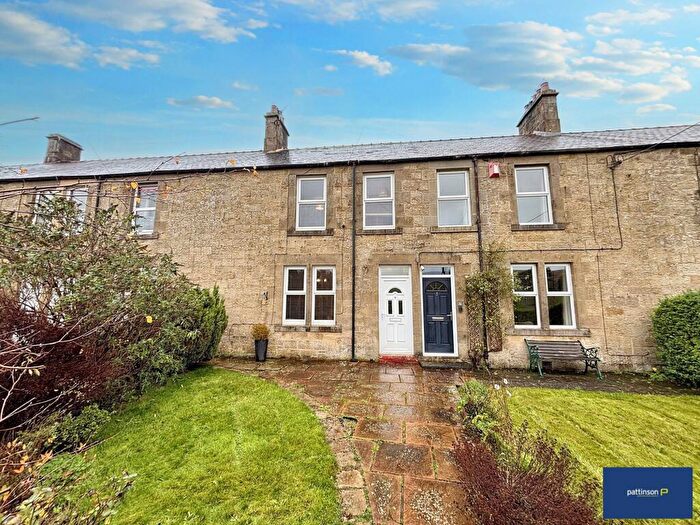
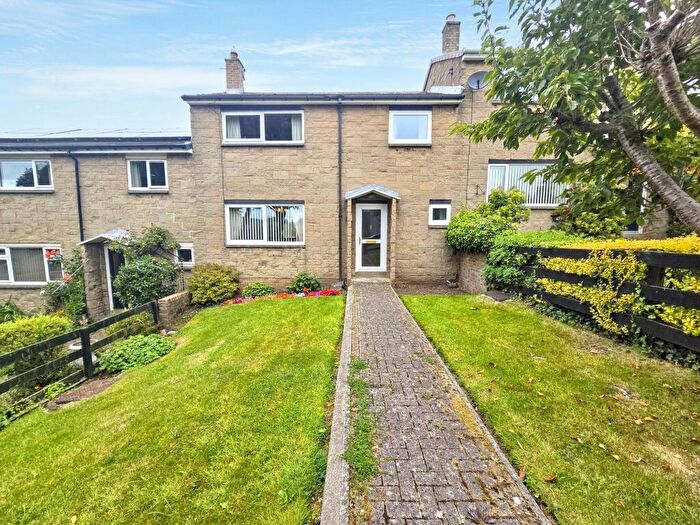
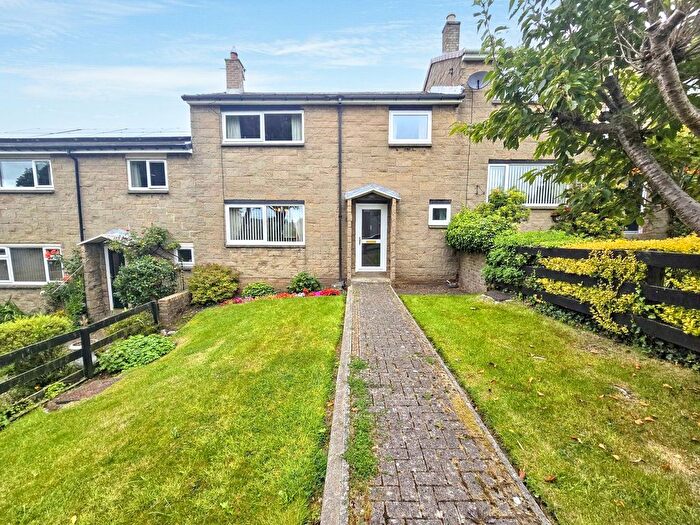
Previously listed properties near NE48 2AL, Brookside Place

![]()
If you are looking to sell your house, let it out, or receive a property valuation, an expert can help you.
Click the button below to get started.
Price Paid in Brookside Place, NE48 2AL, Bellingham
2 Brookside Place, NE48 2AL, Bellingham Hexham
Property 2 has been sold 6 times. The last time it was sold was in 19/08/2021 and the sold price was £128,500.00.
This terraced house, sold as a freehold on 19/08/2021, is a 67 sqm mid-terrace house with an EPC rating of D.
| Date | Price | Property Type | Tenure | Classification |
|---|---|---|---|---|
| 19/08/2021 | £128,500.00 | Terraced House | freehold | Established Building |
| 29/03/2016 | £117,000.00 | Terraced House | freehold | Established Building |
| 23/03/2006 | £107,950.00 | Terraced House | freehold | Established Building |
| 06/05/2005 | £101,500.00 | Terraced House | freehold | Established Building |
| 21/09/2001 | £53,000.00 | Terraced House | freehold | Established Building |
| 20/03/1998 | £40,500.00 | Terraced House | freehold | Established Building |
1 Brookside Place, NE48 2AL, Bellingham Hexham
Property 1 has been sold 2 times. The last time it was sold was in 16/11/2016 and the sold price was £120,000.00.
This terraced house, sold as a freehold on 16/11/2016, is a 63 sqm end-terrace house with an EPC rating of F.
| Date | Price | Property Type | Tenure | Classification |
|---|---|---|---|---|
| 16/11/2016 | £120,000.00 | Terraced House | freehold | Established Building |
| 17/12/2014 | £76,000.00 | Terraced House | freehold | Established Building |
Transport near NE48 2AL, Brookside Place

House price paid reports for NE48 2AL, Brookside Place
Click on the buttons below to see price paid reports by year or property price:
- Price Paid By Year
Property Price Paid in NE48 2AL, Brookside Place by Year
The average sold property price by year was:
| Year | Average Sold Price | Price Change |
Sold Properties
|
|---|---|---|---|
| 2021 | £128,500 | 8% |
1 Property |
| 2016 | £118,500 | 36% |
2 Properties |
| 2014 | £76,000 | -42% |
1 Property |
| 2006 | £107,950 | 6% |
1 Property |
| 2005 | £101,500 | 48% |
1 Property |
| 2001 | £53,000 | 24% |
1 Property |
| 1998 | £40,500 | - |
1 Property |