
Houses for sale & to rent in Longhorsley, Morpeth
House Prices in Longhorsley
Properties in Longhorsley have an average house price of £417k and had 212 Property Transactions within the last 3 years¹.
Longhorsley is an area in Morpeth, Northumberland with 1,666 households², where the most expensive property was sold for £2.7M.
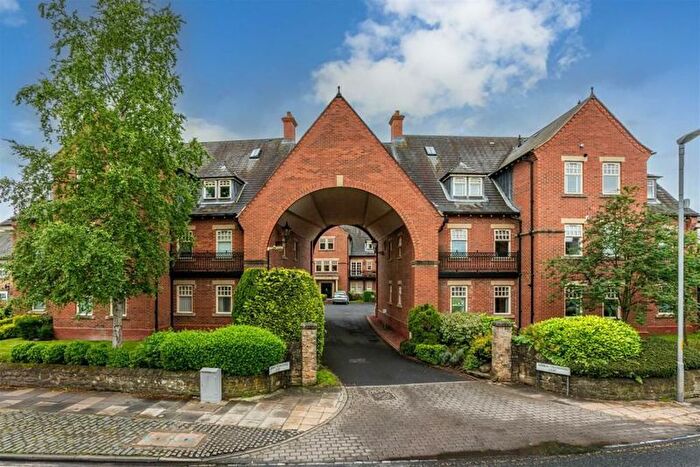
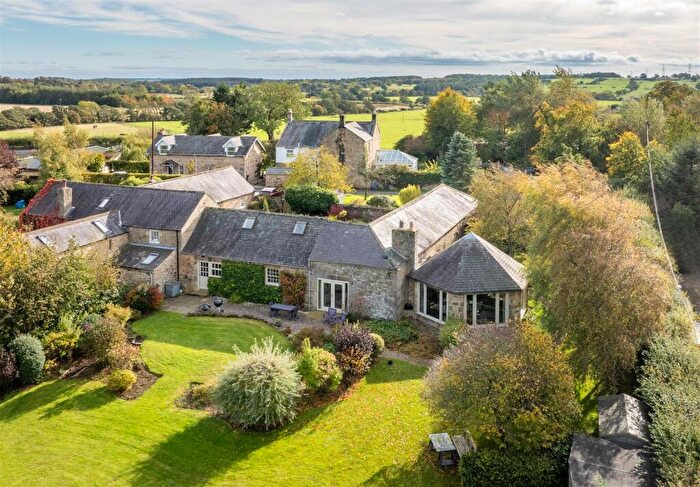
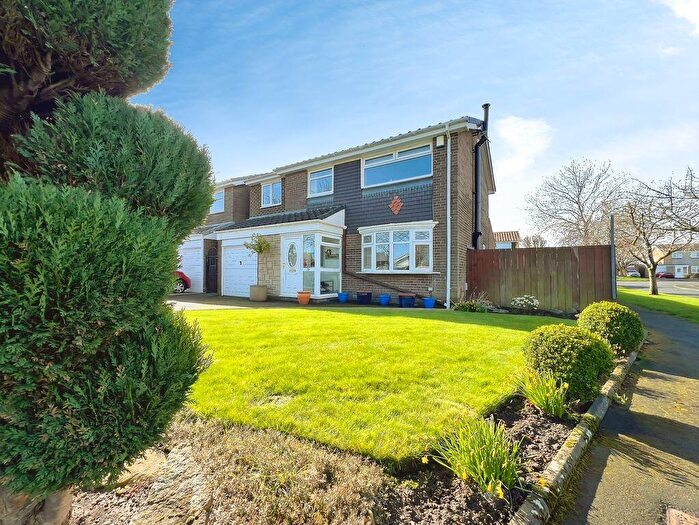
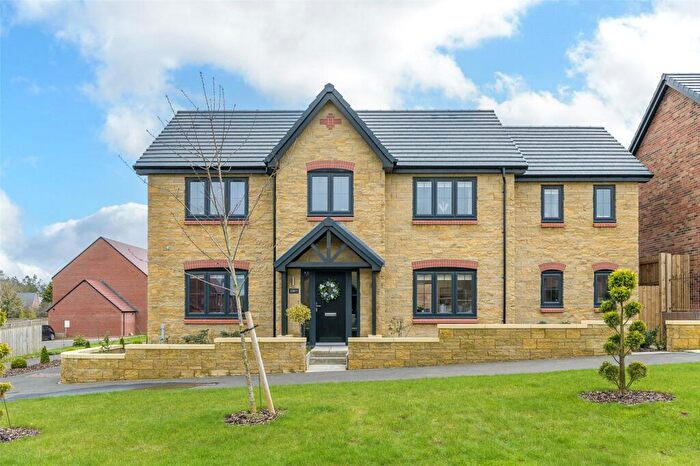
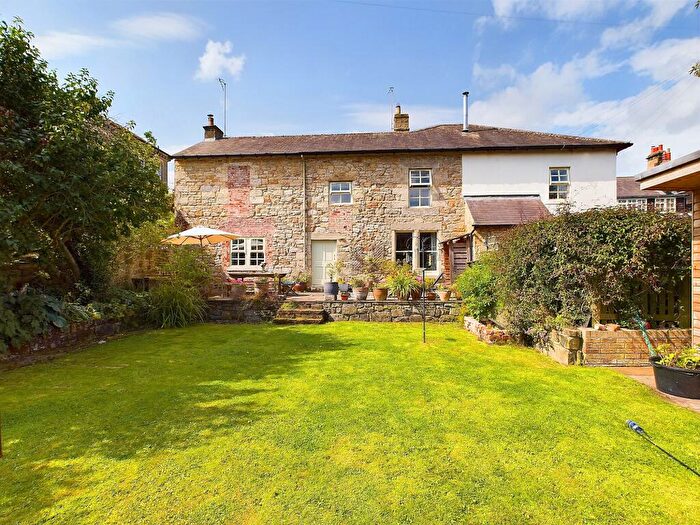
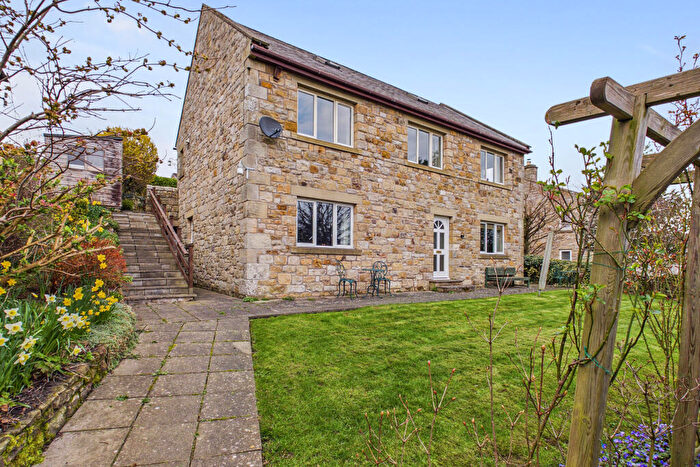
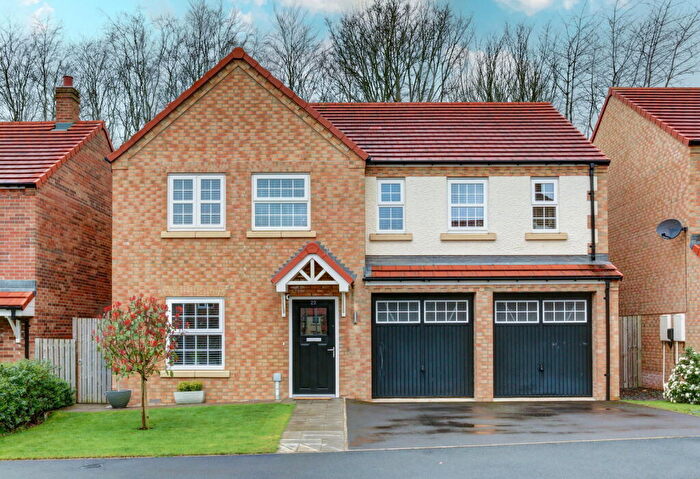
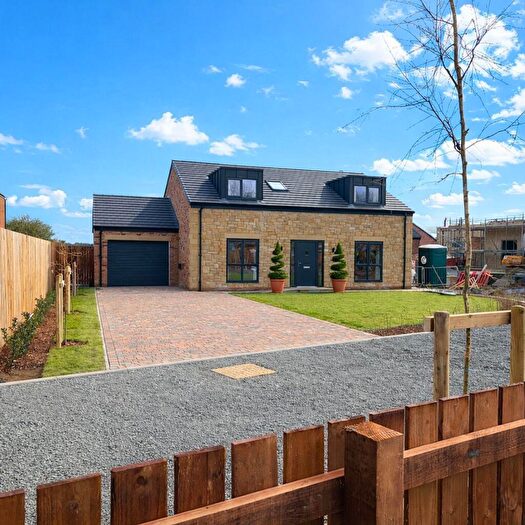
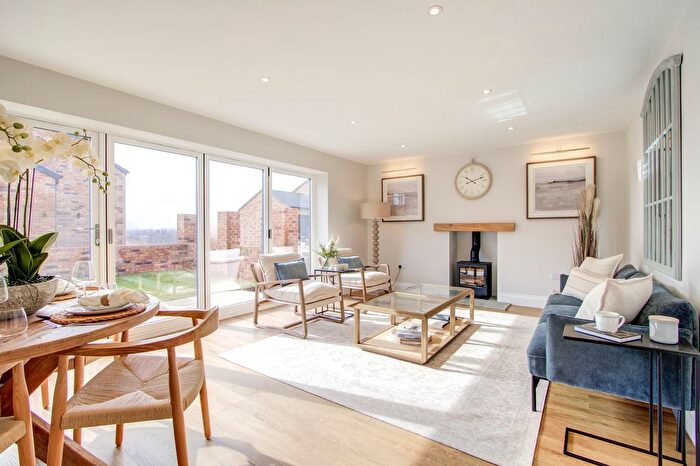
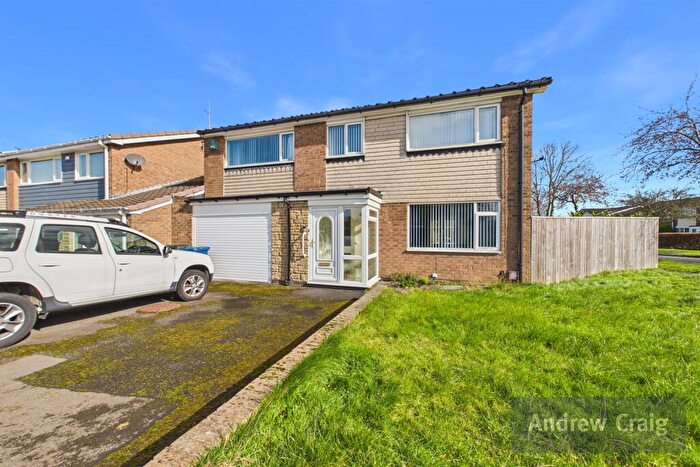
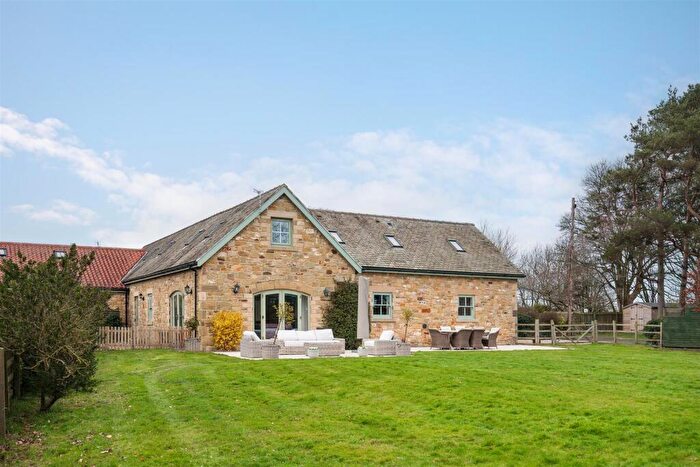
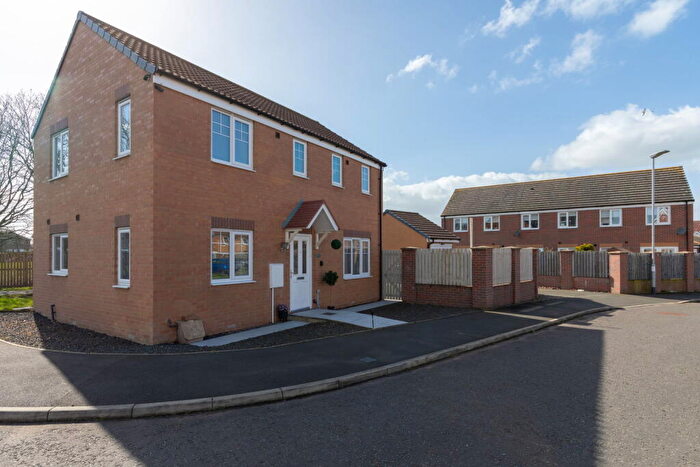
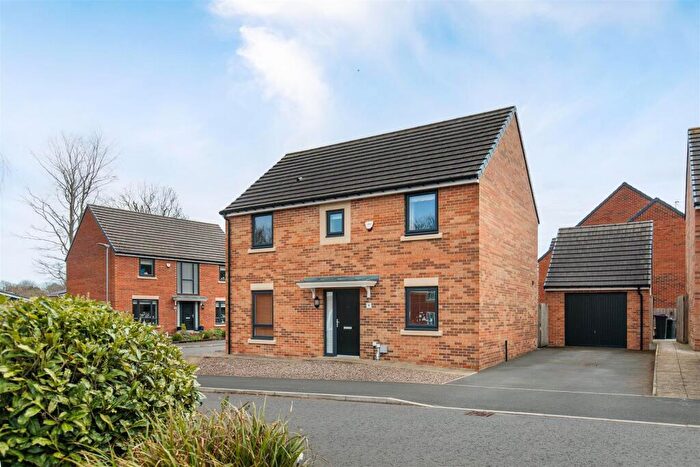
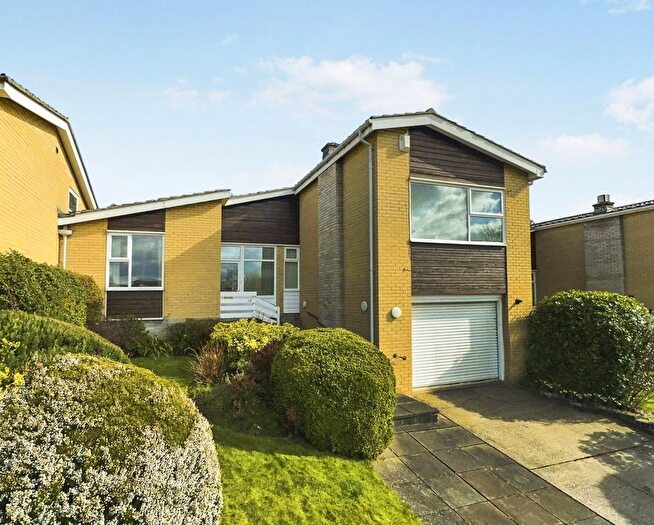
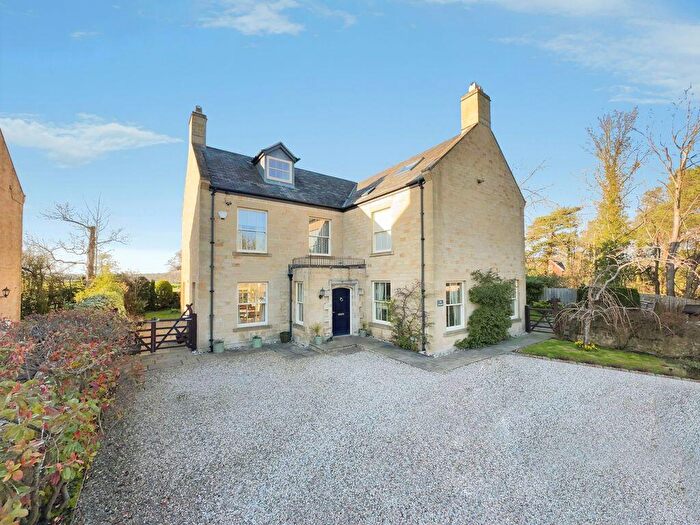
Properties for sale in Longhorsley
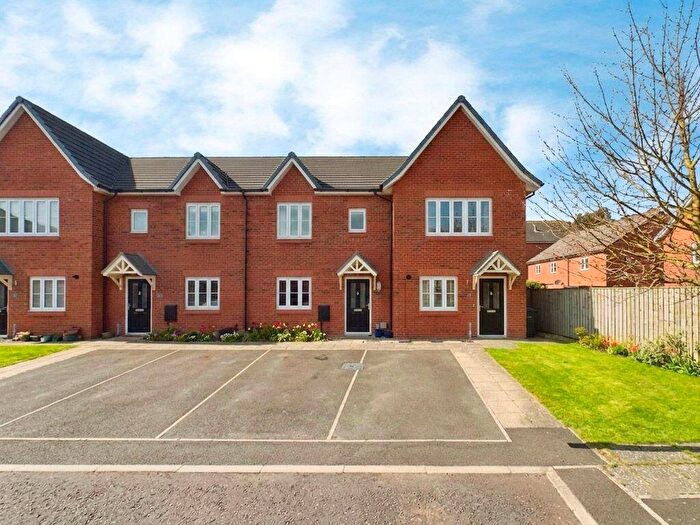

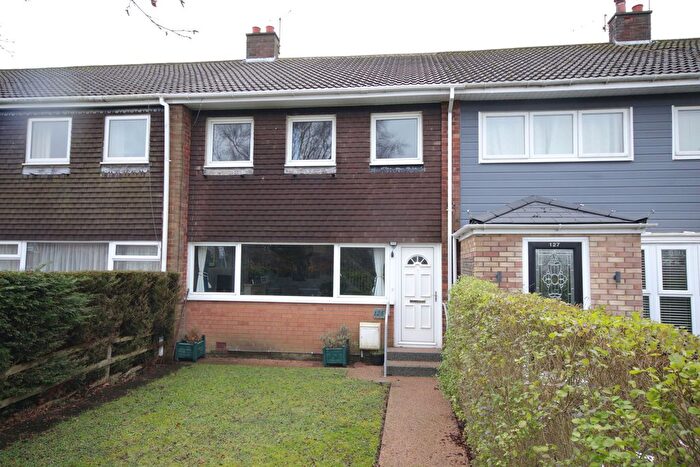
![]()
If you are looking to sell your house, let it out, or receive a property valuation, an expert can help you.
Click the button below to get started.


Roads and Postcodes in Longhorsley
Navigate through our locations to find the location of your next house in Longhorsley, Morpeth for sale or to rent.
Transport near Longhorsley

- FAQ
- Price Paid By Year
- Property Type Price
Frequently asked questions about Longhorsley
What is the average price for a property for sale in Longhorsley?
The average price for a property for sale in Longhorsley is £417,422. This amount is 51% higher than the average price in Morpeth. There are 5,581 property listings for sale in Longhorsley.
What streets have the most expensive properties for sale in Longhorsley?
The streets with the most expensive properties for sale in Longhorsley are Gubeon Wood at an average of £1,875,000, Ashford Grove at an average of £1,101,666 and Field House Close at an average of £1,062,666.
What streets have the most affordable properties for sale in Longhorsley?
The streets with the most affordable properties for sale in Longhorsley are Oakford at an average of £167,000, Cordwainers at an average of £177,933 and Park Side at an average of £190,250.
Which train stations are available in or near Longhorsley?
Some of the train stations available in or near Longhorsley are Morpeth, Pegswood and Widdrington.
Property Price Paid in Longhorsley by Year
The average sold property price by year was:
| Year | Average Sold Price | Price Change |
Sold Properties
|
|---|---|---|---|
| 2026 | £308,333 | -42% |
3 Properties |
| 2025 | £437,235 | 13% |
67 Properties |
| 2024 | £379,785 | -17% |
75 Properties |
| 2023 | £444,625 | 8% |
67 Properties |
| 2022 | £410,311 | 4% |
94 Properties |
| 2021 | £395,423 | 21% |
128 Properties |
| 2020 | £311,926 | 20% |
101 Properties |
| 2019 | £250,353 | -11% |
126 Properties |
| 2018 | £277,902 | 5% |
107 Properties |
| 2017 | £263,721 | -48% |
134 Properties |
| 2016 | £389,144 | -4% |
78 Properties |
| 2015 | £403,337 | 12% |
50 Properties |
| 2014 | £356,952 | -12% |
51 Properties |
| 2013 | £400,288 | 1% |
43 Properties |
| 2012 | £397,983 | 29% |
33 Properties |
| 2011 | £282,710 | -11% |
28 Properties |
| 2010 | £314,557 | -16% |
34 Properties |
| 2009 | £364,247 | 2% |
38 Properties |
| 2008 | £356,695 | -35% |
41 Properties |
| 2007 | £483,190 | 3% |
60 Properties |
| 2006 | £468,730 | 30% |
50 Properties |
| 2005 | £327,446 | 9% |
58 Properties |
| 2004 | £298,950 | -1% |
52 Properties |
| 2003 | £303,134 | 32% |
70 Properties |
| 2002 | £207,389 | 20% |
66 Properties |
| 2001 | £165,242 | 10% |
69 Properties |
| 2000 | £149,242 | 6% |
65 Properties |
| 1999 | £139,759 | 14% |
77 Properties |
| 1998 | £119,873 | -13% |
75 Properties |
| 1997 | £135,328 | 24% |
73 Properties |
| 1996 | £102,333 | -12% |
98 Properties |
| 1995 | £114,880 | - |
31 Properties |
Property Price per Property Type in Longhorsley
Here you can find historic sold price data in order to help with your property search.
The average Property Paid Price for specific property types in the last three years are:
| Property Type | Average Sold Price | Sold Properties |
|---|---|---|
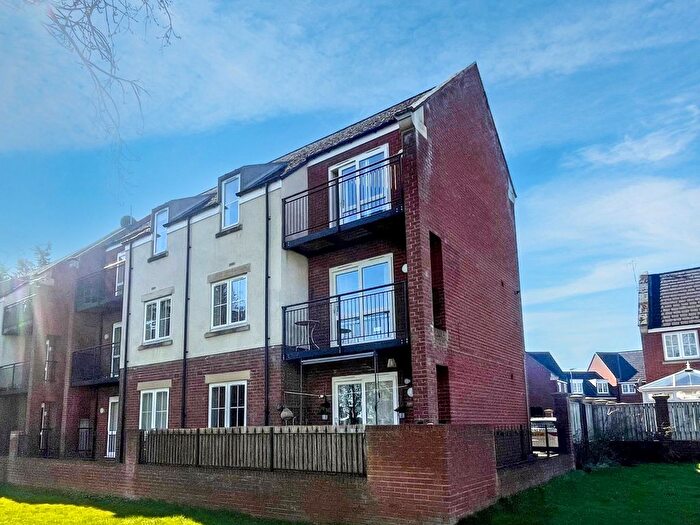
| Flat | £278,750.00 | 4 Flats |
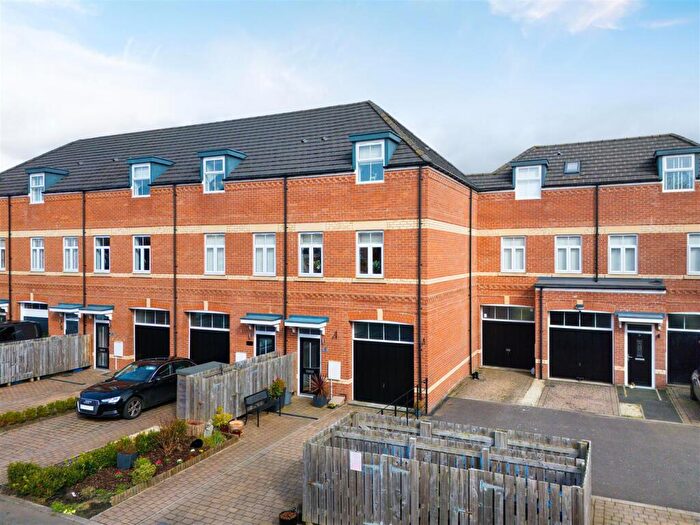
| Semi Detached House | £260,753.00 | 62 Semi Detached Houses |
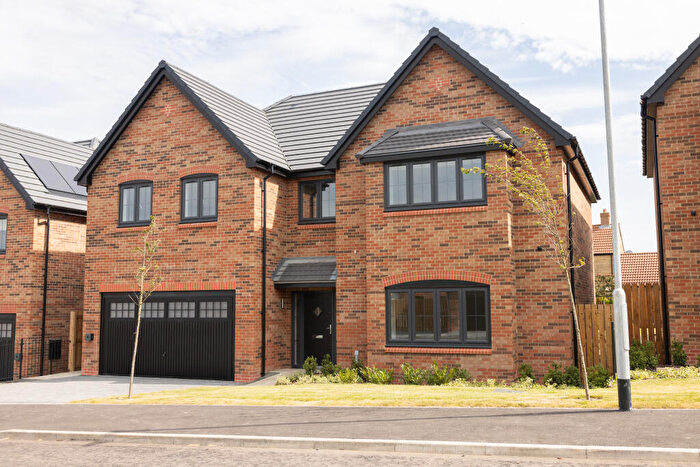
| Detached House | £565,080.00 | 110 Detached Houses |
| Terraced House | £251,473.00 | 36 Terraced Houses |