
Houses for sale in Morpeth, Northumberland
House Prices in Morpeth
Properties in Morpeth have an average house price of £277k and had 2,814 Property Transactions within the last 3 years.¹
Morpeth is an area in Northumberland with 25,144 households², where the most expensive property was sold for £2.7M.
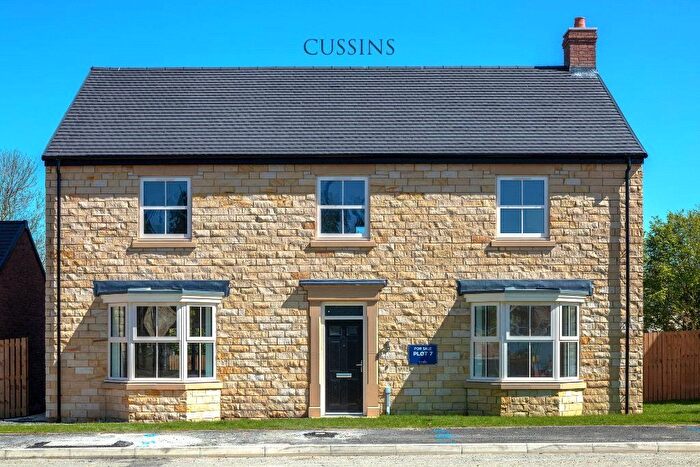
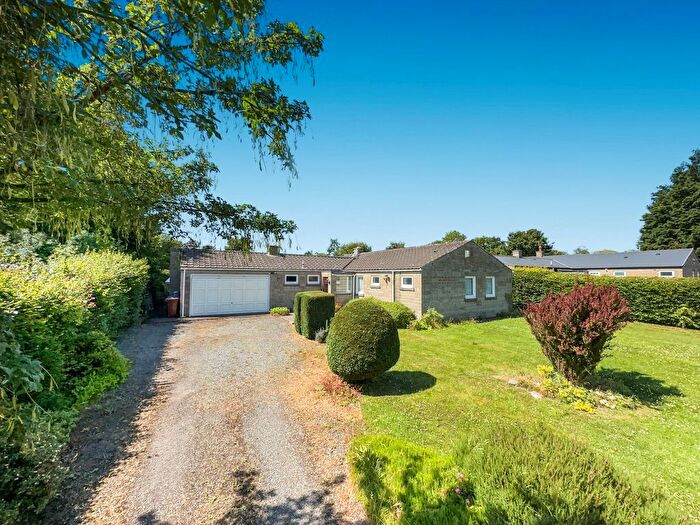
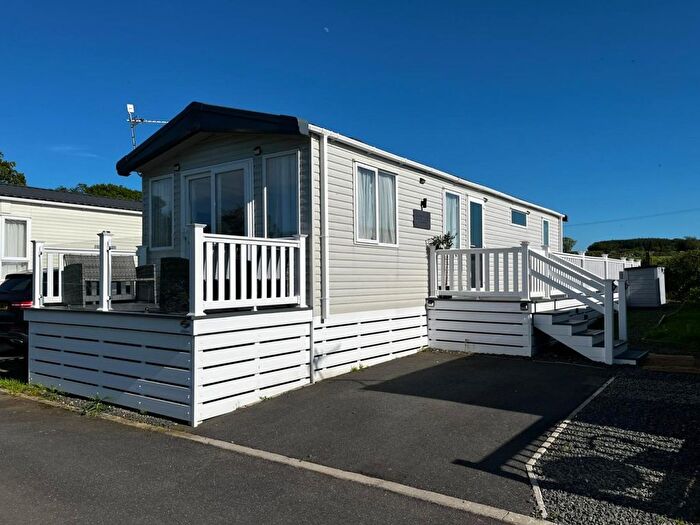
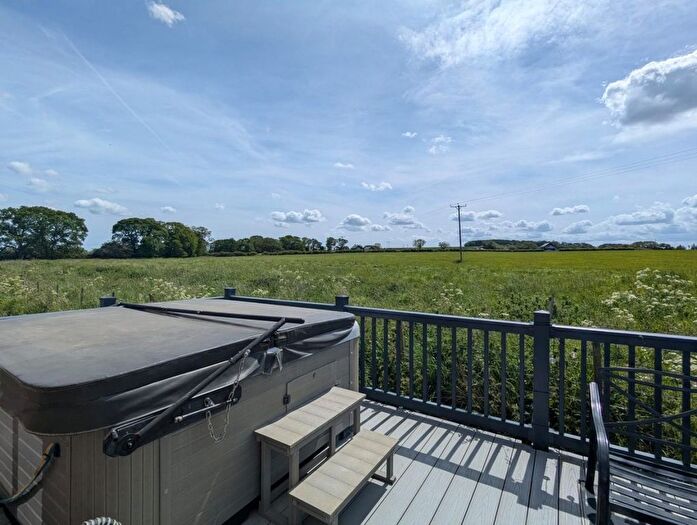
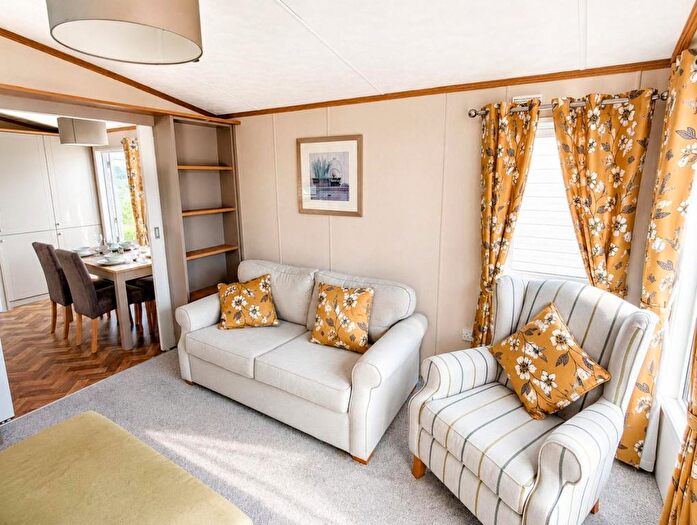
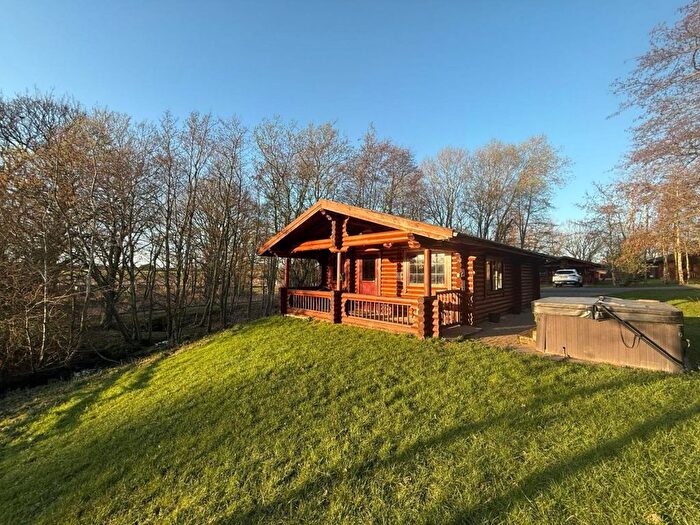
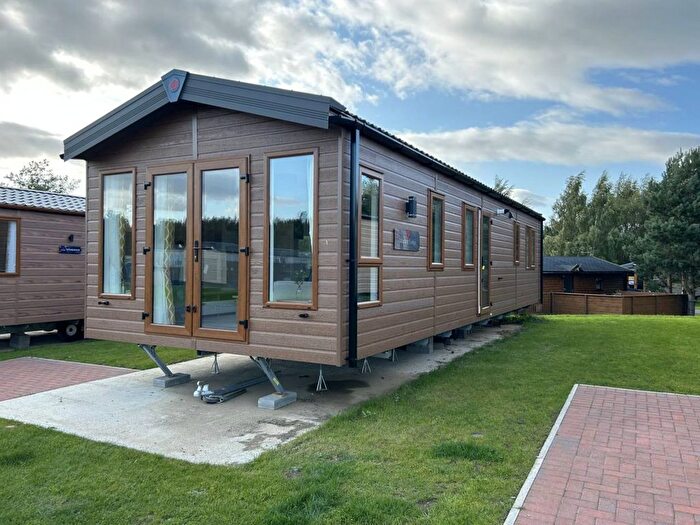
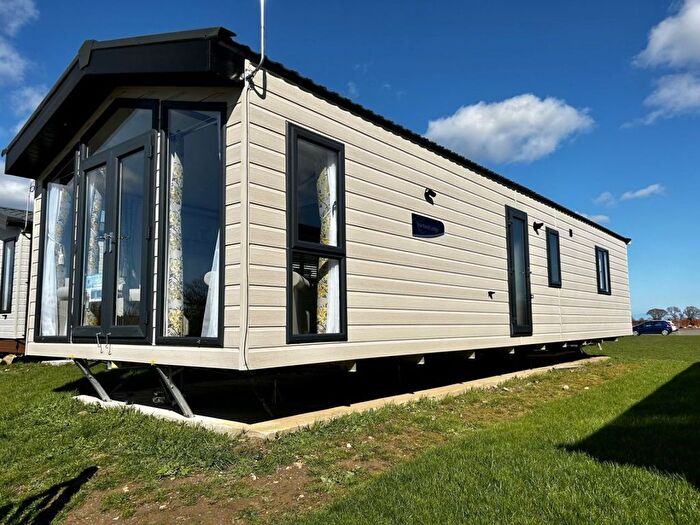
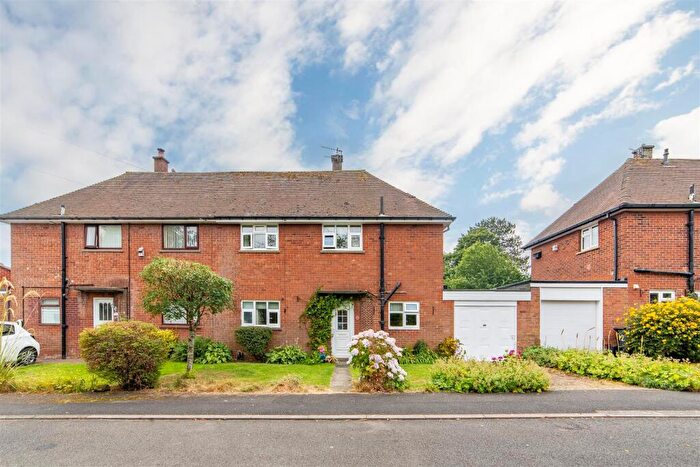
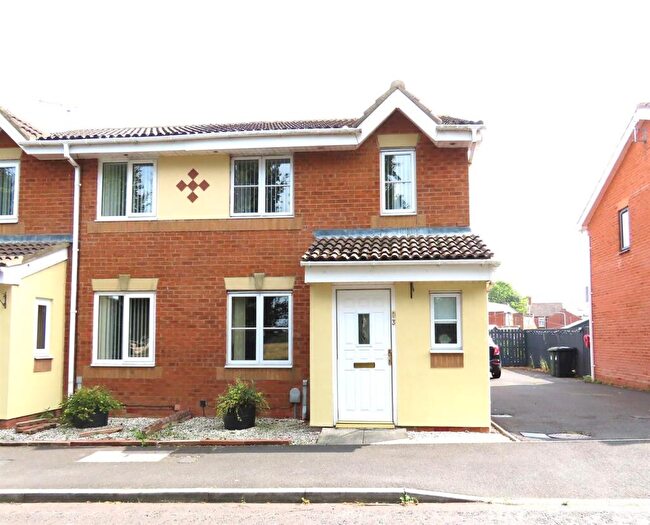
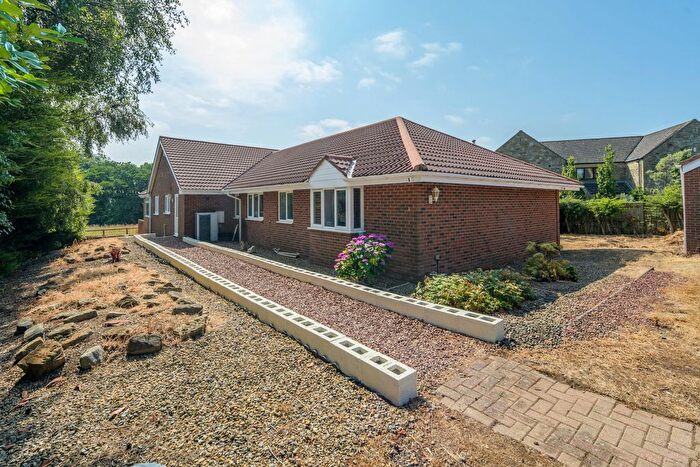
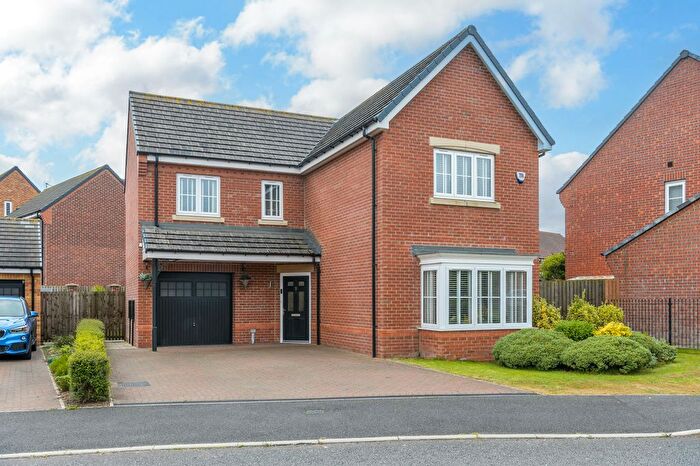
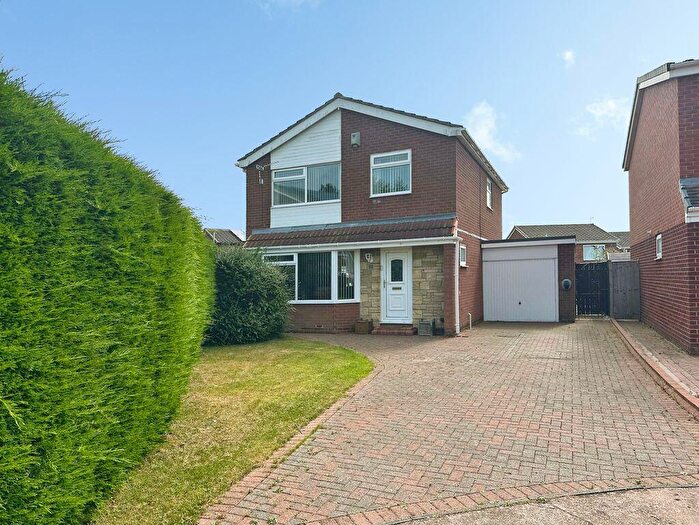
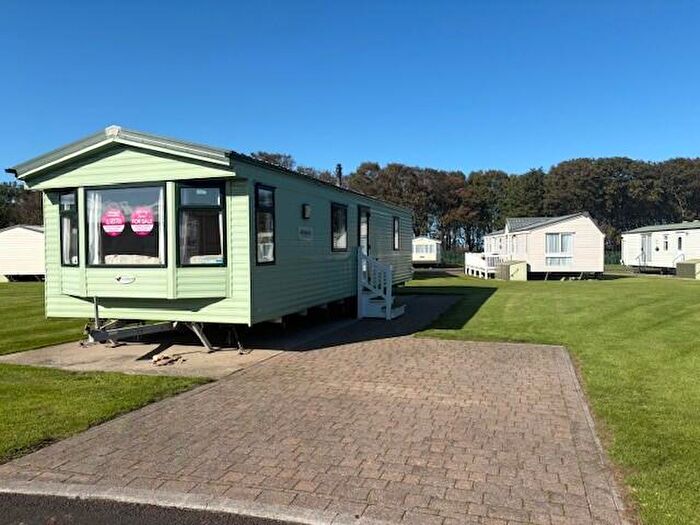
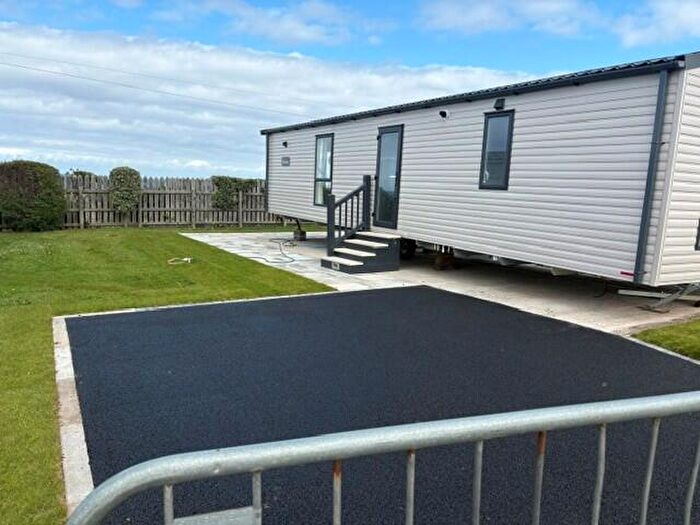
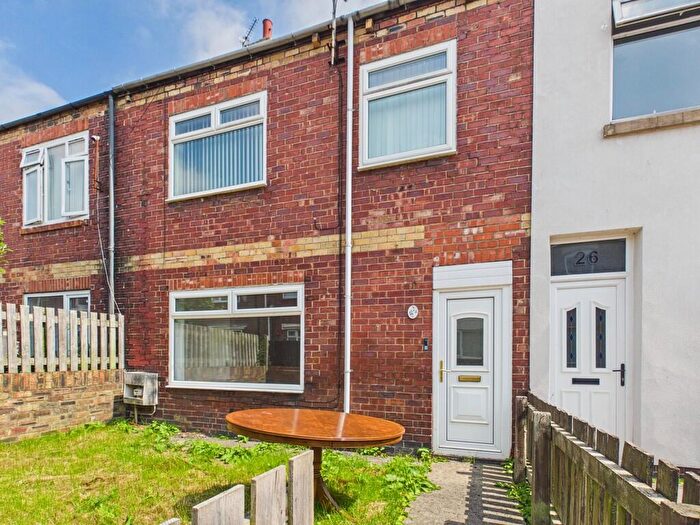
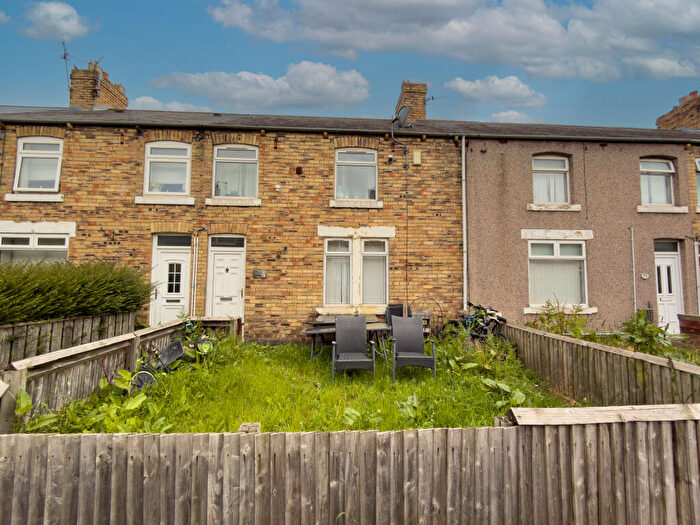
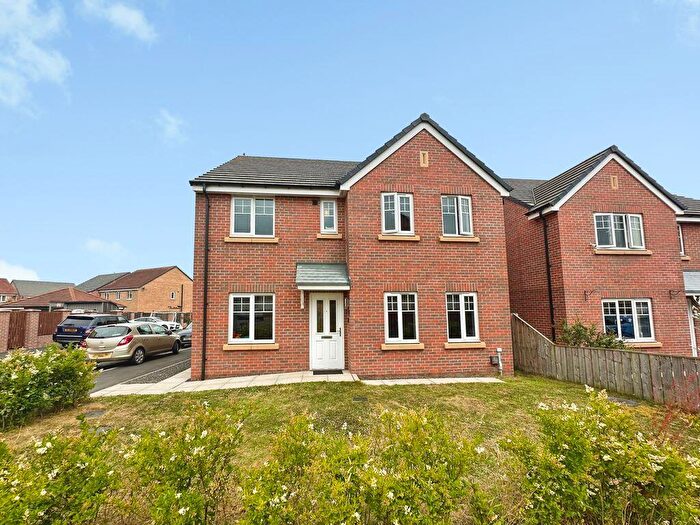
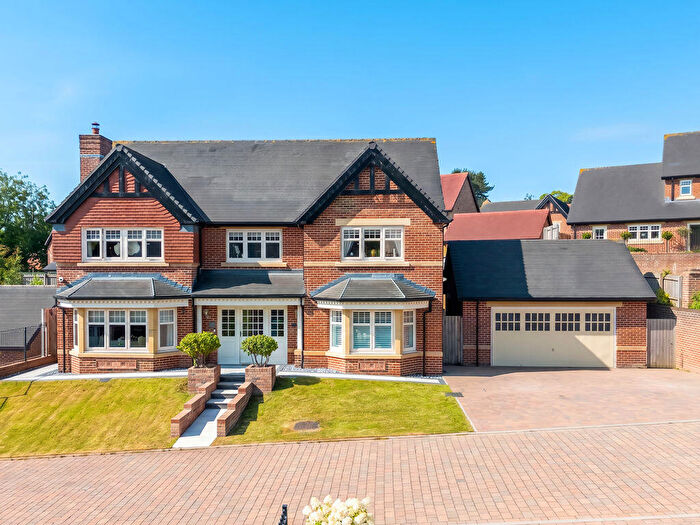
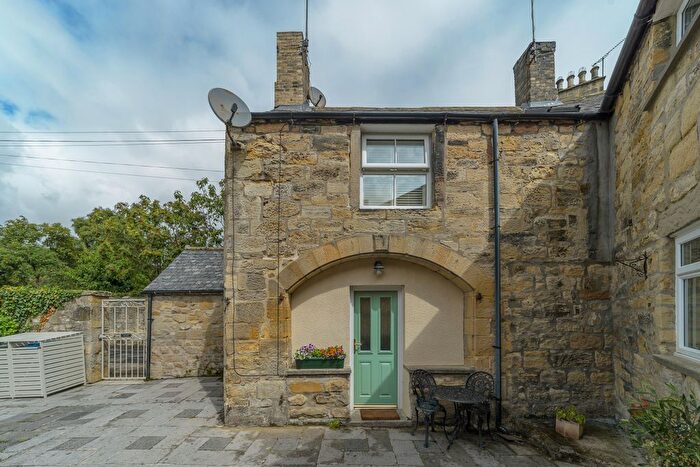
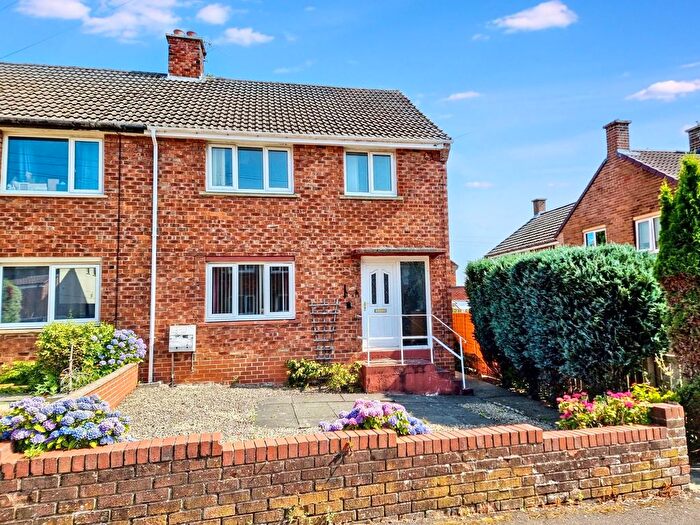
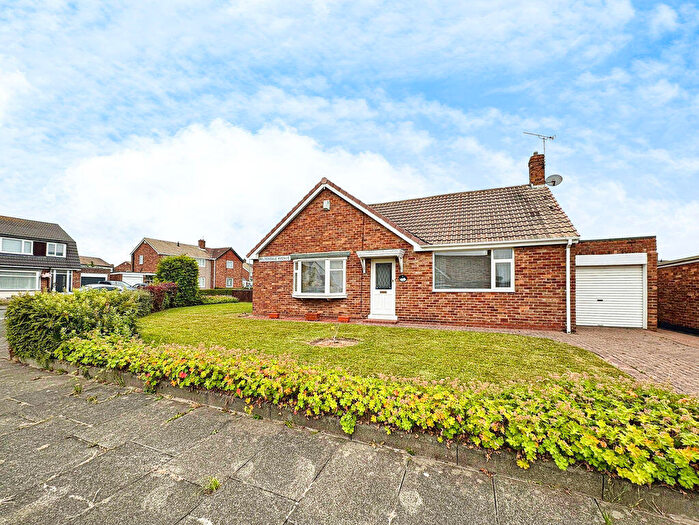
Properties for sale in Morpeth

![]()
If you are looking to sell your house, let it out, or receive a property valuation, an expert can help you.
Click the button below to get started.
Neighbourhoods in Morpeth
Navigate through our locations to find the location of your next house in Morpeth, Northumberland for sale or to rent.
Property price trends in Morpeth
According to the latest Land Registry data, the average home in Morpeth sold for £321,804 in 2026. That figure comes from a substantial record of 30,714 sales logged over the past 31 years.
Prices have continued to climb over the last three years. Compared with 2023, when the typical sale came in around £266,520, that's a rise of roughly 20.7%.
Looking back five years, average prices are up about 27.5% since 2021, a gain of around £69,373 in cash terms.
Zoom out to the past decade for the fuller picture. Back in 2016, homes here averaged £225,429, so the typical sold price has climbed about 42.8% since then, roughly 3.6% a year. Stretch the view to fifteen years and that annual pace edges up closer to 4.2%.
Frequently asked questions about Morpeth
What is the average price for a property for sale in Morpeth?
The average price for a property for sale in Morpeth is £276,738. This amount is 17% higher than the average price in Northumberland. There are more than 10,000 property listings for sale in Morpeth.
What locations have the most expensive properties for sale in Morpeth?
The locations with the most expensive properties for sale in Morpeth are Ponteland North at an average of £974,250, Longhorsley at an average of £429,448 and Ponteland East And Stannington at an average of £387,628.
What locations have the most affordable properties for sale in Morpeth?
The locations with the most affordable properties for sale in Morpeth are Lynemouth at an average of £152,605, Druridge Bay at an average of £189,870 and Amble at an average of £197,402.
Which train stations are available in or near Morpeth?
Some of the train stations available in or near Morpeth are Widdrington, Pegswood and Morpeth.
Property Price Paid in Morpeth by Year
The average sold property price by year was:
| Year | Average Sold Price | Price Change |
Sold Properties
|
|---|---|---|---|
| 2026 | £321,804 | 10% |
70 Properties |
| 2025 | £289,612 | 6% |
849 Properties |
| 2024 | £271,851 | 2% |
990 Properties |
| 2023 | £266,520 | -2% |
905 Properties |
| 2022 | £272,682 | 7% |
1,047 Properties |
| 2021 | £252,431 | 2% |
1,354 Properties |
| 2020 | £247,158 | 8% |
1,120 Properties |
| 2019 | £227,766 | 1% |
1,337 Properties |
| 2018 | £226,175 | 4% |
1,509 Properties |
| 2017 | £217,275 | -4% |
1,253 Properties |
Property Price per Property Type in Morpeth
Here you can find historic sold price data in order to help with your property search.
The average Property Paid Price for specific property types in the last three years are:
| Property Type | Average Sold Price | Sold Properties |
|---|---|---|
| Semi Detached House | £223,858.00 | 794 Semi Detached Houses |
| Terraced House | £188,394.00 | 829 Terraced Houses |
| Detached House | £416,331.00 | 990 Detached Houses |
| Flat | £162,440.00 | 201 Flats |
Transport in Morpeth
Please see below transportation links in this area:
