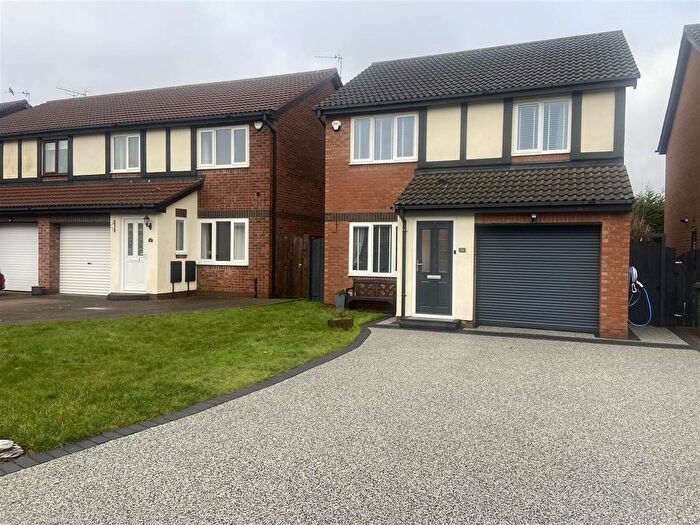
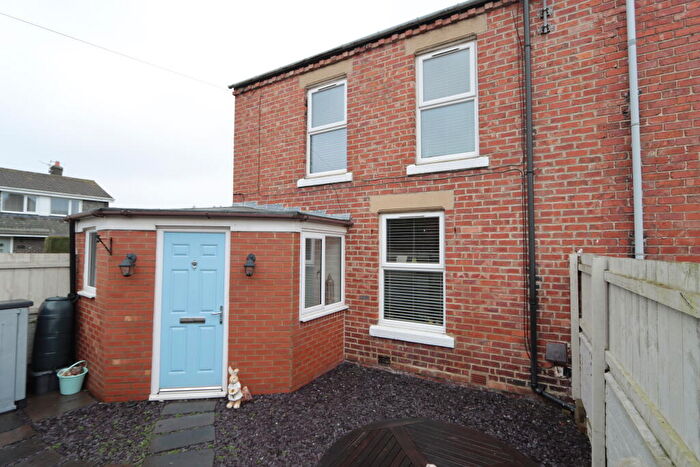
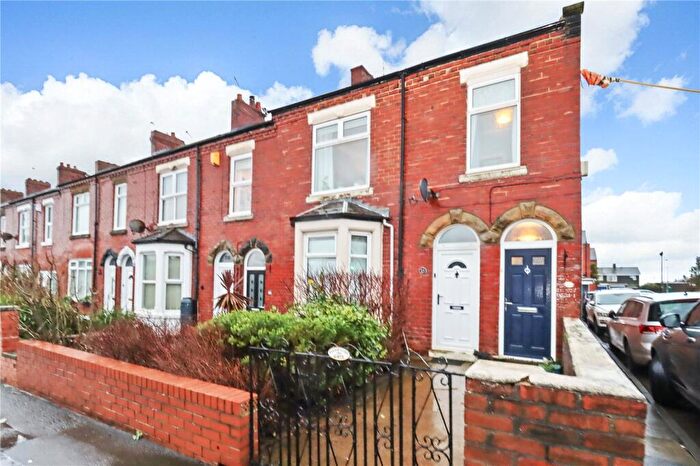
Houses for sale & to rent in Holywell, Whitley Bay
House Prices in Holywell
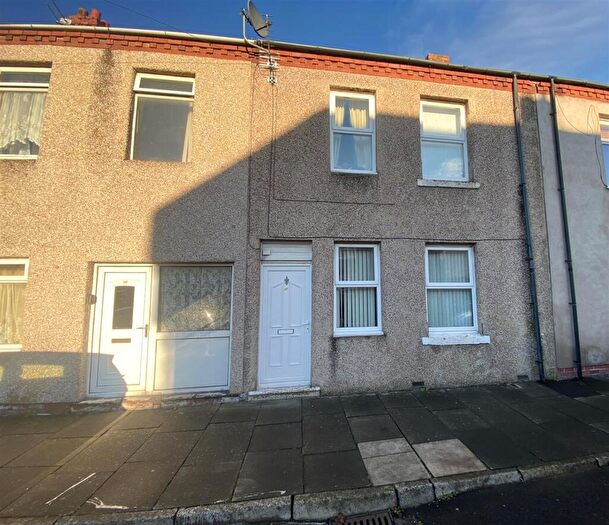
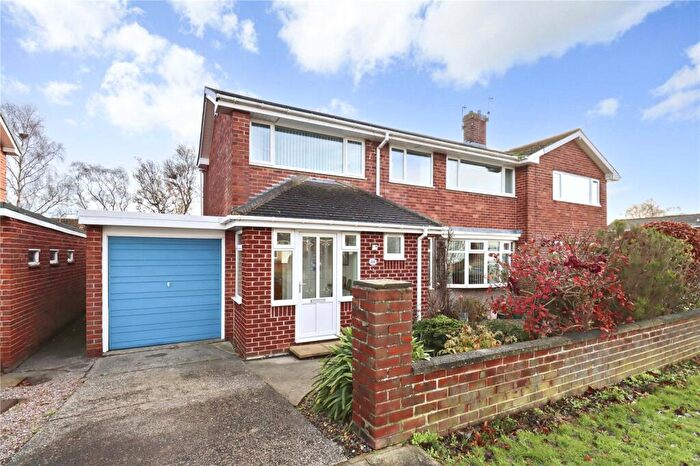
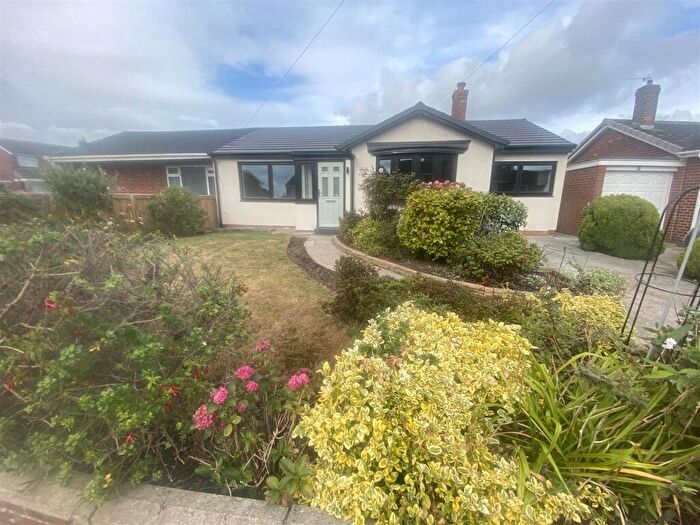
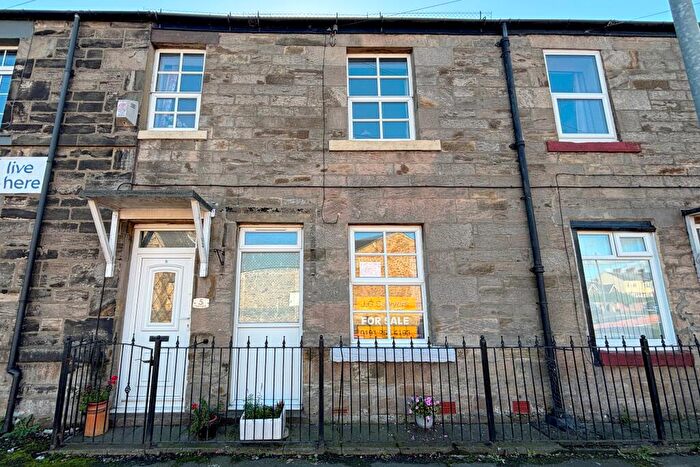
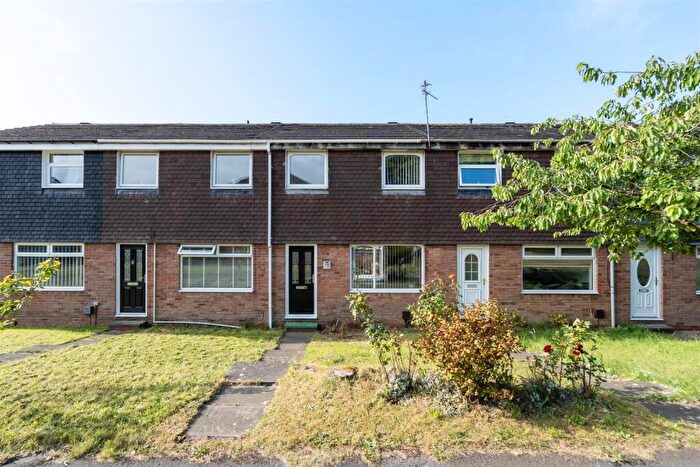
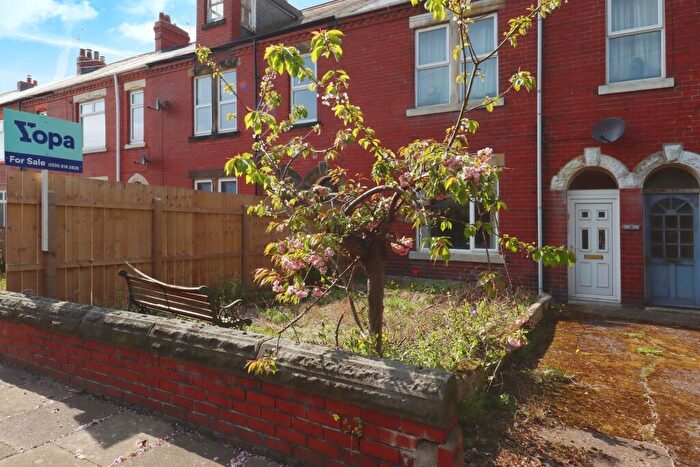
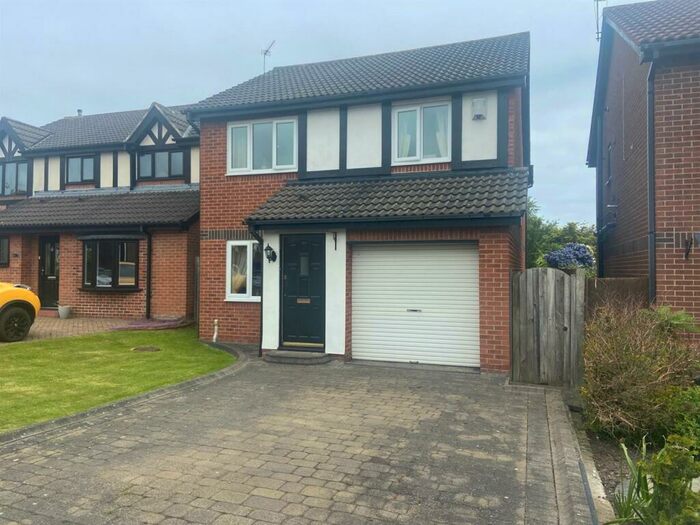
Properties in Holywell have an average house price of £171,144.00 and had 202 Property Transactions within the last 3 years¹.
Holywell is an area in Whitley Bay, Northumberland with 2,444 households², where the most expensive property was sold for £1,270,000.00.
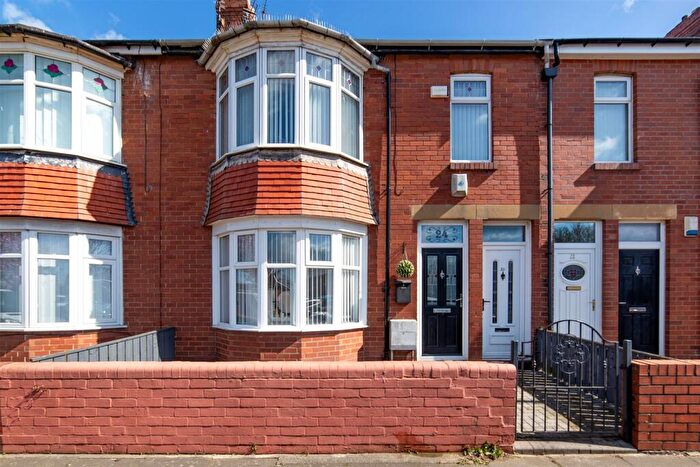
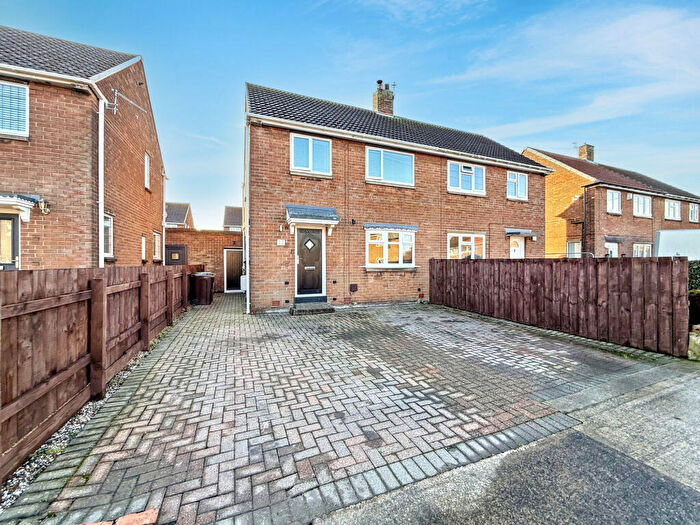
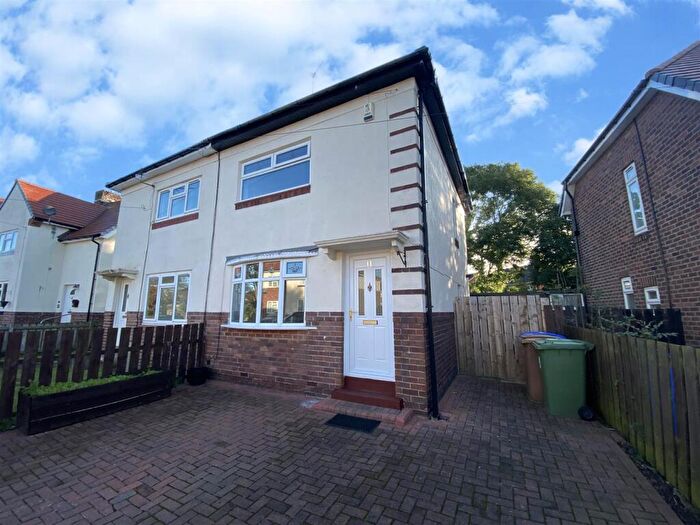
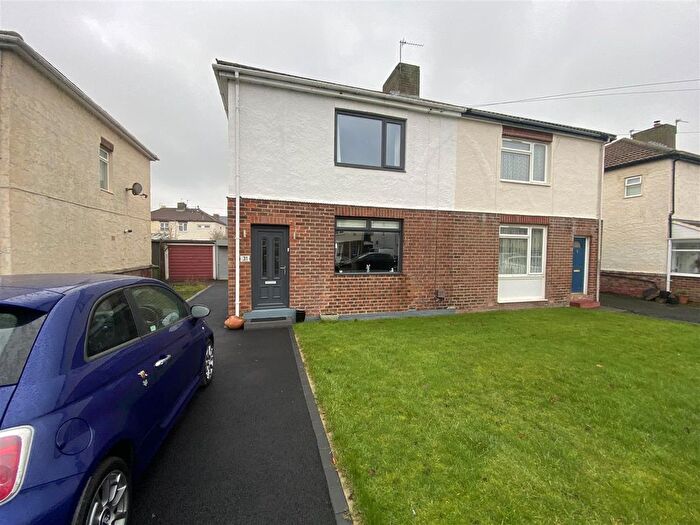
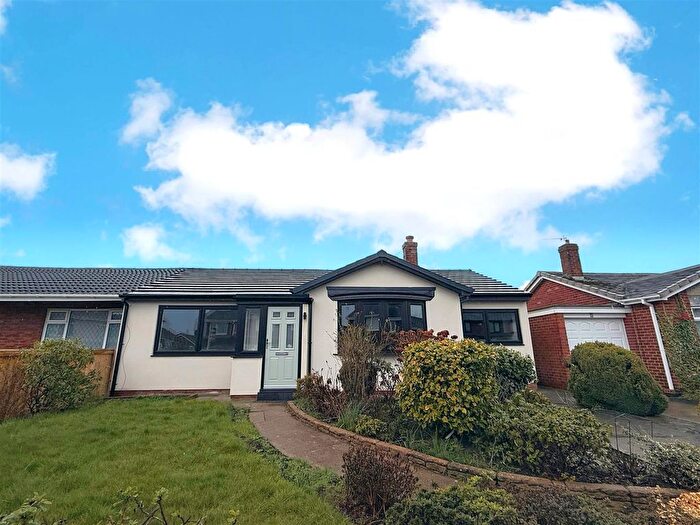
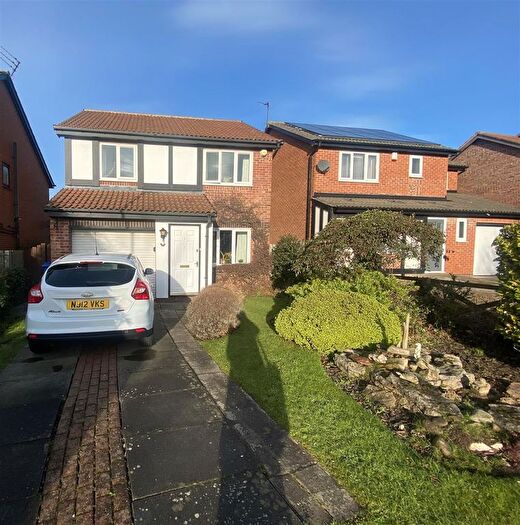
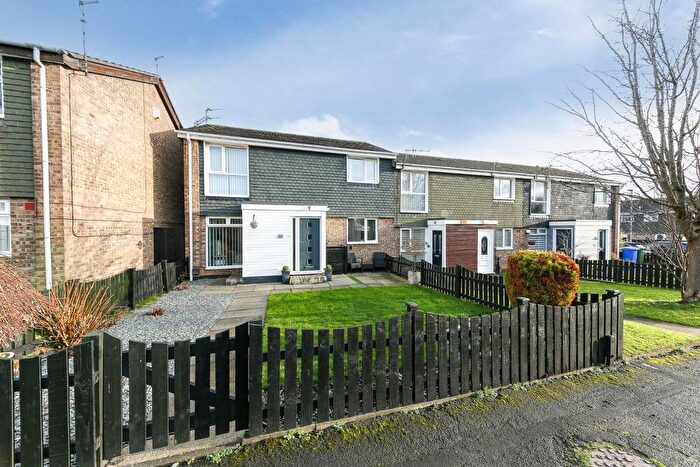
Properties for sale in Holywell
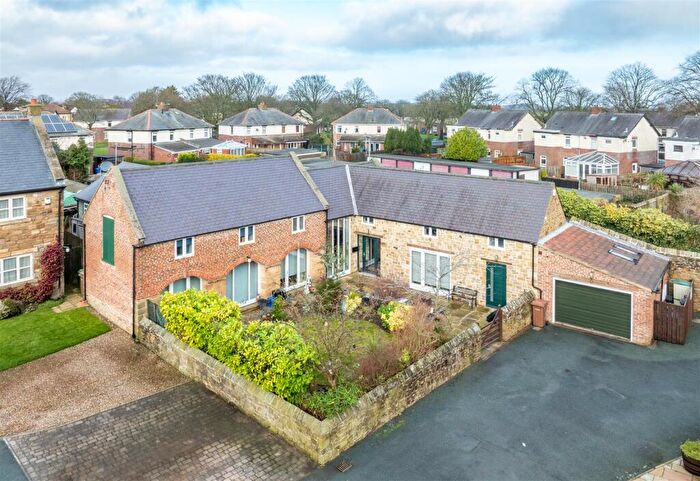
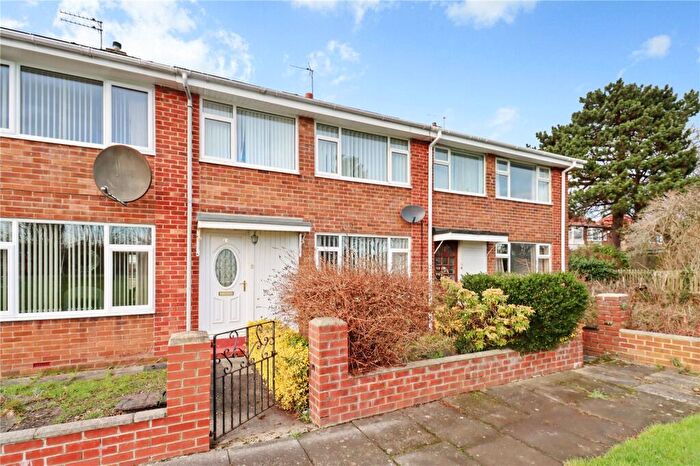
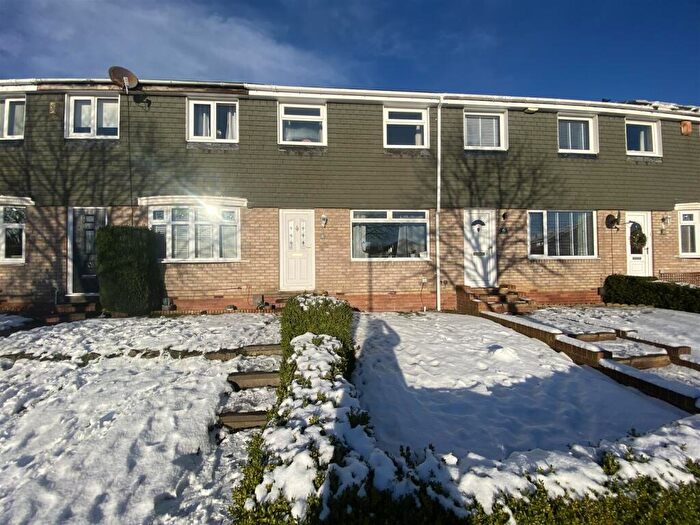
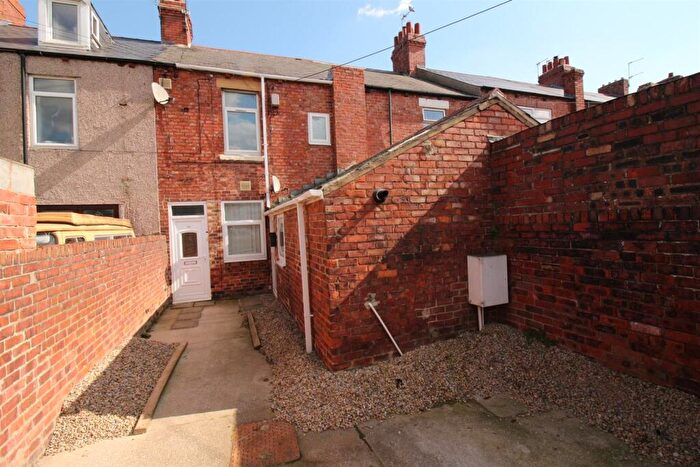
Previously listed properties in Holywell
Roads and Postcodes in Holywell
Navigate through our locations to find the location of your next house in Holywell, Whitley Bay for sale or to rent.
| Streets | Postcodes |
|---|---|
| Acomb Avenue | NE25 0HG NE25 0JF |
| Aged Miners Cottages | NE25 0LR |
| Aged Miners Homes | NE25 0BA |
| Allerdean Close | NE25 0HS |
| Alucia Court | NE25 0DD |
| Ambleside Close | NE25 0JD |
| Ashkirk Way | NE25 0JT NE25 0JU |
| Astley Gardens | NE25 0AE |
| Avenue Road | NE25 0DT NE25 0DS NE25 0QJ |
| Avenue Terrace | NE25 0AW |
| Bardon Crescent | NE25 0TS |
| Bavington Road | NE25 0JJ |
| Baxter Place | NE25 0AP |
| Baxters Buildings | NE25 0AX |
| Blanchland Drive | NE25 0TY |
| Brentwood Close | NE25 0PD |
| Burnside | NE25 0LP |
| Chatham Close | NE25 0PB |
| Cheswick Road | NE25 0HX |
| Chollerford Mews | NE25 0TX |
| Cooperative Buildings | NE25 0AS |
| Daletop | NE25 0LU NE25 0NU |
| Dartford Close | NE25 0BY |
| Dene Street | NE25 0LT |
| Dene View | NE25 0LS |
| Denham Drive | NE25 0JX NE25 0JY NE25 0JZ NE25 0LA |
| Dunsdale Road | NE25 0NG |
| Earsdon Road | NE25 0QS |
| East Grange | NE25 0LQ |
| Elsdon Avenue | NE25 0BN NE25 0BW NE25 0HJ NE25 0HY NE25 0JL NE25 0JN NE25 0BP NE25 0HH |
| Farm Cottages | NE25 0LH |
| Fontburn Road | NE25 0BH |
| Greenlands Court | NE25 0BU |
| Hallington Drive | NE25 0JA NE25 0JB |
| Hartburn Terrace | NE25 0AY |
| Hartley Gardens | NE25 0AB |
| Hartley Street | NE25 0AA |
| Hayward Avenue | NE25 0AF |
| Hedley Road | NE25 0NW |
| Henshaw Grove | NE25 0TT |
| Hollinghill Road | NE25 0NH |
| Holywell Avenue | NE25 0LE |
| Holywell Close | NE25 0LD |
| Holywell Dene Road | NE25 0LB |
| Horsley Gardens | NE25 0TU |
| Kearsley Close | NE25 0BL |
| Kyloe Avenue | NE25 0HR |
| Laurel Terrace | NE25 0ND |
| Martindale Place | NE25 0BT |
| Medburn Road | NE25 0NE |
| Melrose Avenue | NE25 0JR |
| Mindrum Way | NE25 0HZ |
| Mortimer Terrace | NE25 0NB |
| Newburgh Avenue | NE25 0JP NE25 0JW |
| Northside Place | NE25 0NQ |
| Nursery Gardens | NE25 0BF |
| Park Road | NE25 0AD |
| Park View | NE25 0AL NE25 0AN |
| Paston Road | NE25 0HP |
| Percy Cottages | NE25 0BQ |
| Queens Court | NE25 0BR |
| Ridgeway | NE25 0PH |
| Ridsdale Close | NE25 0BS |
| Ryal Close | NE25 0BD NE25 0JE |
| Sandown Close | NE25 0NX |
| Seaton Crescent | NE25 0LF |
| Seaton Terrace | NE25 0AT |
| Seghill | NE23 7DY |
| Sinclair Gardens | NE25 0AJ |
| Southward Way | NE25 0NJ NE25 0PE |
| Stamford Avenue | NE25 0PA |
| Staward Avenue | NE25 0JG |
| Swarland Road | NE25 0HL |
| Swinburn Road | NE25 0JQ |
| The Paddock | NE25 0BZ |
| Thornhill Close | NE25 0JS |
| Tillmouth Avenue | NE25 0HT NE25 0NF NE25 0NP NE25 0NR NE25 0NS NE25 0NT |
| Tranwell Drive | NE25 0HU |
| Valley Road | NE25 0LG NE25 0LN |
| Vanburgh Court | NE25 0PG |
| Victoria Court | NE25 0QA |
| Wallace Terrace | NE25 0BB |
| Wallington Court | NE25 0DA |
| Wallridge Drive | NE25 0NL NE25 0NN |
| Westbourne Terrace | NE25 0BE |
| Whitfield Road | NE25 0JH |
| Whitley Place | NE25 0NA |
| Whitley Terrace | NE25 0LZ |
| Whitton Place | NE25 0BJ |
| Woodhall Court | NE25 0BX |
| Woodside Avenue | NE25 0HN NE25 0HW |
| Wylam Avenue | NE25 0TR |
| NE25 0LJ NE25 0LL NE25 9TQ NE25 0AG NE25 0AQ NE25 0AR NE25 0LW NE27 0JL |
Transport near Holywell
-
Cramlington Station
-
Manors Station
-
Newcastle Station
-
Heworth Station
-
Pegswood Station
-
Morpeth Station
-
Dunston Station
-
MetroCentre Station
- FAQ
- Price Paid By Year
- Property Type Price
Frequently asked questions about Holywell
What is the average price for a property for sale in Holywell?
The average price for a property for sale in Holywell is £171,144. This amount is 15% lower than the average price in Whitley Bay. There are 499 property listings for sale in Holywell.
What streets have the most expensive properties for sale in Holywell?
The streets with the most expensive properties for sale in Holywell are Blanchland Drive at an average of £402,666, Chollerford Mews at an average of £398,900 and Vanburgh Court at an average of £370,000.
What streets have the most affordable properties for sale in Holywell?
The streets with the most affordable properties for sale in Holywell are Kearsley Close at an average of £26,955, Ridsdale Close at an average of £68,333 and Avenue Road at an average of £100,250.
Which train stations are available in or near Holywell?
Some of the train stations available in or near Holywell are Cramlington, Manors and Newcastle.
Property Price Paid in Holywell by Year
The average sold property price by year was:
| Year | Average Sold Price | Price Change |
Sold Properties
|
|---|---|---|---|
| 2025 | £167,142 | 2% |
60 Properties |
| 2024 | £164,321 | -10% |
66 Properties |
| 2023 | £180,228 | 20% |
76 Properties |
| 2022 | £144,807 | -5% |
98 Properties |
| 2021 | £152,276 | -17% |
103 Properties |
| 2020 | £178,795 | 8% |
71 Properties |
| 2019 | £164,566 | 15% |
68 Properties |
| 2018 | £140,030 | 1% |
63 Properties |
| 2017 | £139,286 | 6% |
89 Properties |
| 2016 | £130,913 | -3% |
95 Properties |
| 2015 | £134,357 | 7% |
95 Properties |
| 2014 | £125,466 | -2% |
100 Properties |
| 2013 | £127,744 | -13% |
58 Properties |
| 2012 | £143,773 | 28% |
57 Properties |
| 2011 | £103,486 | -27% |
49 Properties |
| 2010 | £131,926 | 14% |
58 Properties |
| 2009 | £113,280 | -7% |
56 Properties |
| 2008 | £121,635 | 2% |
47 Properties |
| 2007 | £119,730 | -6% |
117 Properties |
| 2006 | £126,953 | 23% |
137 Properties |
| 2005 | £97,931 | 6% |
94 Properties |
| 2004 | £91,640 | 21% |
117 Properties |
| 2003 | £72,458 | 16% |
136 Properties |
| 2002 | £60,794 | 9% |
139 Properties |
| 2001 | £55,314 | 6% |
110 Properties |
| 2000 | £51,732 | -0,1% |
125 Properties |
| 1999 | £51,777 | 6% |
107 Properties |
| 1998 | £48,599 | 4% |
113 Properties |
| 1997 | £46,474 | -2% |
99 Properties |
| 1996 | £47,490 | 3% |
84 Properties |
| 1995 | £45,883 | - |
100 Properties |
Property Price per Property Type in Holywell
Here you can find historic sold price data in order to help with your property search.
The average Property Paid Price for specific property types in the last three years are:
| Property Type | Average Sold Price | Sold Properties |
|---|---|---|
| Semi Detached House | £196,661.00 | 77 Semi Detached Houses |
| Detached House | £351,987.00 | 26 Detached Houses |
| Terraced House | £144,415.00 | 51 Terraced Houses |
| Flat | £60,653.00 | 48 Flats |

