
Houses for sale in Blyth, Doncaster
House Prices in Blyth
Properties in Blyth have an average house price of £186k and had 108 Property Transactions within the last 3 years¹.
Blyth is an area in Doncaster, Nottinghamshire with 345 households², where the most expensive property was sold for £560k.
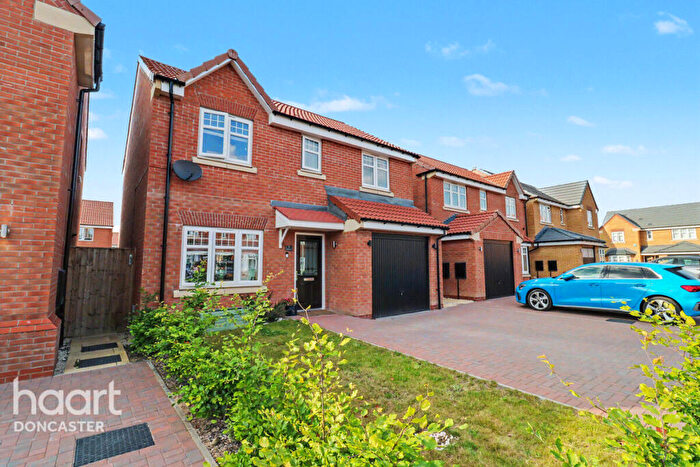
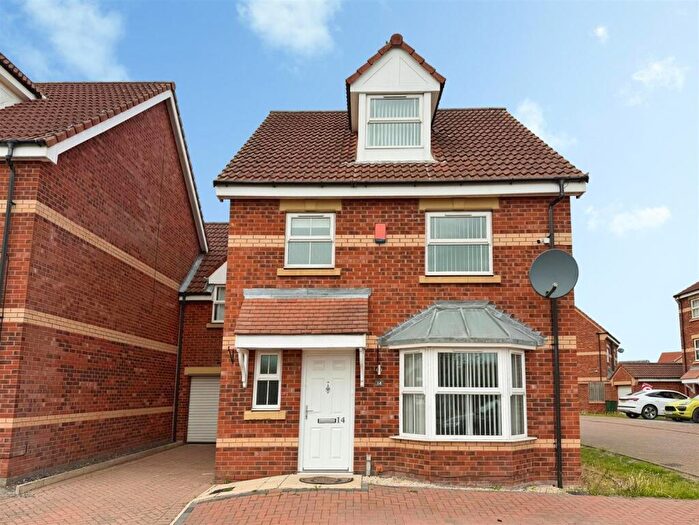
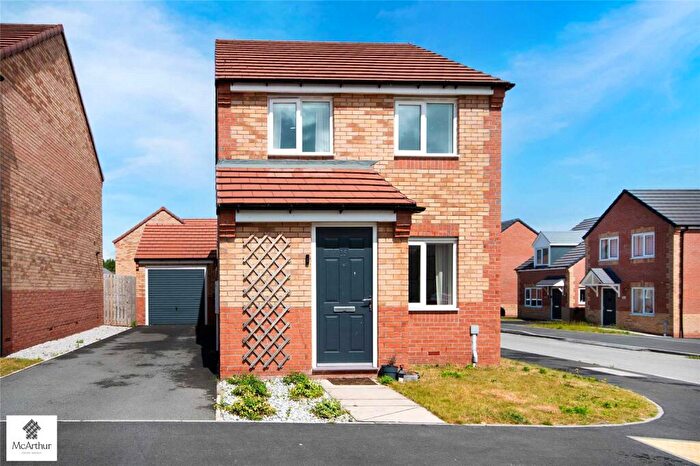
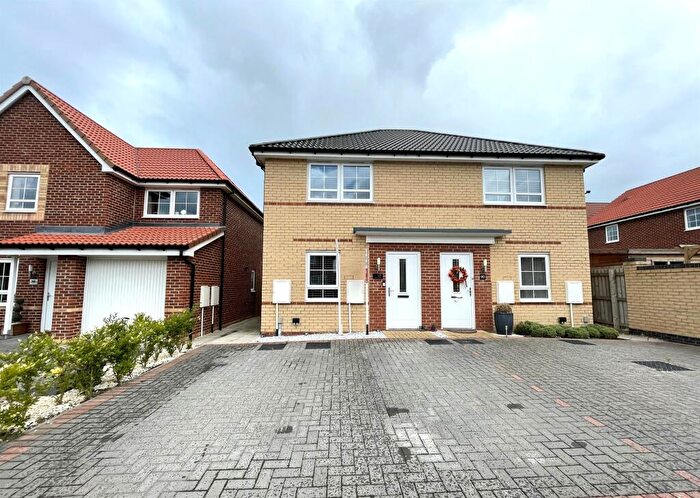
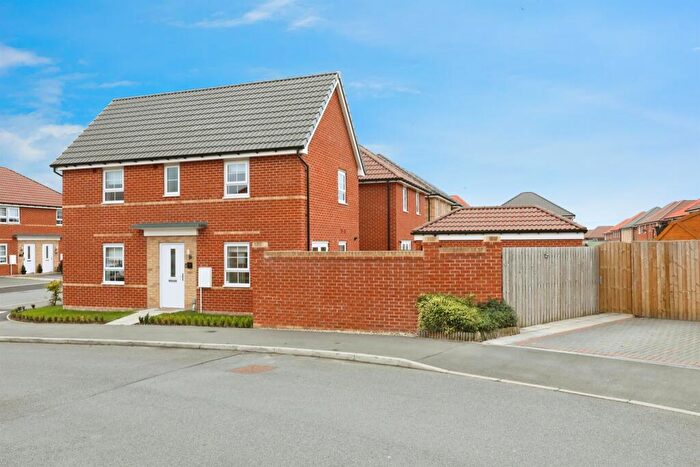
Properties for sale in Blyth
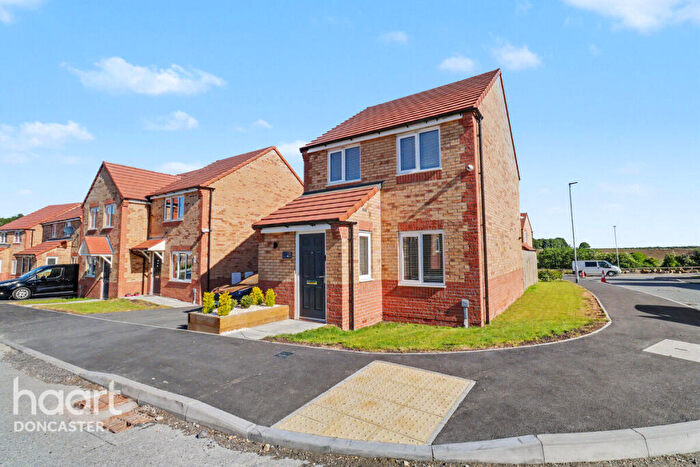
![]()
If you are looking to sell your house, let it out, or receive a property valuation, an expert can help you.
Click the button below to get started.
Roads and Postcodes in Blyth
Navigate through our locations to find the location of your next house in Blyth, Doncaster for sale or to rent.
| Streets | Postcodes |
|---|---|
| Blyth Road | DN11 8NE DN10 6BB DN10 6BD DN11 8FS DN11 8LA |
| Brickyard Way | DN11 8FG |
| British Coal Enterprise Park | DN11 8SG |
| Brunel Close | DN11 8QA |
| Brunel Gate | DN11 8QB |
| Brunel Park Industrial Estate | DN11 8RW |
| Bryans Close | DN11 8RY |
| Chapel Lane | DN10 6AE |
| Church Lane | DN10 6AR |
| Church View | DN10 6AW |
| Dog Lane | DN10 6AF |
| Great North Road | DN10 6AT DN10 6AU DN10 6BW |
| Harworth Park Blyth Road | DN11 8DB |
| Holmefield Croft | DN10 6BS |
| Lords Wood Road | DN11 8BZ |
| Low Road | DN10 6AG DN10 6AJ DN10 6AP |
| Main Street | DN11 8NA DN11 8NB |
| Manor Road | DN10 6AH |
| Mayflower Avenue | DN10 6AN |
| Mill Lane | DN10 6AQ |
| Oaklands Drive | DN11 8NQ |
| Pagdin Drive | DN11 8LU DN11 8LX |
| Pinfold Lane | DN11 8LZ DN11 8NG |
| Saracens Lane | DN10 6AS |
| Scrooby Top Cottages | DN10 6AY |
| Serlby Road | DN11 8LT |
| Station Road | DN10 6AL |
| Styrrup Court | DN11 8NH |
| Swan Court | DN11 8BF |
| Vicarage Lane | DN10 6AD |
| Yews Farm Court | DN11 8EP |
| DN10 6AX DN10 6AZ DN10 6BA |
Property price trends in Blyth
According to the latest Land Registry data, the average home in Blyth sold for £206,620 in 2025. That figure comes from 364 sales logged over the past 30 years.
Prices have fallen back over the last three years. Compared with 2022, when the typical sale came in around £373,000, that's a fall of roughly 44.6%.
Looking back five years, average prices are down about 22.1% since 2020, a drop of around £58,660 in cash terms.
Zoom out to the past decade for the fuller picture. Back in 2015, homes here averaged £205,000, so the typical sold price has climbed about 0.8% since then, roughly 0.1% a year. Stretch the view to fifteen years and that annual pace eases back to about -0.1%.
Frequently asked questions about Blyth
What is the average price for a property for sale in Blyth?
The average price for a property for sale in Blyth is £186,371. This amount is 16% lower than the average price in Doncaster. There are 1,320 property listings for sale in Blyth.
What streets have the most expensive properties for sale in Blyth?
The streets with the most expensive properties for sale in Blyth are Saracens Lane at an average of £560,000, Main Street at an average of £368,666 and Low Road at an average of £326,666.
What streets have the most affordable properties for sale in Blyth?
The streets with the most affordable properties for sale in Blyth are Blyth Road at an average of £161,557, Pagdin Drive at an average of £174,000 and Mayflower Avenue at an average of £190,000.
Which train stations are available in or near Blyth?
Some of the train stations available in or near Blyth are Worksop, Shireoaks and Retford.
Property Price Paid in Blyth by Year
The average sold property price by year was:
| Year | Average Sold Price | Price Change |
Sold Properties
|
|---|---|---|---|
| 2025 | £206,620 | 18% |
13 Properties |
| 2024 | £170,253 | -47% |
79 Properties |
| 2023 | £249,500 | -49% |
16 Properties |
| 2022 | £373,000 | 36% |
3 Properties |
| 2021 | £239,750 | -11% |
11 Properties |
| 2020 | £265,280 | 53% |
13 Properties |
| 2019 | £123,676 | -56% |
17 Properties |
| 2018 | £193,538 | -56% |
13 Properties |
| 2017 | £302,750 | 47% |
4 Properties |
| 2016 | £160,142 | -28% |
7 Properties |
Property Price per Property Type in Blyth
Here you can find historic sold price data in order to help with your property search.
The average Property Paid Price for specific property types in the last three years are:
| Property Type | Average Sold Price | Sold Properties |
|---|---|---|
| Semi Detached House | £211,333.00 | 6 Semi Detached Houses |
| Detached House | £343,000.00 | 12 Detached Houses |
| Terraced House | £263,500.00 | 2 Terraced Houses |
| Flat | £161,557.00 | 88 Flats |
