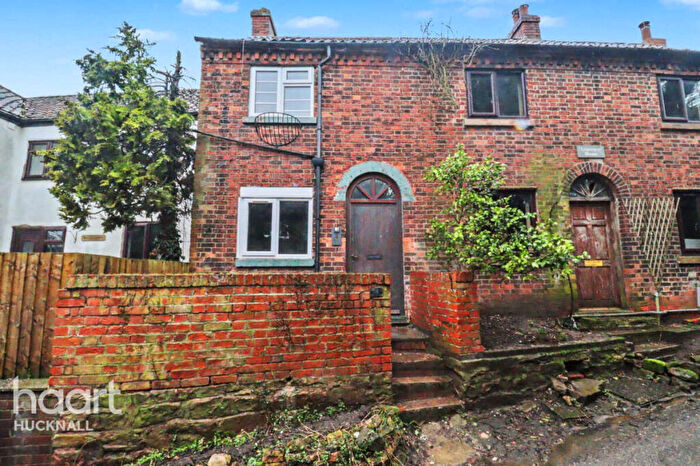
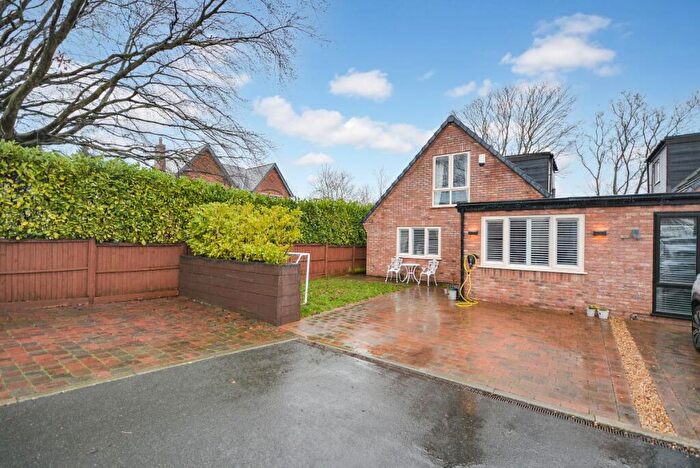
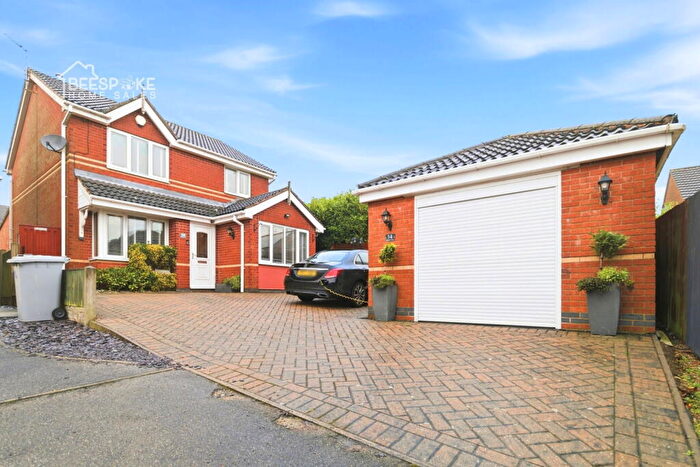
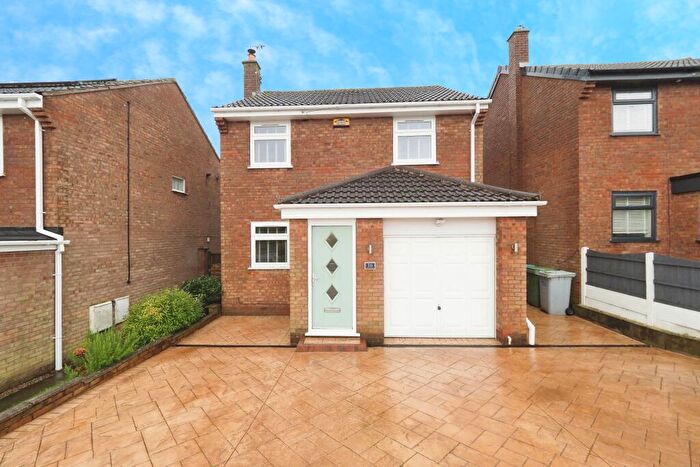
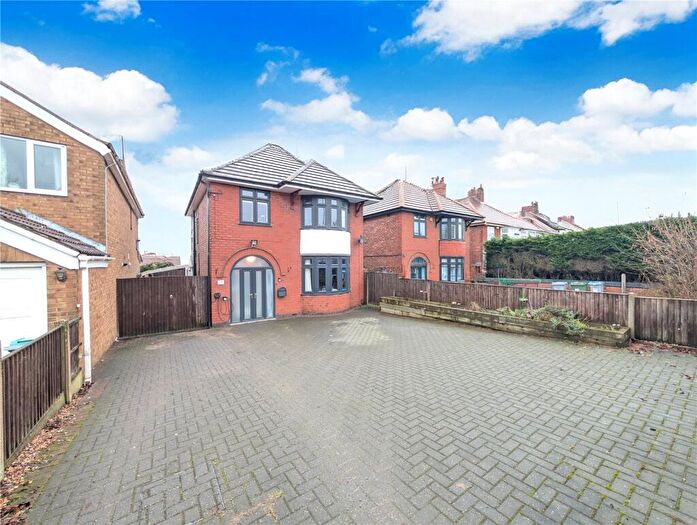
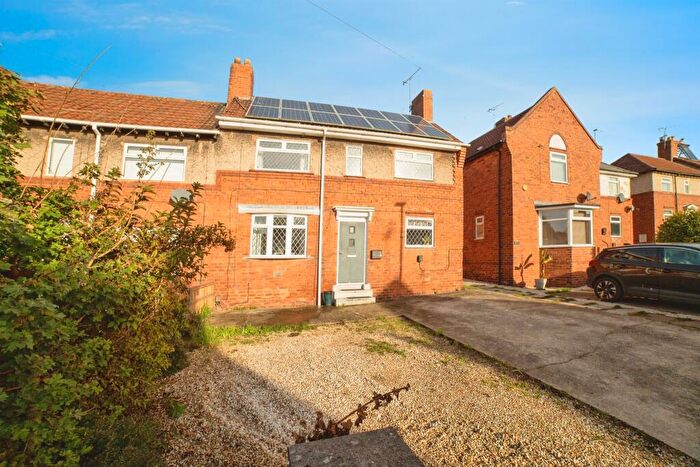
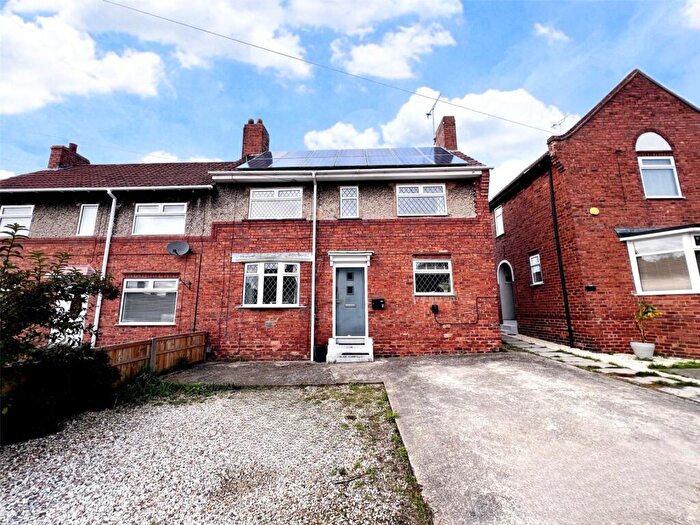
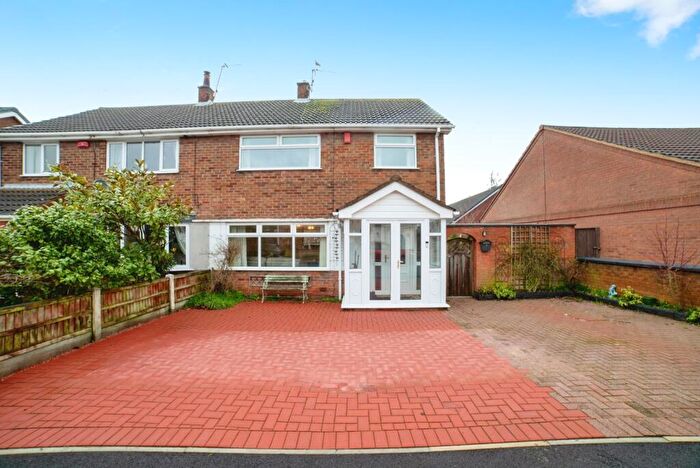
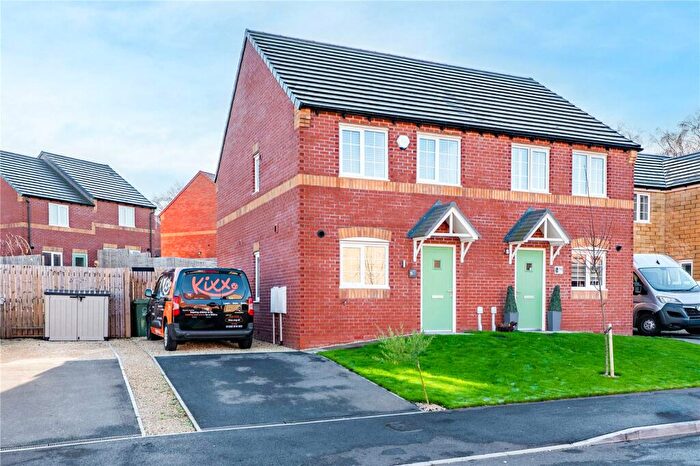
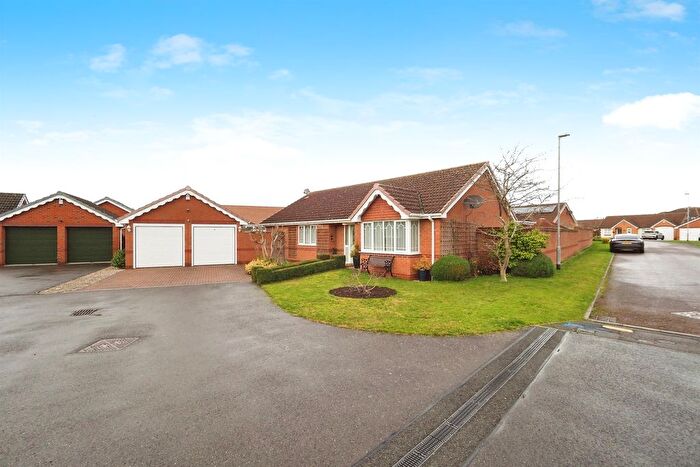
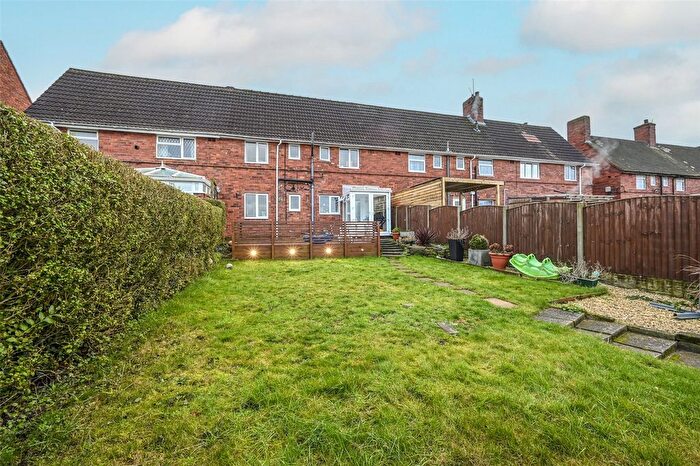
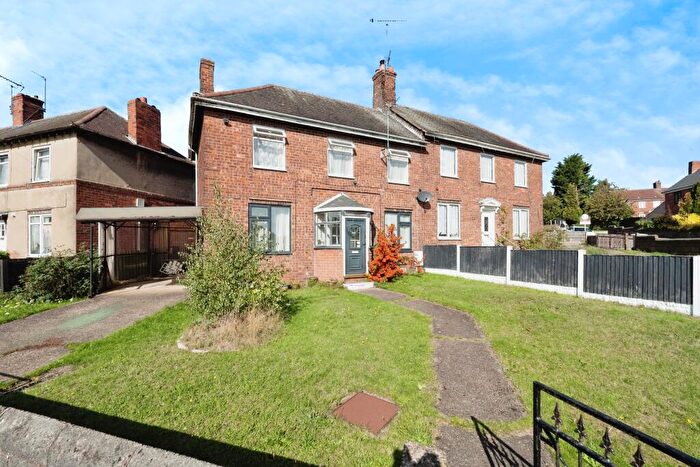
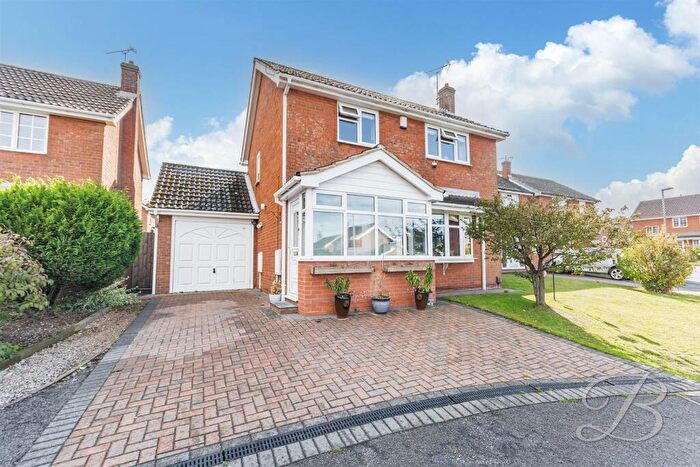
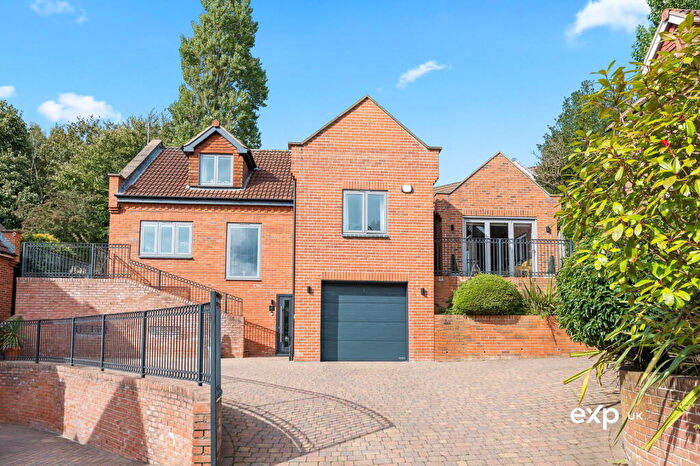
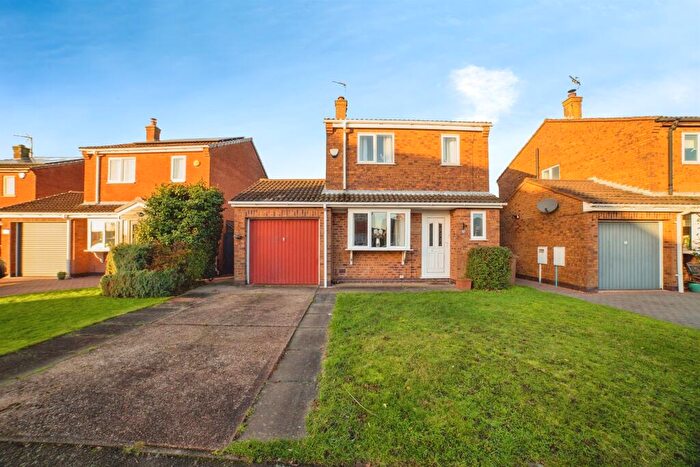
Houses for sale & to rent in Blidworth, Mansfield
House Prices in Blidworth
Properties in Blidworth have an average house price of £180,242.00 and had 167 Property Transactions within the last 3 years¹.
Blidworth is an area in Mansfield, Nottinghamshire with 1,767 households², where the most expensive property was sold for £950,000.00.
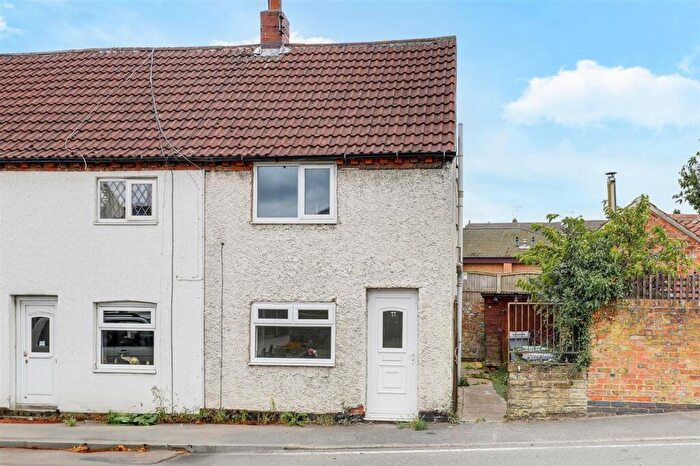
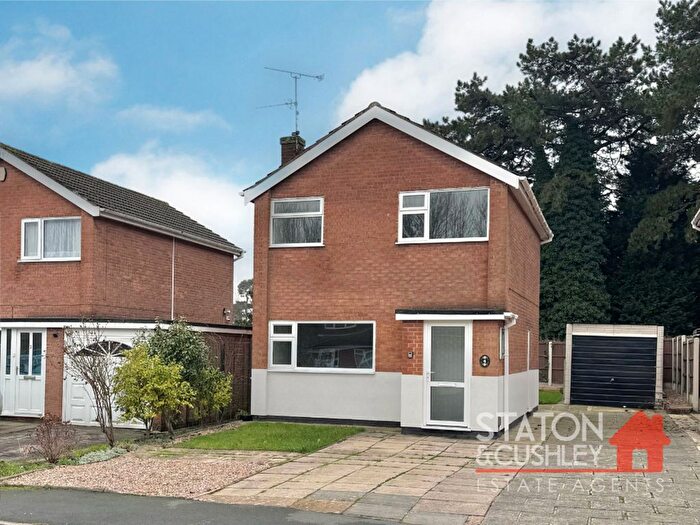
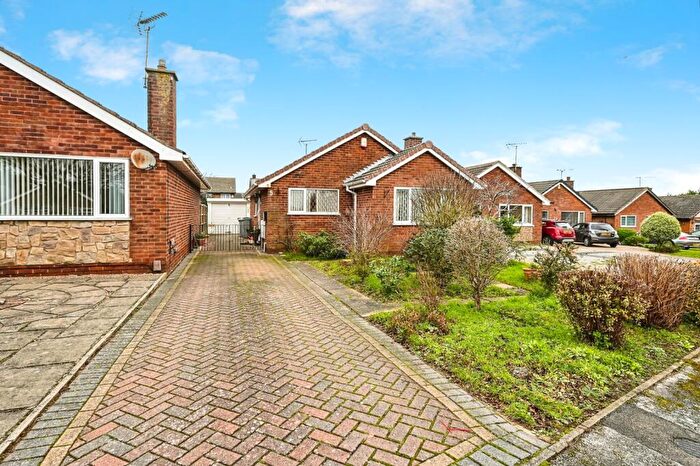
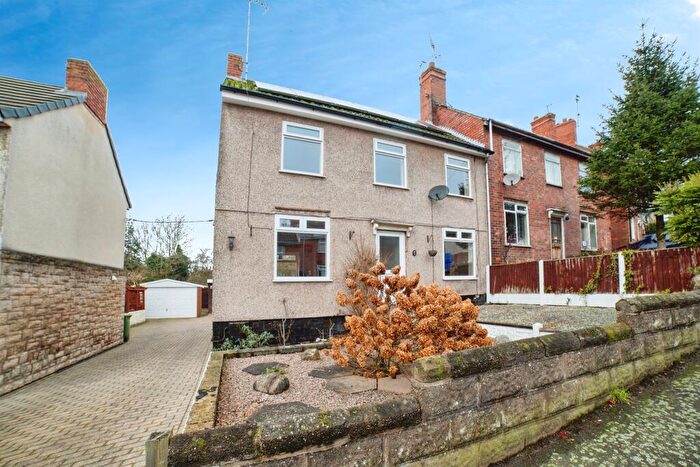
Properties for sale in Blidworth
Roads and Postcodes in Blidworth
Navigate through our locations to find the location of your next house in Blidworth, Mansfield for sale or to rent.
| Streets | Postcodes |
|---|---|
| Abbey Road | NG21 0TW |
| Aberconway Street | NG21 0RF NG21 0RG |
| Andrew Drive | NG21 0TX |
| Appleton Road | NG21 0SG NG21 0SQ |
| Ashwell Terrace | NG21 0QN |
| Beck Crescent | NG21 0QB |
| Beck Lane | NG21 0QA |
| Beech Grove | NG21 0TH |
| Belle Vue Lane | NG21 0RD NG21 0SF |
| Blidworth Lane | NG21 0NZ |
| Boundary Crescent | NG21 0SL |
| Butler Drive | NG21 0QJ |
| Byron Street | NG21 0RL |
| Calverton Road | NG21 0NW |
| Central Avenue | NG21 0SH |
| Chaworth Street | NG21 0SD |
| Clare Hill | NG21 0TY |
| Claybank Villas | NG21 0QS |
| Cottage Close | NG21 0QE |
| Cross Lane | NG21 0LX NG21 0LZ |
| Dale Close | NG21 0TF |
| Dale Lane | NG21 0SA NG21 0SU NG21 0TG NG21 0TQ |
| Farr Way | NG21 0UB |
| Field Lane | NG21 0QQ |
| Fishpool Road | NG21 0QP |
| Forest Road | NG21 0SJ |
| Forest View | NG21 0QT |
| Grange Road | NG21 0RN |
| Green Close | NG21 0UD |
| Harlow Street | NG21 0SS |
| Haywood Avenue | NG21 0RE |
| Haywood Oaks Lane | NG21 0PD NG21 0TP NG21 0UA |
| Hillside Road | NG21 0TR |
| Hillside Walk | NG21 0TS |
| Hilton Park | NG21 0PQ |
| Keane Close | NG21 0QY |
| Kirby Close | NG21 0TT |
| Kirks Croft | NG21 0QU |
| Lindhurst | NG18 4TF |
| Lyndhurst Avenue | NG21 0RJ NG21 0SB |
| Lynnes Close | NG21 0TU |
| Main Street | NG21 0PX NG21 0PZ NG21 0QD NG21 0QH NG21 0QL |
| Mansfield Road | NG21 0LR NG21 0PN NG21 0RA NG21 0RB |
| Marriott Lane | NG21 0QF |
| Meadow Lane | NG21 0PT |
| Meadow Road | NG21 0PS |
| New Close | NG21 0PP |
| New Lane | NG21 0PW |
| New Road | NG21 0PR |
| Oak Avenue | NG21 0TJ NG21 0TL NG21 0TN |
| Park Avenue | NG21 0SN NG21 0SW |
| Priory Road | NG21 0RR |
| Rickett Lane | NG21 0ND NG21 0QW |
| Rigg Lane | NG21 0NS |
| Robin Hood Road | NG21 0ST |
| Rock Terrace | NG21 0QR |
| Saville Street | NG21 0RP NG21 0RW |
| Sherwood Avenue | NG21 0SX NG21 0SY |
| Surgery Lane | NG21 0PY |
| The Crescent | NG21 0RH NG21 0SE |
| The Meadows | NG21 0QG |
| The Quadrangle | NG21 0RQ |
| Thorney Abbey Road | NG21 0SP NG21 0SR |
| Top Road | NG21 0NR |
| Will Scarlet Close | NG21 0NJ |
| Windmill Way | NG21 0QX |
Transport near Blidworth
-
Mansfield Town Station
-
Newstead Station
-
Hucknall Station
-
Sutton Parkway Station
-
Kirkby in Ashfield Station
-
Mansfield Woodhouse Station
-
Bulwell Station
-
Thurgarton Station
-
Lowdham Station
-
Shirebrook (Derbys) Station
- FAQ
- Price Paid By Year
- Property Type Price
Frequently asked questions about Blidworth
What is the average price for a property for sale in Blidworth?
The average price for a property for sale in Blidworth is £180,242. This amount is 7% lower than the average price in Mansfield. There are 773 property listings for sale in Blidworth.
What streets have the most expensive properties for sale in Blidworth?
The streets with the most expensive properties for sale in Blidworth are Cross Lane at an average of £805,000, Windmill Way at an average of £425,000 and Green Close at an average of £315,000.
What streets have the most affordable properties for sale in Blidworth?
The streets with the most affordable properties for sale in Blidworth are Rickett Lane at an average of £80,000, The Quadrangle at an average of £118,000 and Kirby Close at an average of £129,625.
Which train stations are available in or near Blidworth?
Some of the train stations available in or near Blidworth are Mansfield Town, Newstead and Hucknall.
Property Price Paid in Blidworth by Year
The average sold property price by year was:
| Year | Average Sold Price | Price Change |
Sold Properties
|
|---|---|---|---|
| 2025 | £186,223 | 1% |
51 Properties |
| 2024 | £185,157 | 8% |
58 Properties |
| 2023 | £170,068 | -2% |
58 Properties |
| 2022 | £174,187 | 6% |
83 Properties |
| 2021 | £163,222 | 8% |
65 Properties |
| 2020 | £150,706 | -9% |
60 Properties |
| 2019 | £164,478 | 18% |
94 Properties |
| 2018 | £134,856 | 8% |
71 Properties |
| 2017 | £124,273 | -6% |
76 Properties |
| 2016 | £131,185 | 8% |
66 Properties |
| 2015 | £120,921 | 0,4% |
57 Properties |
| 2014 | £120,496 | 19% |
66 Properties |
| 2013 | £97,591 | -6% |
39 Properties |
| 2012 | £103,062 | -7% |
35 Properties |
| 2011 | £110,371 | -6% |
42 Properties |
| 2010 | £117,174 | 24% |
45 Properties |
| 2009 | £89,540 | -21% |
48 Properties |
| 2008 | £108,680 | -8% |
47 Properties |
| 2007 | £117,042 | 3% |
79 Properties |
| 2006 | £114,113 | 6% |
84 Properties |
| 2005 | £106,953 | 13% |
63 Properties |
| 2004 | £92,972 | 14% |
99 Properties |
| 2003 | £80,369 | 25% |
104 Properties |
| 2002 | £60,481 | 26% |
124 Properties |
| 2001 | £44,668 | -11% |
121 Properties |
| 2000 | £49,802 | -12% |
111 Properties |
| 1999 | £55,887 | 26% |
86 Properties |
| 1998 | £41,440 | 10% |
67 Properties |
| 1997 | £37,336 | 4% |
62 Properties |
| 1996 | £35,907 | -23% |
59 Properties |
| 1995 | £44,106 | - |
56 Properties |
Property Price per Property Type in Blidworth
Here you can find historic sold price data in order to help with your property search.
The average Property Paid Price for specific property types in the last three years are:
| Property Type | Average Sold Price | Sold Properties |
|---|---|---|
| Semi Detached House | £162,850.00 | 97 Semi Detached Houses |
| Detached House | £292,400.00 | 26 Detached Houses |
| Terraced House | £152,311.00 | 44 Terraced Houses |

