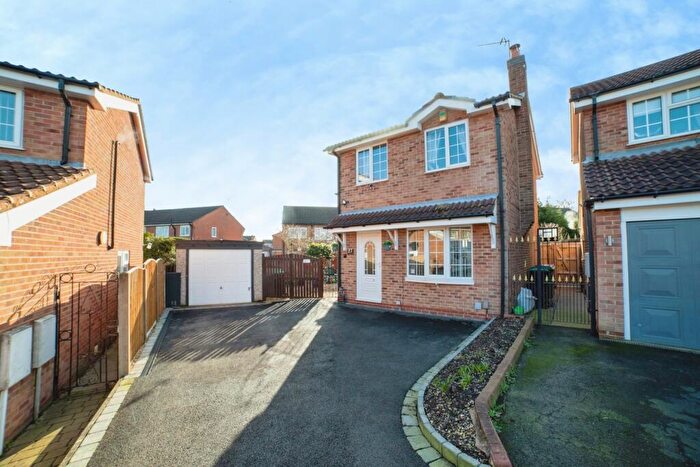
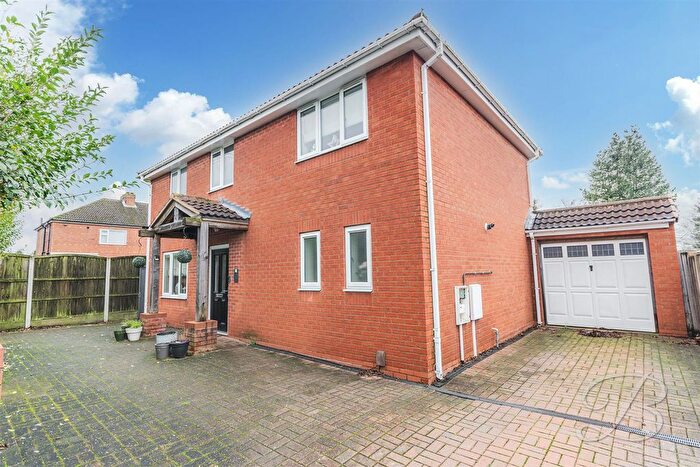
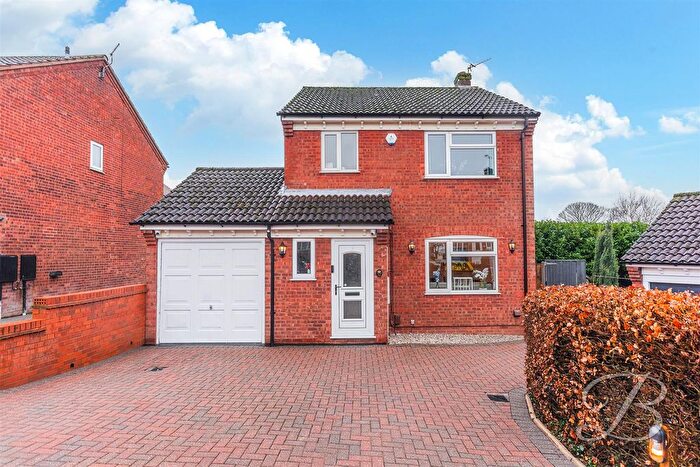
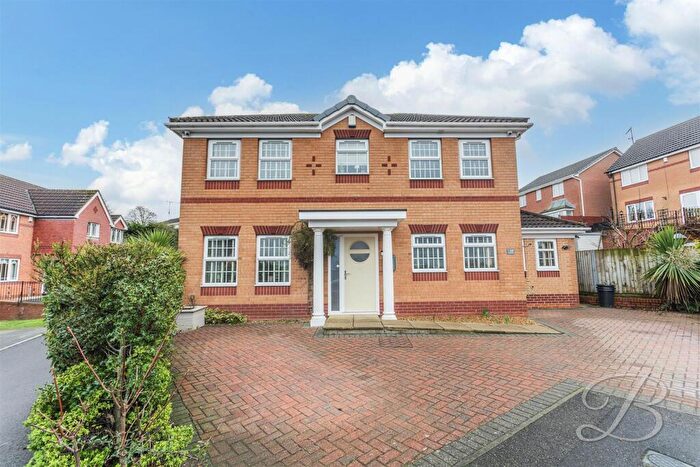
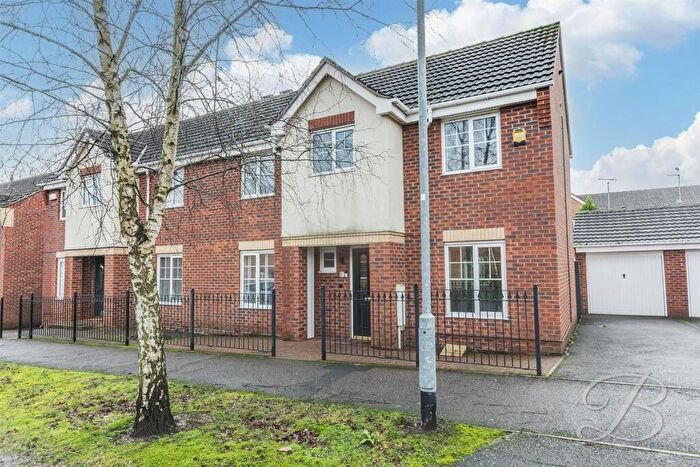
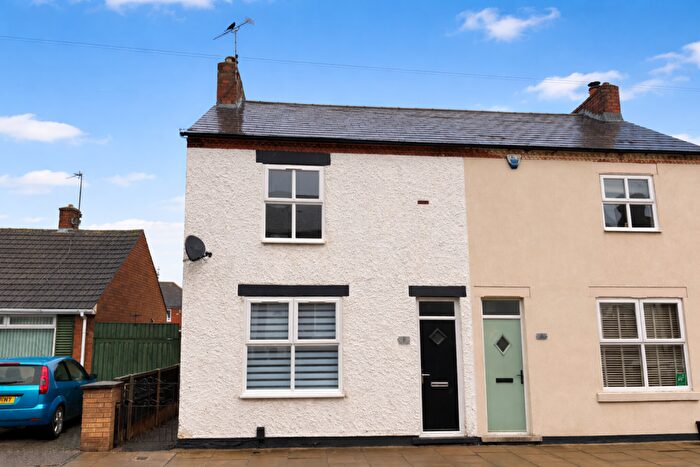
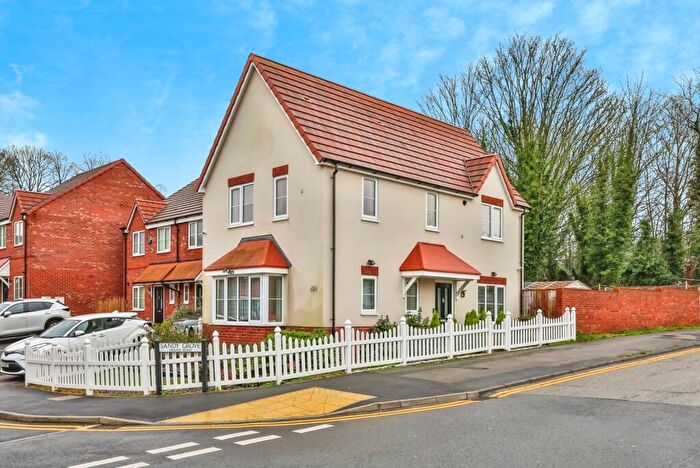
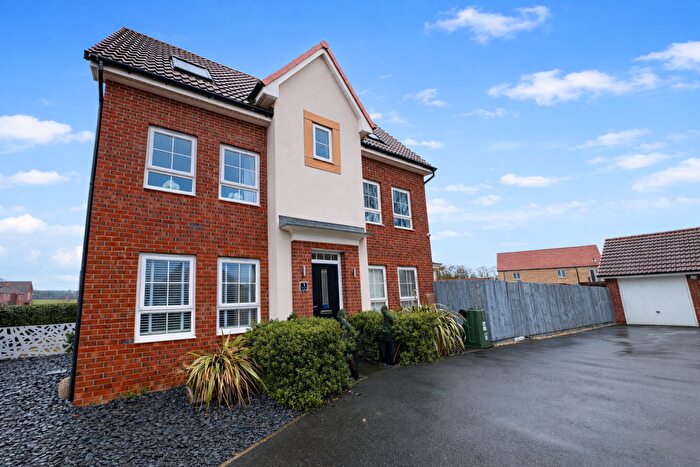
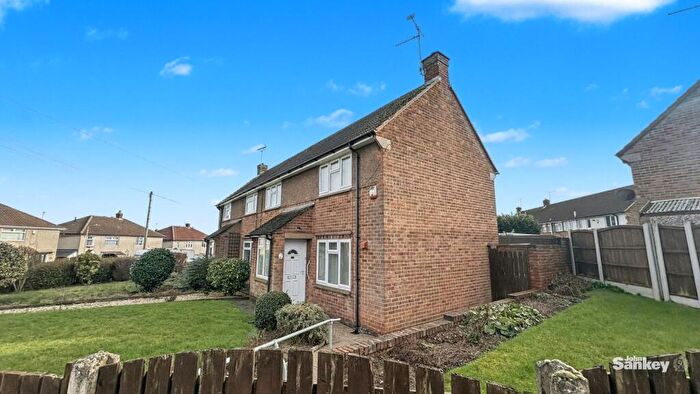
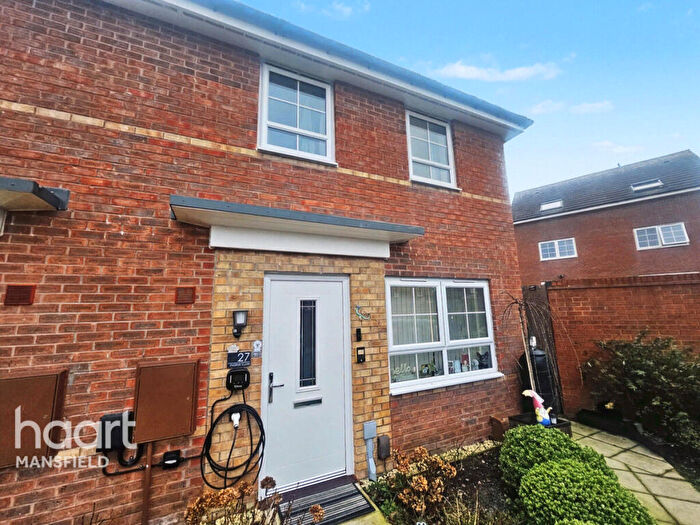
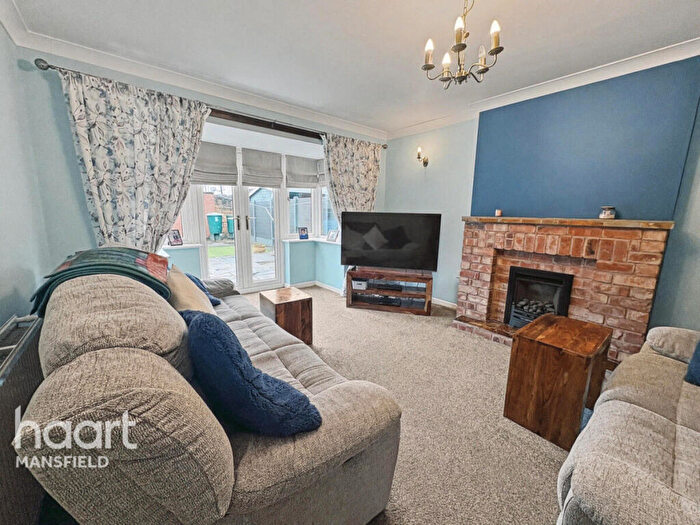
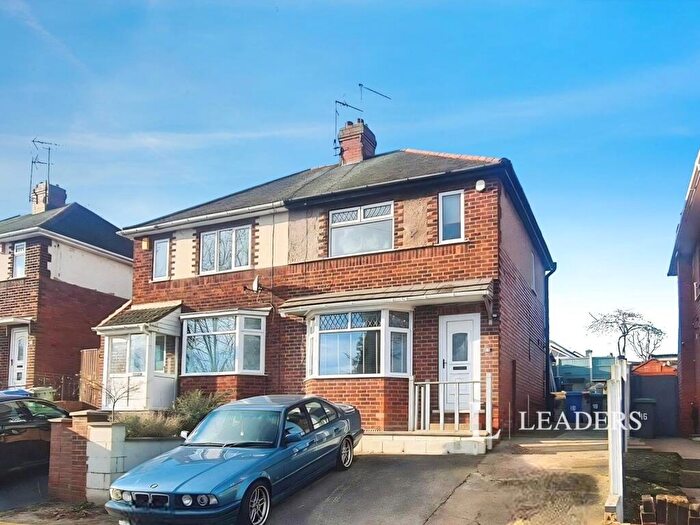
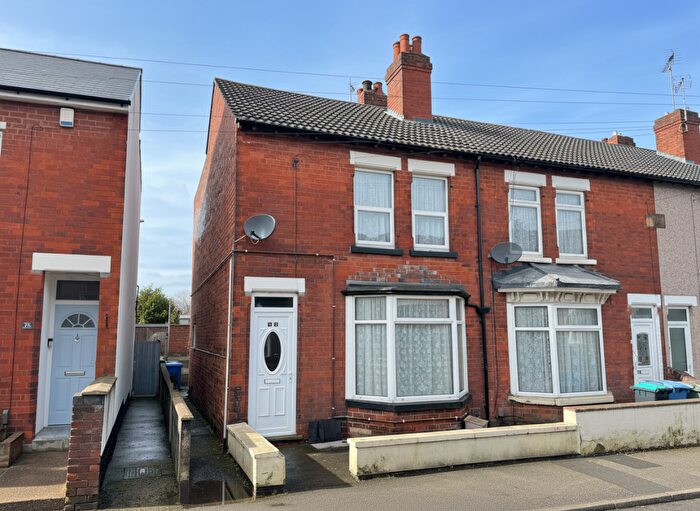
Houses for sale & to rent in Mansfield, Nottinghamshire
House Prices in Mansfield
Properties in Mansfield have an average house price of £194,331.00 and had 5,369 Property Transactions within the last 3 years.¹
Mansfield is an area in Nottinghamshire with 54,567 households², where the most expensive property was sold for £1,300,000.00.
Properties for sale in Mansfield
Neighbourhoods in Mansfield
Navigate through our locations to find the location of your next house in Mansfield, Nottinghamshire for sale or to rent.
- Abbott
- Berry Hill
- Blidworth
- Brick Kiln
- Broomhill
- Bull Farm And Pleasley Hill
- Carr Bank
- Clipstone
- Eakring
- Edwinstowe
- Grange Farm
- Holly
- Hornby
- Kings Walk
- Kingsway
- Ladybrook
- Lindhurst
- Ling Forest
- Manor
- Market Warsop
- Maun Valley
- Meden
- Netherfield
- Newgate
- Newlands
- Oak Tree
- Oakham
- Park Hall
- Peafields
- Penniment
- Portland
- Racecourse
- Rainworth
- Ransom Wood
- Ravenshead
- Sandhurst
- Sherwood
- Sutton In Ashfield East
- Sutton In Ashfield North
- Warsop Carrs
- Welbeck
- Woodhouse
- Woodlands
- Yeoman Hill
- Sutton Junction & Harlow Wood
- Rainworth North & Rufford
- Rainworth South & Blidworth
- Newstead Abbey
- Edwinstowe & Clipstone
- Rock Hill
- Southwell
- Mill Lane
- Newlands Forest Town
- Pleasley
- Central
Transport in Mansfield
Please see below transportation links in this area:
-
Mansfield Town Station
-
Mansfield Woodhouse Station
-
Shirebrook (Derbys) Station
-
Sutton Parkway Station
-
Kirkby in Ashfield Station
- FAQ
- Price Paid By Year
- Property Type Price
Frequently asked questions about Mansfield
What is the average price for a property for sale in Mansfield?
The average price for a property for sale in Mansfield is £194,331. This amount is 23% lower than the average price in Nottinghamshire. There are more than 10,000 property listings for sale in Mansfield.
What locations have the most expensive properties for sale in Mansfield?
The locations with the most expensive properties for sale in Mansfield are Sutton In Ashfield East at an average of £517,800, Berry Hill at an average of £325,871 and Oakham at an average of £313,867.
What locations have the most affordable properties for sale in Mansfield?
The locations with the most affordable properties for sale in Mansfield are Portland at an average of £113,151, Newgate at an average of £119,840 and Ladybrook at an average of £121,783.
Which train stations are available in or near Mansfield?
Some of the train stations available in or near Mansfield are Mansfield Town, Mansfield Woodhouse and Shirebrook (Derbys).
Property Price Paid in Mansfield by Year
The average sold property price by year was:
| Year | Average Sold Price | Price Change |
Sold Properties
|
|---|---|---|---|
| 2025 | £201,781 | 3% |
1,630 Properties |
| 2024 | £195,871 | 5% |
1,907 Properties |
| 2023 | £186,100 | -3% |
1,832 Properties |
| 2022 | £192,023 | 3% |
2,387 Properties |
| 2021 | £185,779 | 9% |
2,823 Properties |
| 2020 | £169,769 | 3% |
2,314 Properties |
| 2019 | £165,101 | 8% |
2,608 Properties |
| 2018 | £151,588 | 5% |
2,415 Properties |
| 2017 | £144,504 | 2% |
2,365 Properties |
| 2016 | £142,252 | 6% |
2,512 Properties |
| 2015 | £133,913 | 5% |
2,266 Properties |
| 2014 | £127,687 | 3% |
2,231 Properties |
| 2013 | £123,342 | 6% |
1,791 Properties |
| 2012 | £116,226 | -1% |
1,439 Properties |
| 2011 | £117,212 | -3% |
1,398 Properties |
| 2010 | £121,030 | 1% |
1,377 Properties |
| 2009 | £119,278 | -4% |
1,164 Properties |
| 2008 | £124,239 | -3% |
1,535 Properties |
| 2007 | £128,343 | 5% |
2,868 Properties |
| 2006 | £122,389 | 4% |
3,132 Properties |
| 2005 | £117,289 | 6% |
2,668 Properties |
| 2004 | £110,256 | 19% |
3,057 Properties |
| 2003 | £89,558 | 18% |
3,079 Properties |
| 2002 | £73,176 | 19% |
3,270 Properties |
| 2001 | £59,035 | 10% |
2,666 Properties |
| 2000 | £53,270 | 3% |
2,211 Properties |
| 1999 | £51,889 | 10% |
2,070 Properties |
| 1998 | £46,896 | 6% |
1,968 Properties |
| 1997 | £43,880 | 0,4% |
1,911 Properties |
| 1996 | £43,689 | 6% |
1,802 Properties |
| 1995 | £40,973 | - |
1,496 Properties |
Property Price per Property Type in Mansfield
Here you can find historic sold price data in order to help with your property search.
The average Property Paid Price for specific property types in the last three years are:
| Property Type | Average Sold Price | Sold Properties |
|---|---|---|
| Semi Detached House | £171,958.00 | 2,055 Semi Detached Houses |
| Terraced House | £130,126.00 | 1,412 Terraced Houses |
| Detached House | £290,802.00 | 1,656 Detached Houses |
| Flat | £100,349.00 | 246 Flats |

