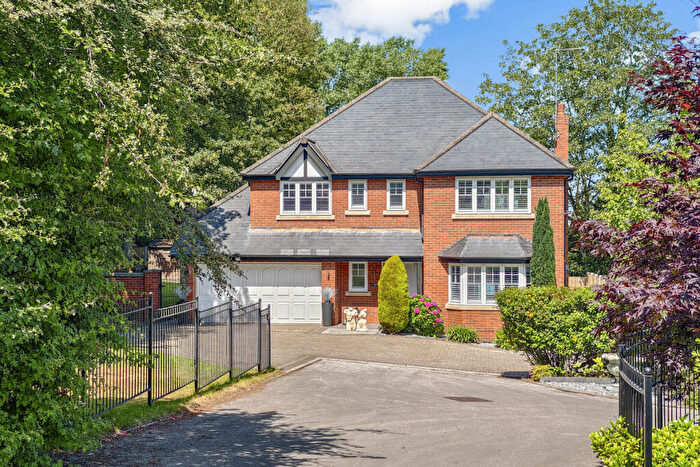
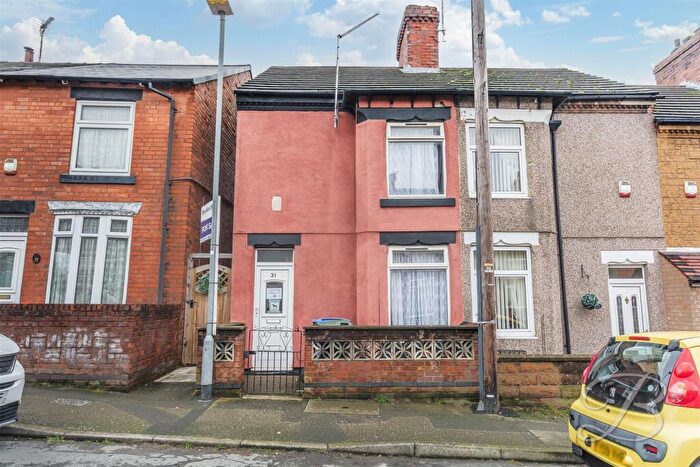
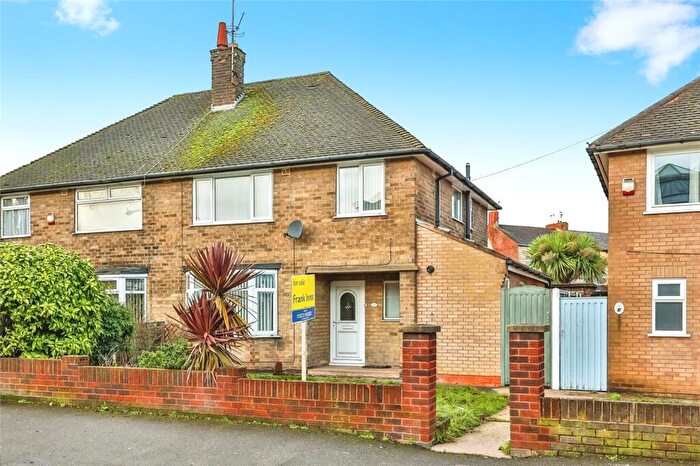
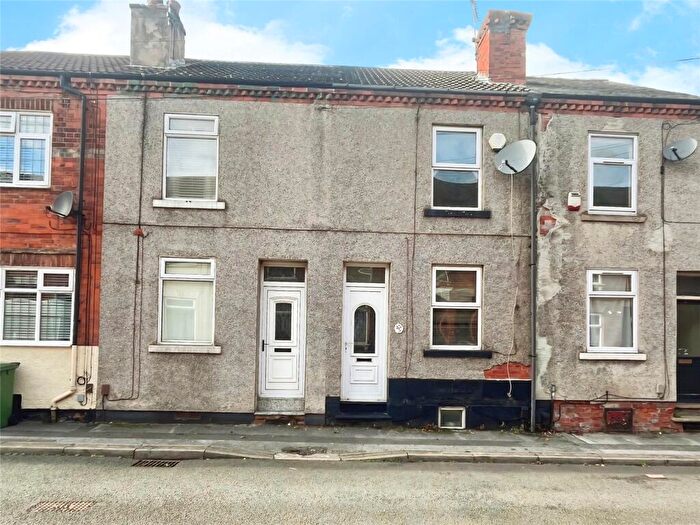
Houses for sale & to rent in Woodlands, Mansfield
House Prices in Woodlands
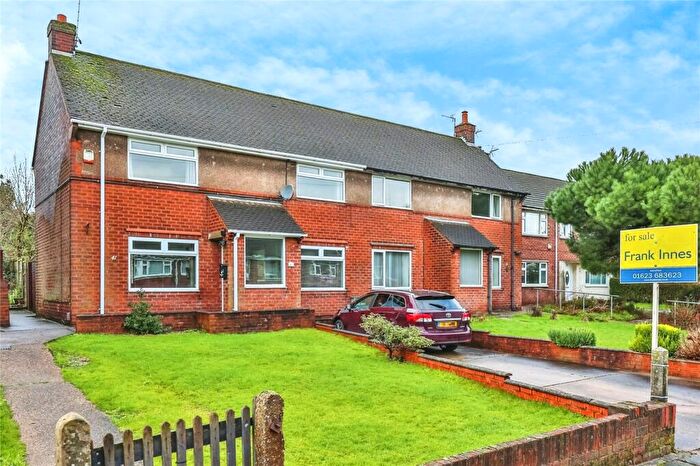
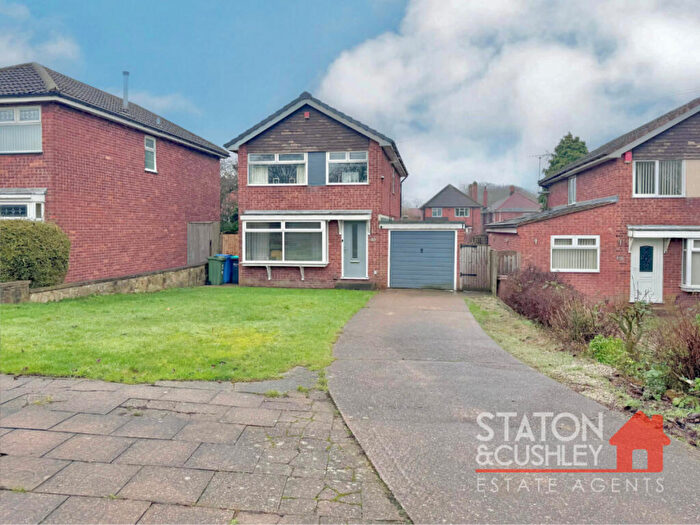
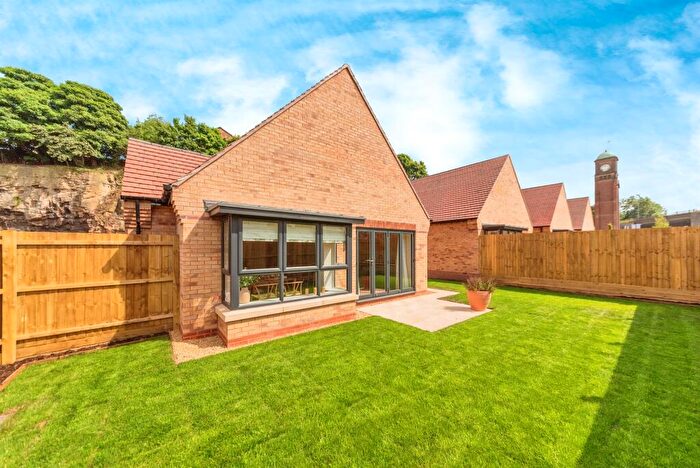
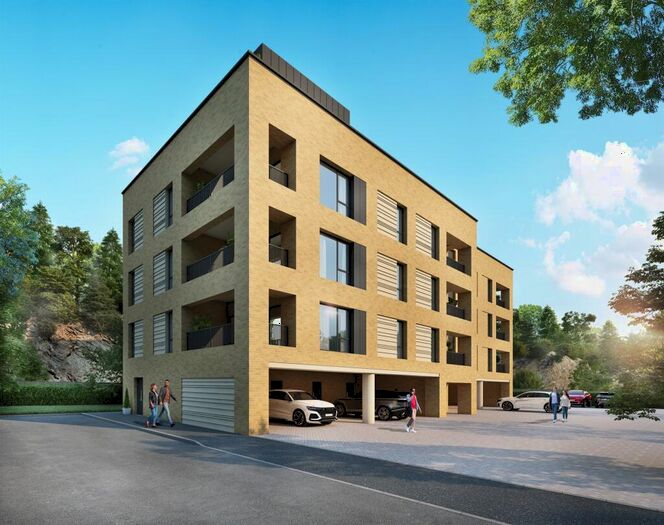
Properties in Woodlands have an average house price of £183,532.00 and had 119 Property Transactions within the last 3 years¹.
Woodlands is an area in Mansfield, Nottinghamshire with 1,080 households², where the most expensive property was sold for £610,000.00.
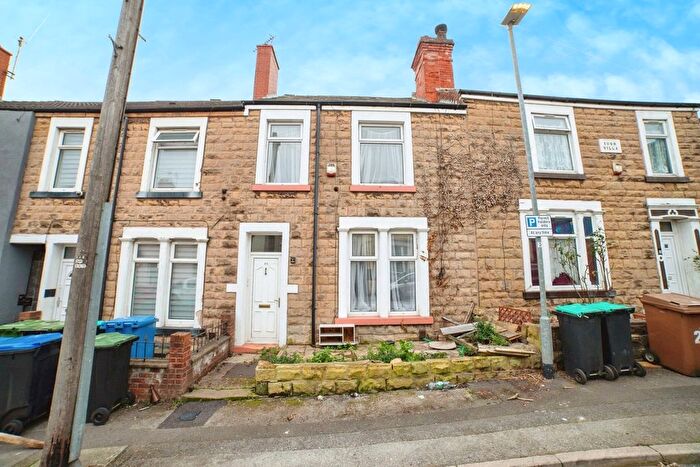
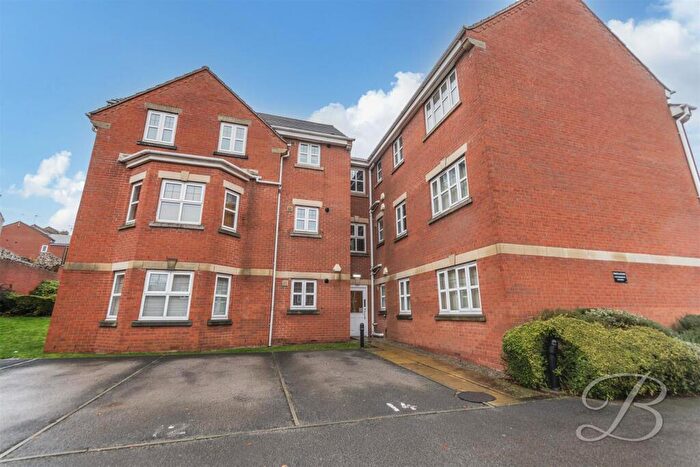
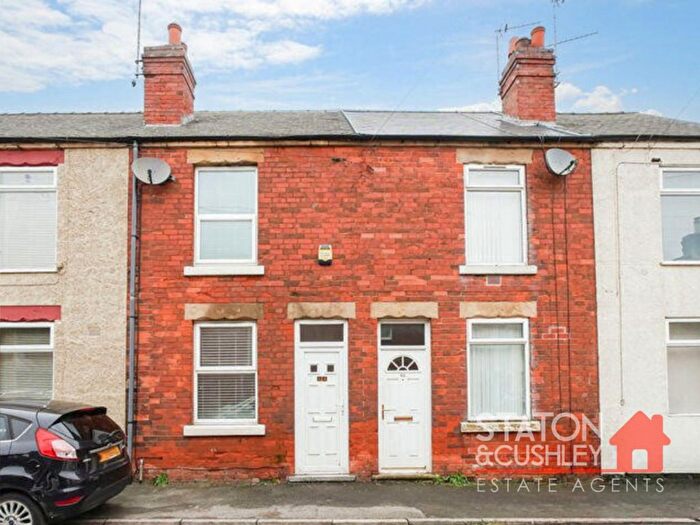
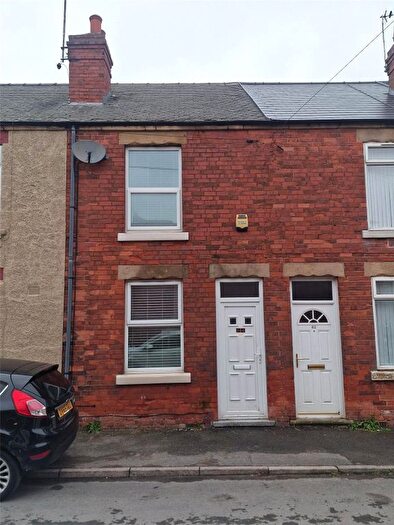
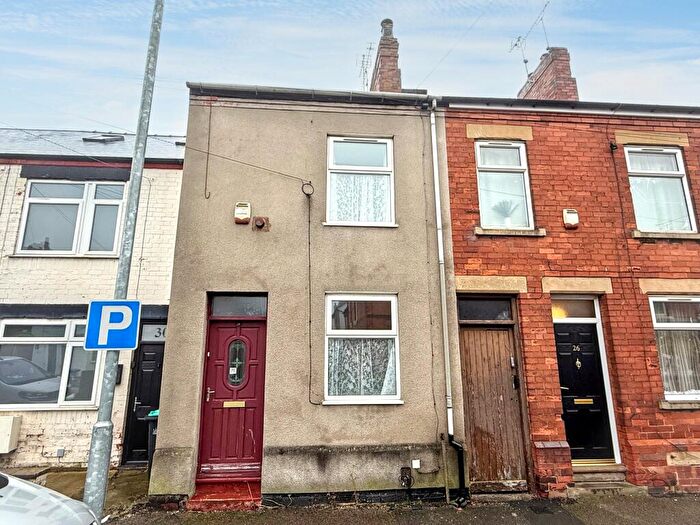
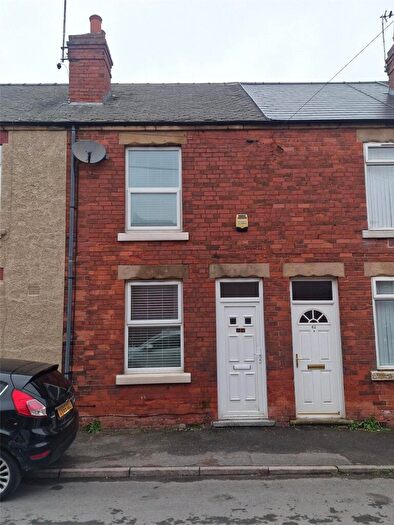
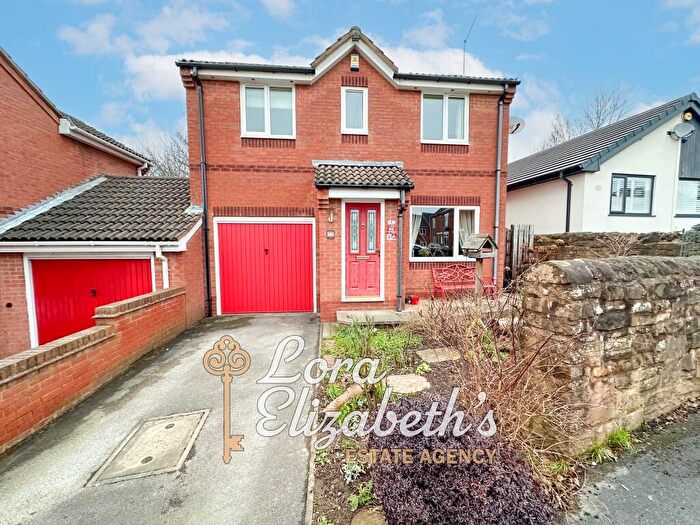
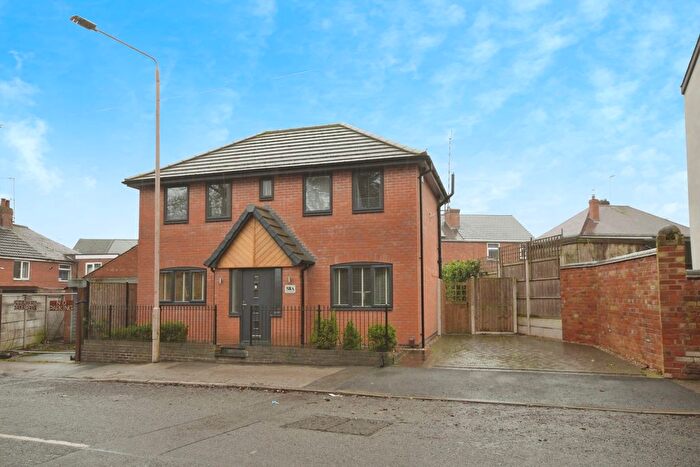
Properties for sale in Woodlands
Roads and Postcodes in Woodlands
Navigate through our locations to find the location of your next house in Woodlands, Mansfield for sale or to rent.
| Streets | Postcodes |
|---|---|
| Ashfield Avenue | NG18 2AE |
| Baggaley Crescent | NG19 7DS |
| Birding Street | NG19 7DT |
| Charles Street | NG19 7AN |
| Chesterfield Road South | NG19 7AD NG19 7AQ NG18 5NR NG19 7AB NG19 7BB NG19 7DN NG19 7TS |
| Clifton Place | NG18 1PN |
| Clumber Street | NG18 1NY NG18 1NU |
| Crow Hill Court | NG19 7AF |
| Crow Hill Drive | NG19 7AE |
| Crow Hill Rise | NG19 7AY |
| Dale Street | NG19 7DY |
| Dunsil Close | NG19 7GA |
| Dunsil Court | NG19 7GB |
| Four Seasons Centre | NG18 1SN NG18 1SU NG18 1SX |
| Gordondale Road | NG19 7DF NG19 7DG |
| Granby Avenue | NG19 7BT |
| Haddon Road | NG19 7BS |
| Highfield Avenue | NG19 7DD |
| Highfield Close | NG19 7DE |
| Jennison Street | NG19 7AW |
| Leeming Street | NG18 1NA NG18 1NB NG18 1LU NG18 1ND |
| Limestone Rise | NG19 7AZ |
| Lindley Street | NG18 1QE |
| Manvers Street | NG18 1TJ |
| Market Place | NG18 1HR NG18 1HZ NG18 1JA |
| Mattersey Court | NG19 7DB |
| Misterton Court | NG19 7DA |
| Mount Pleasant | NG18 1TA |
| Muskham Court | NG19 7DX |
| Newcastle Street | NG18 1TH |
| Norfolk Drive | NG19 7AG |
| Norwell Court | NG19 7DU |
| Oak Bank Close | NG19 7BW |
| Old Meeting House Yard | NG18 1QR |
| Orchard Street | NG19 7DZ |
| Paulsons Drive | NG19 7AA |
| Regent Street | NG18 1SS NG18 1ST NG18 1SW |
| Rosemary Street | NG18 1QL NG18 1RB NG19 6AA NG19 6EE |
| St John Street | NG18 1QH NG18 1QJ |
| St Johns View | NG18 1QP |
| Stockwell Gate | NG18 1LE NG18 1LG |
| Stone Cross Court | NG18 2BN |
| Stone Cross Lane | NG19 7DH |
| The Woodlands | NG19 7DR |
| Thoresby Street | NG18 1QF |
| Thorn Terrace | NG18 1QD |
| Town View | NG18 1BD |
| Union Street | NG18 1RP NG18 1RW |
| Walkden Street | NG18 1QN |
| Welbeck Street | NG18 1TG NG18 1TQ |
| West Bank Avenue | NG19 7BN NG19 7BP NG19 7BU NG19 7DJ |
| West Bank Lea | NG19 7BY |
| West Bank Link | NG19 7BX |
| West Bank Wynd | NG19 7DQ |
| West Gate | NG18 1RR NG18 1RY NG18 1HS NG18 1NH NG18 1RS NG18 1RT NG18 1RU NG18 1RX NG18 1SH |
| West Hill | NG19 7AH |
| West Hill Avenue | NG18 1PQ |
| West Hill Drive | NG18 1PJ NG18 1PL |
| Westdale Road | NG19 7BZ |
| Westfield Lane | NG18 1TD NG18 1TF NG18 1TW NG18 1TL |
| Wood Street | NG18 1QA NG18 1QB NG18 1QQ |
| Woodhouse Road | NG18 2AB NG18 2BB NG18 2AA |
| NG18 1JB NG18 1JD |
Transport near Woodlands
-
Mansfield Town Station
-
Mansfield Woodhouse Station
-
Sutton Parkway Station
-
Shirebrook (Derbys) Station
-
Kirkby in Ashfield Station
- FAQ
- Price Paid By Year
- Property Type Price
Frequently asked questions about Woodlands
What is the average price for a property for sale in Woodlands?
The average price for a property for sale in Woodlands is £183,532. This amount is 6% lower than the average price in Mansfield. There are 1,178 property listings for sale in Woodlands.
What streets have the most expensive properties for sale in Woodlands?
The streets with the most expensive properties for sale in Woodlands are Granby Avenue at an average of £421,900, West Hill Avenue at an average of £420,000 and Crow Hill Rise at an average of £395,000.
What streets have the most affordable properties for sale in Woodlands?
The streets with the most affordable properties for sale in Woodlands are Newcastle Street at an average of £66,700, Thoresby Street at an average of £82,500 and Welbeck Street at an average of £95,570.
Which train stations are available in or near Woodlands?
Some of the train stations available in or near Woodlands are Mansfield Town, Mansfield Woodhouse and Sutton Parkway.
Property Price Paid in Woodlands by Year
The average sold property price by year was:
| Year | Average Sold Price | Price Change |
Sold Properties
|
|---|---|---|---|
| 2025 | £177,737 | 3% |
31 Properties |
| 2024 | £171,541 | -14% |
36 Properties |
| 2023 | £195,287 | -13% |
52 Properties |
| 2022 | £219,788 | 27% |
52 Properties |
| 2021 | £161,281 | -4% |
49 Properties |
| 2020 | £168,521 | 13% |
35 Properties |
| 2019 | £146,707 | 8% |
50 Properties |
| 2018 | £134,901 | -6% |
41 Properties |
| 2017 | £143,031 | -11% |
51 Properties |
| 2016 | £159,012 | 10% |
45 Properties |
| 2015 | £143,568 | 10% |
40 Properties |
| 2014 | £129,760 | -13% |
54 Properties |
| 2013 | £147,003 | 15% |
20 Properties |
| 2012 | £124,664 | 13% |
24 Properties |
| 2011 | £108,875 | -17% |
22 Properties |
| 2010 | £127,653 | 5% |
29 Properties |
| 2009 | £121,454 | 5% |
35 Properties |
| 2008 | £115,728 | -17% |
35 Properties |
| 2007 | £134,977 | -1% |
61 Properties |
| 2006 | £135,822 | 11% |
57 Properties |
| 2005 | £120,235 | -6% |
61 Properties |
| 2004 | £127,767 | 34% |
95 Properties |
| 2003 | £84,962 | 13% |
77 Properties |
| 2002 | £73,589 | 18% |
73 Properties |
| 2001 | £60,038 | -16% |
47 Properties |
| 2000 | £69,556 | -10% |
46 Properties |
| 1999 | £76,429 | 17% |
33 Properties |
| 1998 | £63,063 | 36% |
55 Properties |
| 1997 | £40,400 | -1% |
32 Properties |
| 1996 | £40,918 | 20% |
33 Properties |
| 1995 | £32,857 | - |
33 Properties |
Property Price per Property Type in Woodlands
Here you can find historic sold price data in order to help with your property search.
The average Property Paid Price for specific property types in the last three years are:
| Property Type | Average Sold Price | Sold Properties |
|---|---|---|
| Semi Detached House | £171,955.00 | 29 Semi Detached Houses |
| Detached House | £344,339.00 | 30 Detached Houses |
| Terraced House | £109,701.00 | 47 Terraced Houses |
| Flat | £105,188.00 | 13 Flats |

