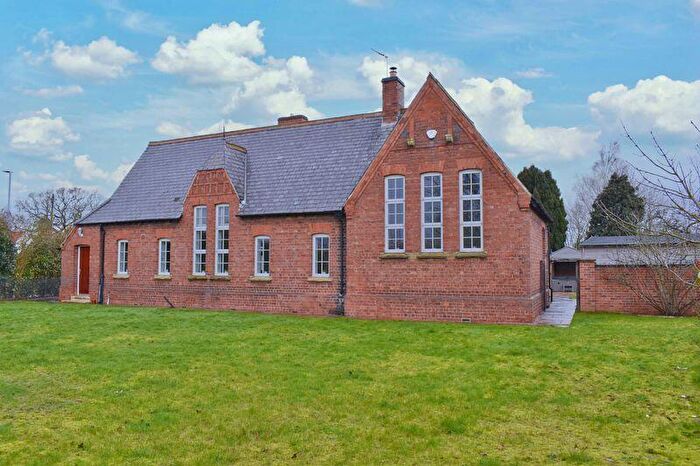
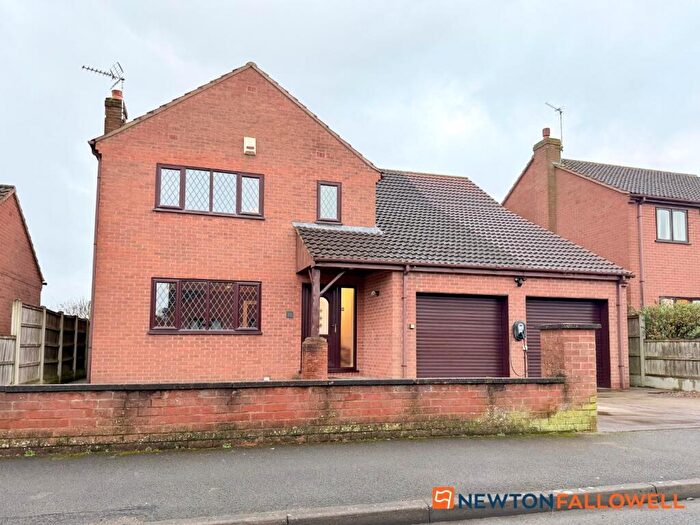
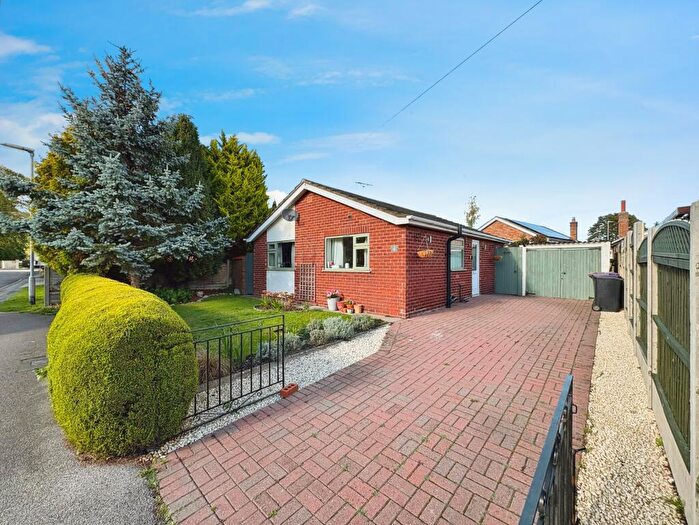
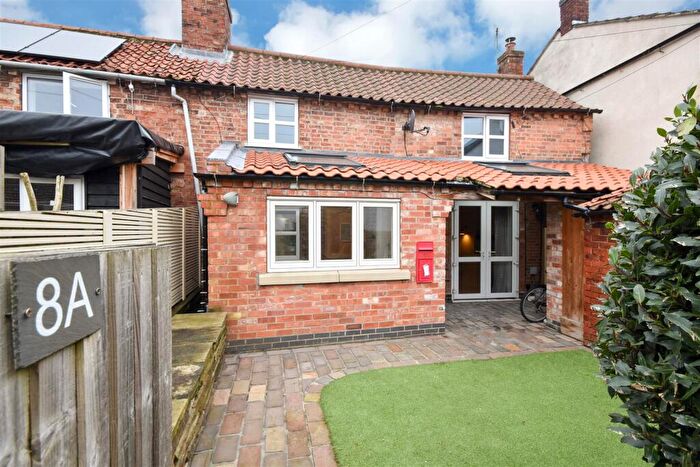
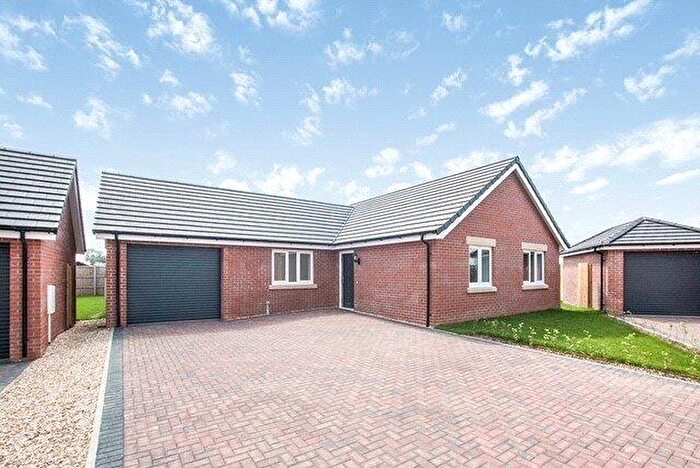
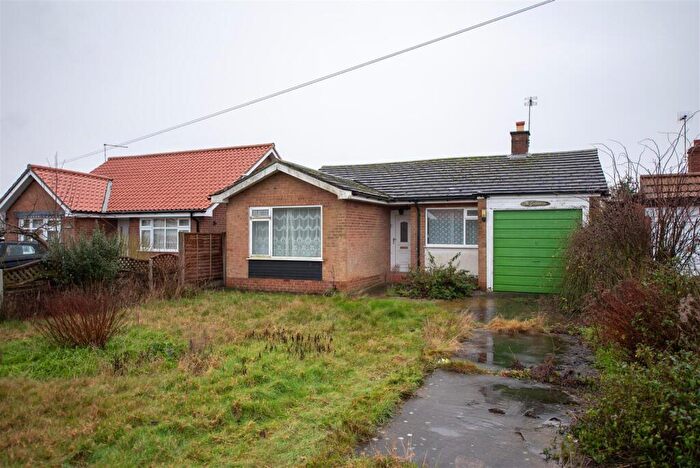
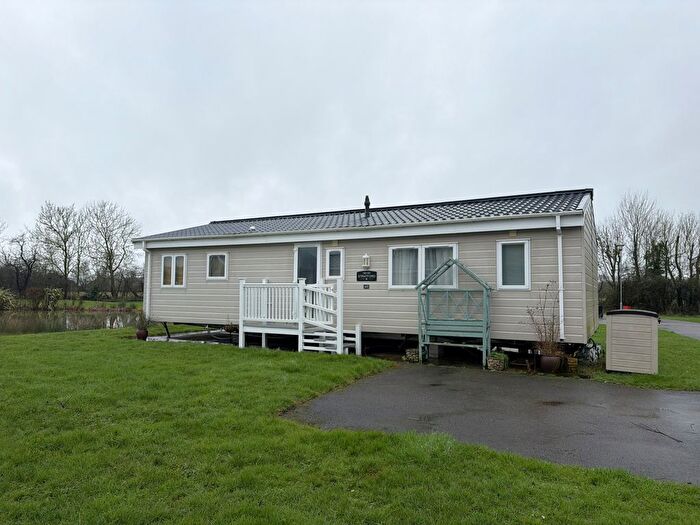
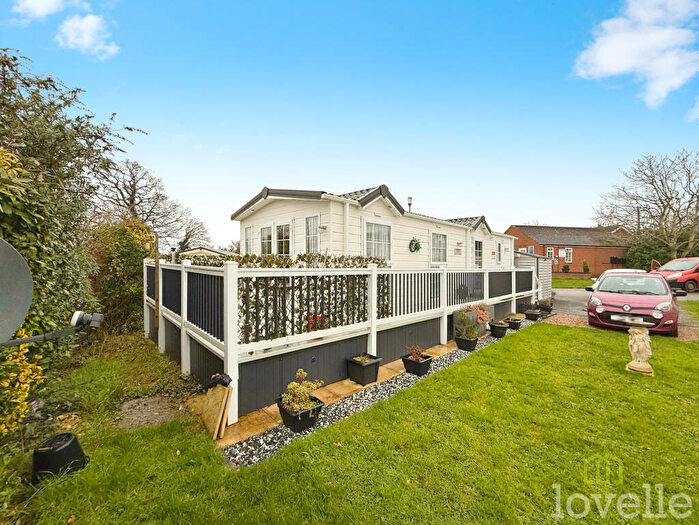
Houses for sale & to rent in Collingham And Meering, Newark
House Prices in Collingham And Meering
Properties in Collingham And Meering have an average house price of £340,523.00 and had 176 Property Transactions within the last 3 years¹.
Collingham And Meering is an area in Newark, Nottinghamshire with 1,889 households², where the most expensive property was sold for £780,000.00.
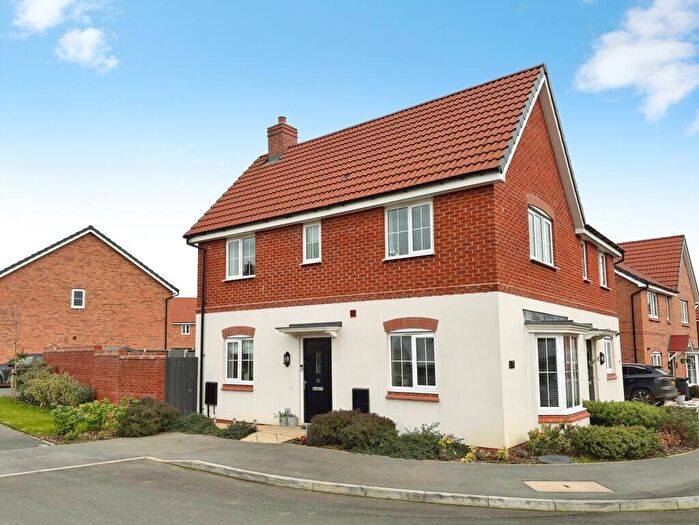
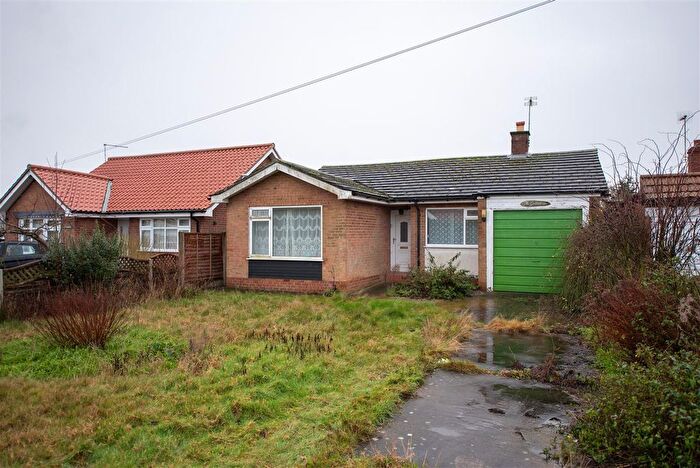
Properties for sale in Collingham And Meering
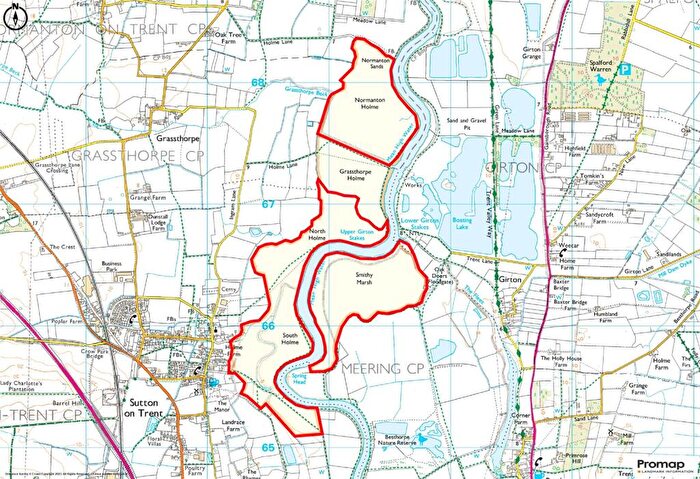
Roads and Postcodes in Collingham And Meering
Navigate through our locations to find the location of your next house in Collingham And Meering, Newark for sale or to rent.
| Streets | Postcodes |
|---|---|
| Amos Lane | NG23 7JJ |
| Back Lane | NG23 7AS |
| Back Street | NG23 7AF |
| Baptist Lane | NG23 7LT |
| Barnfield Road | NG23 7SN |
| Beeches Court | NG23 7JQ |
| Bell Lane | NG23 7LR |
| Besthorpe Road | NG23 7NP |
| Birkland Lane | NG23 7BQ |
| Blackbourn Close | NG23 7SR |
| Braemer Road | NG23 7PN NG23 7PW |
| Brooklands Close | NG23 7NN |
| Brough Lane | NG23 7QZ |
| Brown Wood Lane | NG23 7DJ NG23 7DL |
| Buller Close | NG23 7SX |
| Canon Stevens Close | NG23 7RH |
| Cawthorn Close | NG23 7SU |
| Chapel Lane | NG23 7HD |
| Church Lane | NG23 7AP NG23 7AW NG23 7JP NG23 7NQ |
| Church Road | NG23 7ED |
| Church Street | NG23 7LH |
| Clifton Lane | NG23 7DG |
| Coalyard Lane | NG23 7AH |
| Collingham Road | NG23 7HP |
| Coney Green | NG23 7QJ |
| Cottage Lane | NG23 7LJ NG23 7QL |
| Crew Road | NG23 7ST |
| Cross Lane | NG23 7NY |
| Crown Close | NG23 7PG |
| Curtis Close | NG23 7QW |
| Danethorpe Lane | NG24 2PD |
| Darbyshire Close | NG23 7EW |
| Deane Close | NG23 7PD |
| Denbigh Court | NG23 7PA |
| Drinsey Nook Lane | NG23 7BY |
| Drummond Grove | NG23 7BF |
| Dykes End | NG23 7LD |
| Eagle Road | NG23 7HA |
| Fisher Close | NG23 7SL |
| Fleet Lane | NG23 7HW |
| Fosse Road | NG23 7QB NG23 7QE |
| Foster Road | NG23 7SW |
| Freeth Terrace | NG23 7AX |
| Front Street | NG23 7AA |
| Gainsborough Road | NG23 7AZ NG23 7HX |
| Green Lane | NG23 7HZ |
| Harby Road | NG23 7ET |
| Hewson Lane | NG23 7QQ |
| High Street | NG23 7AD NG23 7AR NG23 7EB NG23 7JA NG23 7LA NG23 7LB NG23 7NG NG23 7NH |
| Lime Tree Close | NG23 7NS |
| London Row | NG23 7AB |
| Low Road | NG23 7HJ |
| Low Street | NG23 7EA NG23 7LS NG23 7LW NG23 7NL |
| Lunn Lane | NG23 7LP |
| Main Road | NG23 7BH NG23 7HR |
| Main Street | NG23 7BS NG23 7BT |
| Manor Road | NG23 7PL |
| Meering Close | NG23 7QN |
| Mill Lane | NG23 7AY NG23 7ES |
| Monkwood Close | NG23 7SY |
| Moor Lane | NG23 7AN NG23 7BD NG23 7BG |
| Moor Road | NG23 7SZ |
| New Lane | NG23 7HY |
| Newark Road | NG23 7LE NG23 7RD NG23 7RF |
| Nixon Way | NG23 7LF |
| North Scarle Road | NG23 7EU |
| Northfield Lane | NG23 7BB |
| Norwell Lane | NG24 2PE |
| Nursery Close | NG23 7BL |
| Oaklands Close | NG23 7RQ |
| Orchard Court | NG23 7BP |
| Peterborough Road | NG23 7SP |
| Pinfold Close | NG23 7PF |
| Pings Close | NG23 7HT |
| Pocklington Road | NG23 7SS |
| Post Office Lane | NG23 7JX |
| Potter Hill Road | NG23 7PY |
| Queen Street | NG23 7NJ |
| Redmay Corner | NG23 7JH |
| Regents Close | NG23 7QR |
| Rio Drive | NG23 7NB |
| Roadwood Lane | NG23 7BX NG23 7BZ |
| Rue De Lyonne | NG23 7NE |
| Sand Lane | NG23 7HS |
| Sanders Close | NG23 7HH |
| Shaftesbury Way | NG23 7ND |
| Silver Street | NG23 7AU |
| Snowdon Road | NG23 7PT |
| South End | NG23 7LL |
| South Scarle Road | NG23 7NU |
| Stapleford Lane | NG23 7QD |
| Station Close | NG23 7RB |
| Station Road | NG23 7EH NG23 7EQ NG23 7RA NG23 7SA |
| Swinderby Road | NG23 7JW NG23 7NX NG23 7NZ NG23 7PB NG23 7PH |
| Temperance Lane | NG23 7LU |
| The Green | NG23 7AG NG23 7LQ |
| The Hemplands | NG23 7PE |
| The Lawns | NG23 7NT |
| The Oaklands | NG23 7RG |
| The Paddock | NG23 7NA |
| The Rookery | NG23 7QP |
| The Row | NG23 7HB |
| Thorney Road | NG23 7ER |
| Thornton Road | NG23 7PX |
| Trent Bank | NG23 7AJ |
| Trent Lane | NG23 7AE NG23 7AT NG23 7HL NG23 7LY NG23 7LZ |
| Vicarage Close | NG23 7PQ |
| Vicarage Road | NG23 7AQ |
| Vine Farmyard | NG23 7NF |
| Washtub Lane | NG23 7JN |
| Watson Close | NG23 7AL |
| Wells Close | NG23 7JU |
| West Road | NG23 7BU |
| Westbrook Lane | NG23 7RE |
| Westfield Lane | NG23 7LN |
| Wheatley Lane | NG23 7QG |
| White Hart Lane | NG23 7LX |
| White Moor Lane | NG23 7QH |
| Wigsley Road | NG23 7DF NG23 7EF |
| Windsor Close | NG23 7PP NG23 7PR |
| Woodhill Road | NG23 7NR |
| NG23 7JR |
Transport near Collingham And Meering
-
Swinderby Station
-
Collingham Station
-
Hykeham Station
-
Newark North Gate Station
-
Newark Castle Station
-
Saxilby Station
-
Lincoln Central Station
-
Rolleston Station
- FAQ
- Price Paid By Year
- Property Type Price
Frequently asked questions about Collingham And Meering
What is the average price for a property for sale in Collingham And Meering?
The average price for a property for sale in Collingham And Meering is £340,523. This amount is 37% higher than the average price in Newark. There are 1,704 property listings for sale in Collingham And Meering.
What streets have the most expensive properties for sale in Collingham And Meering?
The streets with the most expensive properties for sale in Collingham And Meering are Birkland Lane at an average of £780,000, Harby Road at an average of £720,000 and Thorney Road at an average of £631,666.
What streets have the most affordable properties for sale in Collingham And Meering?
The streets with the most affordable properties for sale in Collingham And Meering are Pings Close at an average of £150,000, Main Street at an average of £162,500 and Windsor Close at an average of £177,000.
Which train stations are available in or near Collingham And Meering?
Some of the train stations available in or near Collingham And Meering are Swinderby, Collingham and Hykeham.
Property Price Paid in Collingham And Meering by Year
The average sold property price by year was:
| Year | Average Sold Price | Price Change |
Sold Properties
|
|---|---|---|---|
| 2025 | £369,734 | 14% |
48 Properties |
| 2024 | £317,907 | -9% |
76 Properties |
| 2023 | £346,615 | -13% |
52 Properties |
| 2022 | £392,105 | 18% |
84 Properties |
| 2021 | £320,414 | 2% |
103 Properties |
| 2020 | £313,281 | 11% |
60 Properties |
| 2019 | £277,837 | 1% |
68 Properties |
| 2018 | £276,436 | -1% |
84 Properties |
| 2017 | £279,849 | 9% |
68 Properties |
| 2016 | £255,516 | 6% |
86 Properties |
| 2015 | £239,806 | 4% |
89 Properties |
| 2014 | £230,368 | 6% |
103 Properties |
| 2013 | £216,719 | 5% |
95 Properties |
| 2012 | £205,981 | -4% |
68 Properties |
| 2011 | £214,694 | 6% |
64 Properties |
| 2010 | £201,784 | -6% |
73 Properties |
| 2009 | £213,637 | 3% |
61 Properties |
| 2008 | £208,113 | -12% |
51 Properties |
| 2007 | £232,715 | 10% |
105 Properties |
| 2006 | £210,492 | 7% |
109 Properties |
| 2005 | £196,073 | 1% |
72 Properties |
| 2004 | £194,706 | 12% |
78 Properties |
| 2003 | £171,511 | 10% |
89 Properties |
| 2002 | £154,046 | 25% |
100 Properties |
| 2001 | £116,126 | 11% |
94 Properties |
| 2000 | £103,277 | 15% |
95 Properties |
| 1999 | £87,305 | -5% |
94 Properties |
| 1998 | £91,361 | 16% |
94 Properties |
| 1997 | £76,710 | 7% |
103 Properties |
| 1996 | £71,388 | -4% |
80 Properties |
| 1995 | £73,961 | - |
68 Properties |
Property Price per Property Type in Collingham And Meering
Here you can find historic sold price data in order to help with your property search.
The average Property Paid Price for specific property types in the last three years are:
| Property Type | Average Sold Price | Sold Properties |
|---|---|---|
| Semi Detached House | £259,000.00 | 34 Semi Detached Houses |
| Detached House | £393,431.00 | 117 Detached Houses |
| Terraced House | £204,364.00 | 24 Terraced Houses |
| Flat | £190,000.00 | 1 Flat |

