
Houses for sale in Newark, Nottinghamshire
House Prices in Newark
Properties in Newark have an average house price of £249k and had 4,073 Property Transactions within the last 3 years.¹
Newark is an area in Nottinghamshire with 40,699 households², where the most expensive property was sold for £1.5M.
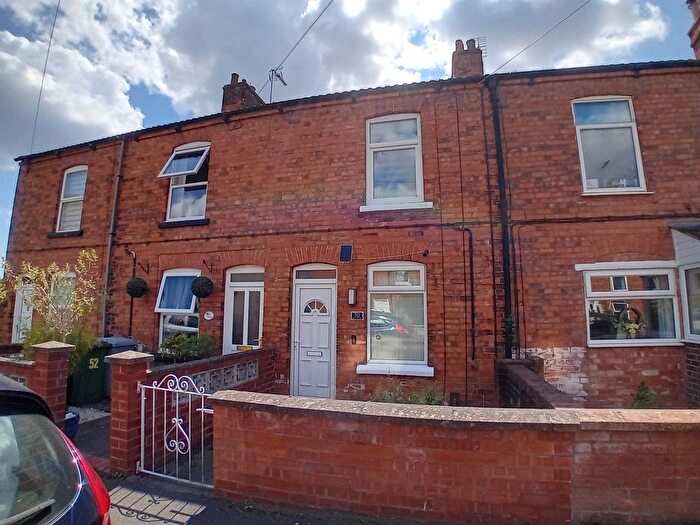
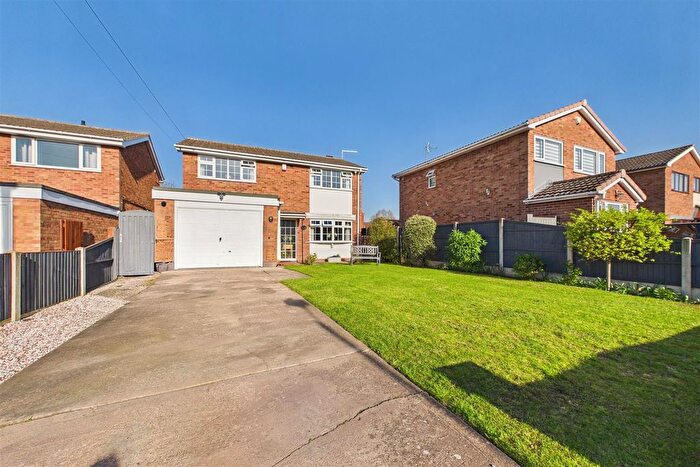
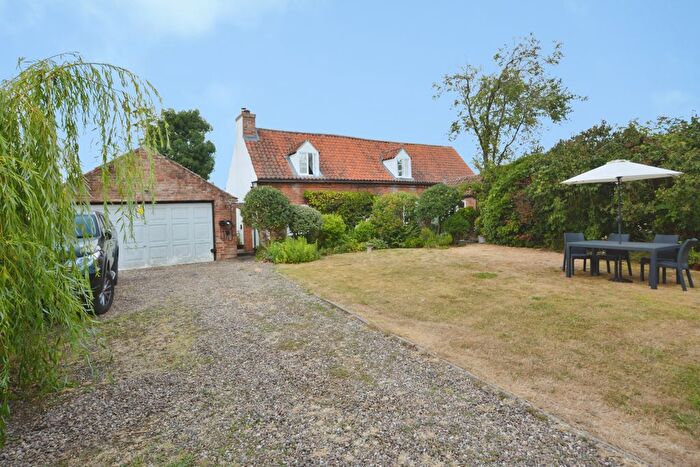
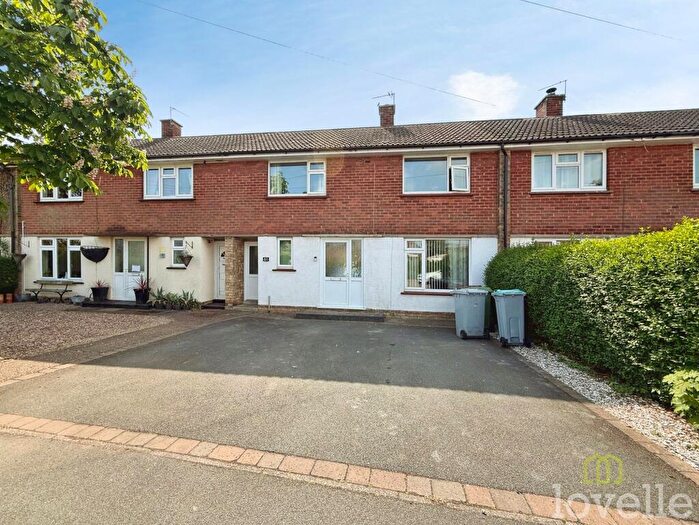
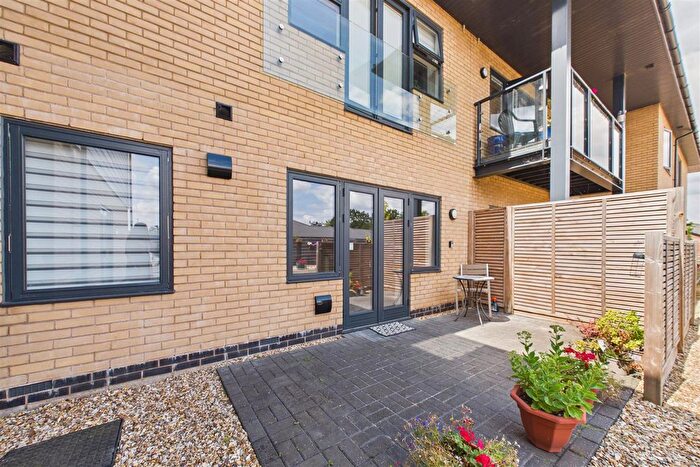
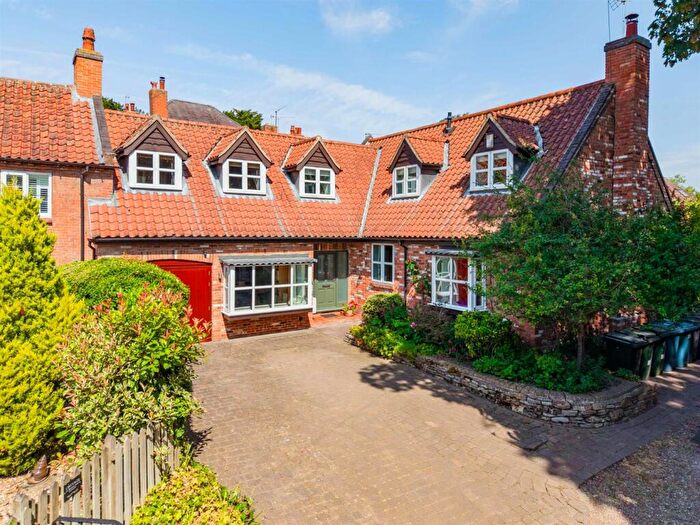
Properties for sale in Newark

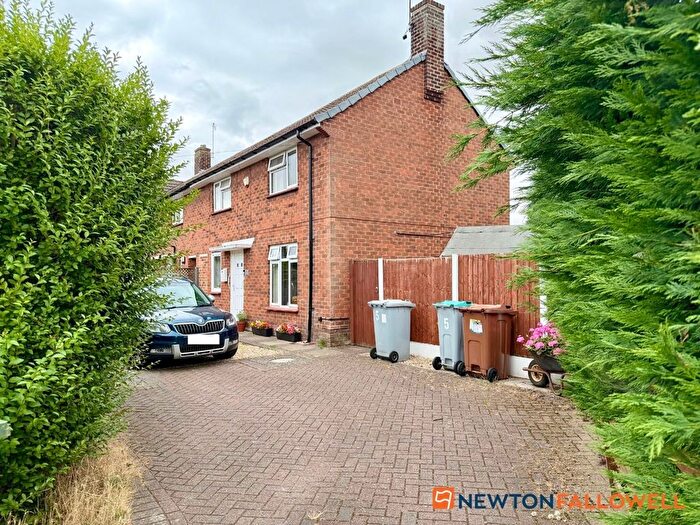

![]()
If you are looking to sell your house, let it out, or receive a property valuation, an expert can help you.
Click the button below to get started.


Neighbourhoods in Newark
Navigate through our locations to find the location of your next house in Newark, Nottinghamshire for sale or to rent.
- Balderton North
- Balderton West
- Beacon
- Boughton
- Bridge
- Castle
- Caunton
- Collingham And Meering
- Devon
- East Markham
- Edwinstowe
- Farndon
- Farnsfield And Bilsthorpe
- Magnus
- Muskham
- Ollerton
- Rainworth
- Southwell East
- Sutton-on-trent
- Thoroton
- Trent
- Tuxford And Trent
- Winthorpe
- Rainworth North & Rufford
- Collingham
- Southwell
- Dover Beck
- Bilsthorpe
- Farnsfield
- Edwinstowe & Clipstone
- Farndon & Fernwood
- Balderton North & Coddington
- Balderton South
Property price trends in Newark
According to the latest Land Registry data, the average home in Newark sold for £256,913 in 2026. That figure comes from a substantial record of 49,694 sales logged over the past 31 years.
Prices have moved up over the last three years. Compared with 2023, when the typical sale came in around £249,088, that's a rise of roughly 3.1%.
Looking back five years, average prices are up about 7.4% since 2021, a gain of around £17,684 in cash terms.
Zoom out to the past decade for the fuller picture. Back in 2016, homes here averaged £183,546, so the typical sold price has climbed about 40% since then, roughly 3.4% a year. Stretch the view to fifteen years and that annual pace holds at about 3.3%.
Frequently asked questions about Newark
What is the average price for a property for sale in Newark?
The average price for a property for sale in Newark is £248,856. This amount is 2% lower than the average price in Nottinghamshire. There are more than 10,000 property listings for sale in Newark.
What locations have the most expensive properties for sale in Newark?
The locations with the most expensive properties for sale in Newark are Southwell East at an average of £609,083, Trent at an average of £494,766 and Rainworth North & Rufford at an average of £480,000.
What locations have the most affordable properties for sale in Newark?
The locations with the most affordable properties for sale in Newark are Bridge at an average of £170,913, Ollerton at an average of £182,248 and Devon at an average of £184,974.
Which train stations are available in or near Newark?
Some of the train stations available in or near Newark are Rolleston, Fiskerton and Newark Castle.
Property Price Paid in Newark by Year
The average sold property price by year was:
| Year | Average Sold Price | Price Change |
Sold Properties
|
|---|---|---|---|
| 2026 | £256,913 | 2% |
86 Properties |
| 2025 | £251,500 | 2% |
1,304 Properties |
| 2024 | £245,789 | -1% |
1,444 Properties |
| 2023 | £249,088 | -2% |
1,239 Properties |
| 2022 | £252,974 | 5% |
1,567 Properties |
| 2021 | £239,229 | 7% |
1,991 Properties |
| 2020 | £222,013 | 7% |
1,588 Properties |
| 2019 | £206,043 | -0,2% |
1,695 Properties |
| 2018 | £206,462 | 9% |
1,781 Properties |
| 2017 | £187,629 | 2% |
1,706 Properties |
Property Price per Property Type in Newark
Here you can find historic sold price data in order to help with your property search.
The average Property Paid Price for specific property types in the last three years are:
| Property Type | Average Sold Price | Sold Properties |
|---|---|---|
| Semi Detached House | £201,410.00 | 1,370 Semi Detached Houses |
| Terraced House | £168,703.00 | 863 Terraced Houses |
| Detached House | £363,666.00 | 1,515 Detached Houses |
| Flat | £126,501.00 | 325 Flats |
Transport in Newark
Please see below transportation links in this area:
