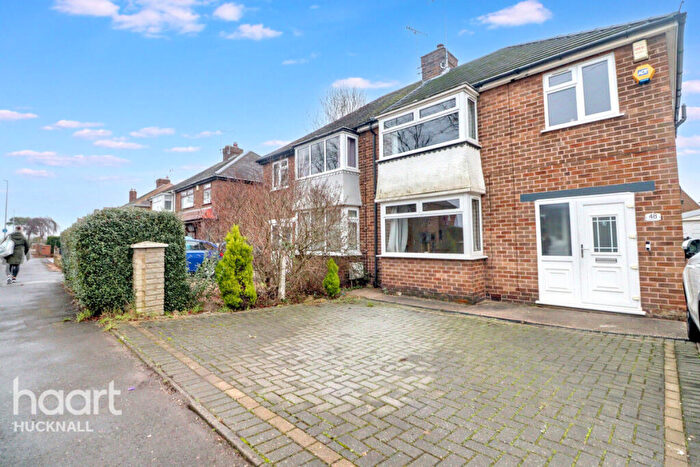
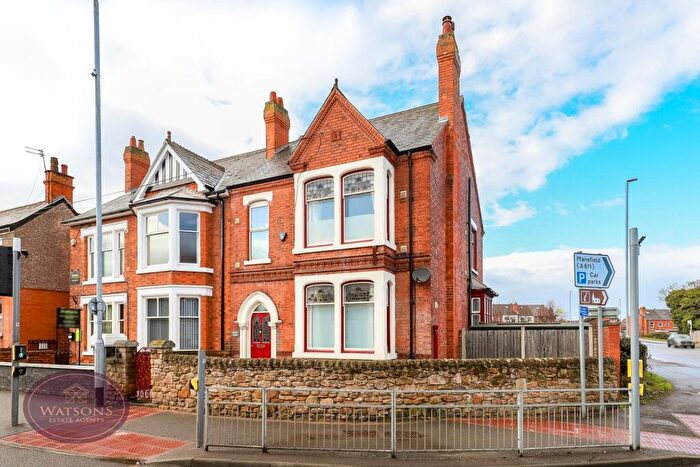
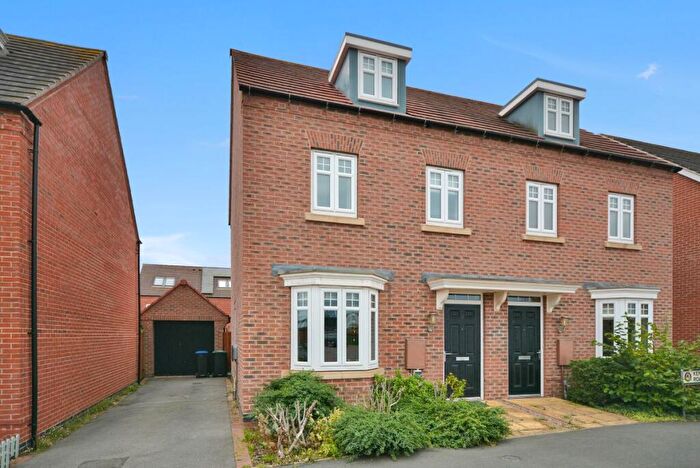
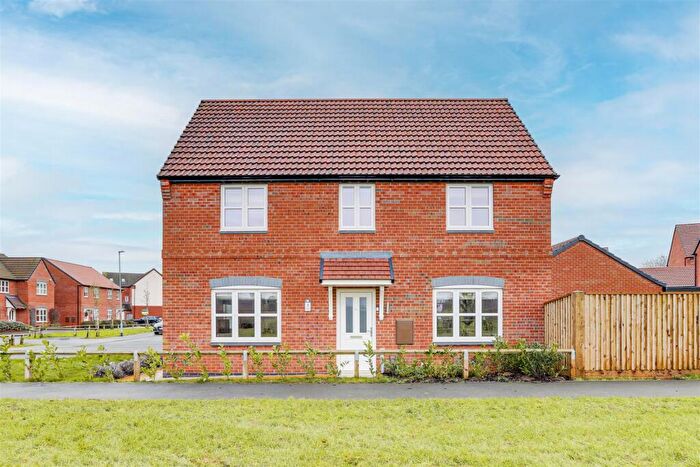
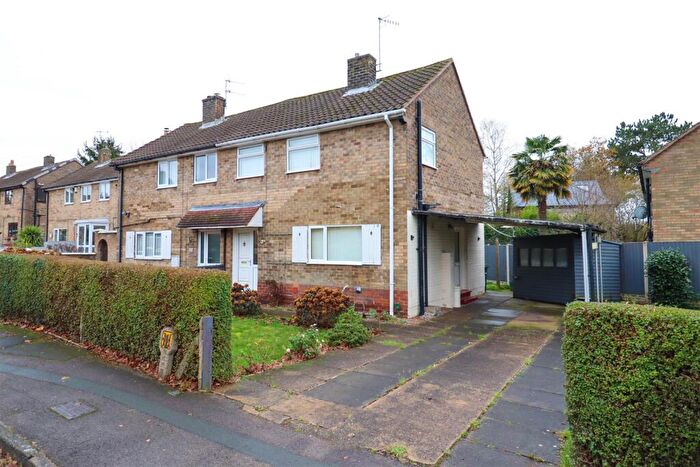
Houses for sale & to rent in Hucknall East, Nottingham
House Prices in Hucknall East
Properties in Hucknall East have an average house price of £214,443.00 and had 552 Property Transactions within the last 3 years¹.
Hucknall East is an area in Nottingham, Nottinghamshire with 3,371 households², where the most expensive property was sold for £650,000.00.
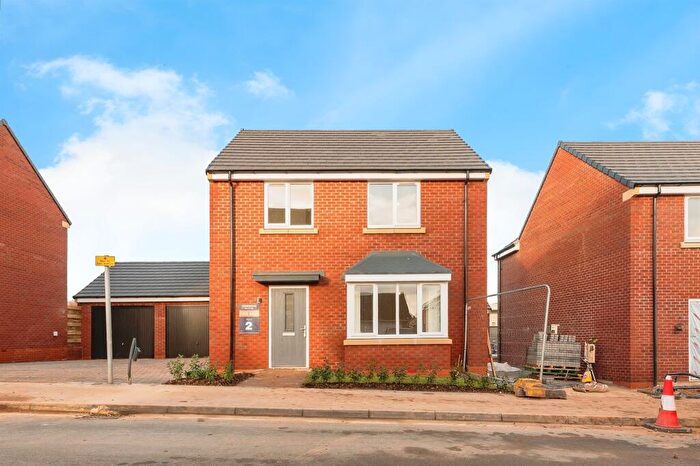
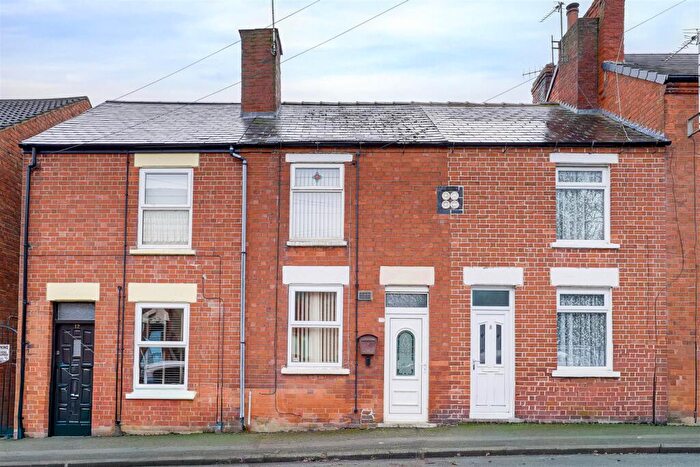
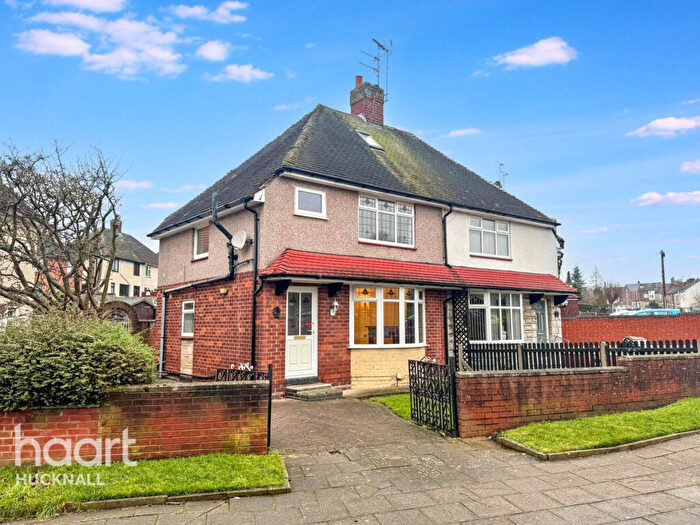
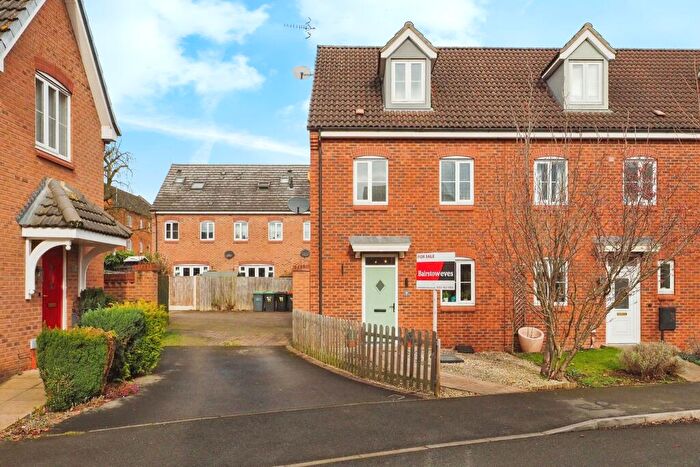
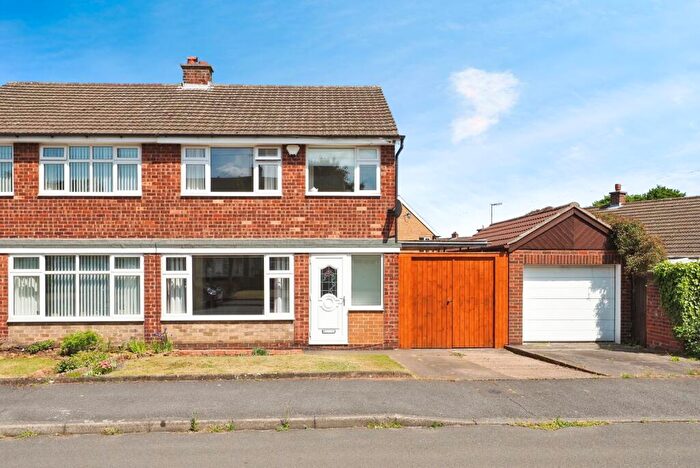
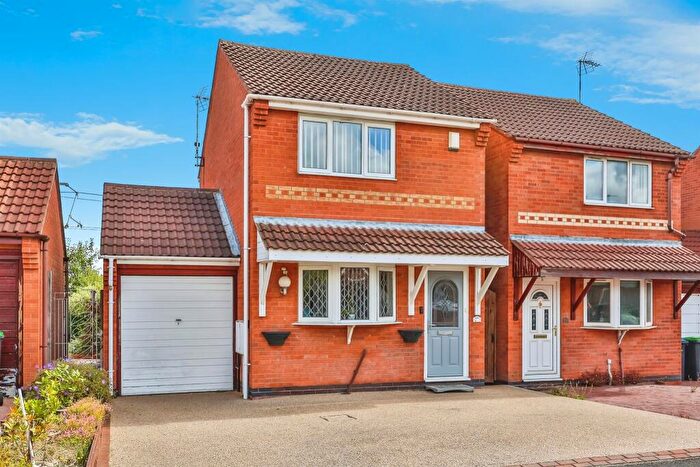
Properties for sale in Hucknall East
Roads and Postcodes in Hucknall East
Navigate through our locations to find the location of your next house in Hucknall East, Nottingham for sale or to rent.
| Streets | Postcodes |
|---|---|
| Acacia Close | NG15 6BG |
| Allwood Gardens | NG15 7RD |
| Almond Close | NG15 6AG |
| Ashgate Road | NG15 7UT |
| Bakewell Lane | NG15 6UR |
| Bamkin Close | NG15 7RL |
| Baths Lane | NG15 7TP |
| Beardall Street | NG15 7HA NG15 7RA NG15 7RJ NG15 7RP NG15 7RQ |
| Bestwood Road | NG15 7PA NG15 7PQ NG15 7PR NG15 7PT |
| Betts Avenue | NG15 6UP |
| Bodill Gardens | NG15 7SQ |
| Bolsover Street | NG15 7TY |
| Bowden Avenue | NG6 8XN |
| Brickyard | NG15 7PG |
| Brickyard Drive | NG15 7PE NG15 7PF |
| Brookside | NG15 7QJ |
| Broomhill Cottages | NG15 7QF |
| Broomhill Park View | NG15 7QQ |
| Broomhill Road | NG15 6AB NG15 6AD NG15 6AE NG15 6AF NG15 6AJ NG15 7QH |
| Burberry Avenue | NG15 7EZ |
| Cedar Grove | NG15 6BJ |
| Centurion Close | NG15 8HB |
| Cherry Avenue | NG15 6BB |
| Chestnut Grove | NG15 6AN |
| Clumber Street | NG15 7PJ |
| Copeland Road | NG15 8EB |
| Corinthian Close | NG15 8HA |
| Coupe Gardens | NG15 7UW |
| Covert Close | NG15 7RH |
| Crab Apple Grove | NG15 7ET |
| Croft Avenue | NG15 7JA |
| Duke Street | NG15 7HB |
| Dukes Court | NG15 7UX |
| Edmond Grove | NG15 7TH |
| Elder Grove | NG15 6AU |
| Ellis Avenue | NG15 7RZ |
| Emperors Way | NG15 8GG |
| Falcon Way | NG15 8HF NG15 8HH NG15 8HL |
| Forge Mill Grove | NG15 7QP |
| Foxglove Close | NG15 7ES |
| Goodall Crescent | NG15 7RT |
| Graingers Terrace | NG15 7RG |
| Grange Cottages | NG15 8FA |
| Grange Gardens | NG15 8ER |
| Grangemoor | NG15 8EX |
| Green Close | NG15 7PP |
| Griffiths Way | NG15 7UU |
| Hankin Street | NG15 7RR |
| Henry Street | NG15 7RY |
| Hobben Crescent | NG15 8HN |
| Holly Close | NG15 6BE |
| Holly Leaf Road | NG15 7EU |
| Hugessen Avenue | NG15 7TG |
| Jenny Burton Way | NG15 7QS NG15 7QT |
| Johnson Avenue | NG15 6AA |
| Justinian Close | NG15 8GR |
| Kenbrook Road | NG15 8HD NG15 8HJ NG15 8HR NG15 8HS |
| Laburnum Grove | NG15 6BH |
| Lakeland Avenue | NG15 7PH |
| Langley Close | NG6 8XJ |
| Larch Close | NG15 6BD |
| Latin Grove | NG15 8GP |
| Leabrook Gardens | NG15 8ED |
| Leadale Avenue | NG15 8EA |
| Leen Valley Way | NG15 7QR |
| Levertons Place | NG15 6US |
| Lilac Road | NG15 6BL |
| Lime Tree Road | NG15 6AL NG15 6AS NG15 6AW NG15 6AY NG15 6BA |
| Lingford Street | NG15 7SJ |
| Magnolia Grove | NG15 6AX |
| Mandeville Close | NG15 8HQ |
| Maple Leaf Way | NG15 7ER |
| Mill Lane | NG6 8FD NG6 8SW |
| Millbank Place | NG6 8EF NG6 8EL NG6 8ES |
| Minerva Grove | NG15 8GW |
| Moor Road | NG15 8EQ NG6 8TD NG6 8TE NG6 8UN |
| Morven Avenue | NG15 7RE |
| Mulberry Grove | NG15 6AR |
| Nottingham Road | NG15 7PY NG15 7QB NG15 7QD NG15 7QE NG15 7QL NG15 7QN |
| Oak Grove | NG15 6AH |
| Oakenhall Avenue | NG15 7TE NG15 7TF |
| Oakfield Road | NG15 7RN |
| Old Mill Close | NG6 8TA |
| Olympia Way | NG15 8HT NG15 8HU |
| Orchid Croft | NG15 7EP |
| Osprey Grove | NG15 8HG |
| Pagett Close | NG15 7US |
| Papplewick Grange | NG15 8EZ |
| Papplewick Lane | NG15 7TJ NG15 8EF NG15 8EG NG15 8EH |
| Park Drive | NG15 6DU NG15 7LQ NG15 7LS NG15 7LU |
| Park View | NG15 7RF |
| Pine Grove | NG15 6AZ |
| Poppy Mews | NG15 7EY |
| Porchester Close | NG15 7UB |
| Portland Road | NG15 7RW NG15 7SA NG15 7SB NG15 7SF NG15 7SL NG15 7SN |
| Primrose Gardens | NG15 7EW |
| Red Kite Close | NG15 8HE |
| Robin Bailey Way | NG15 7UP |
| Roman Crescent | NG15 8GL |
| Rose Flower Grove | NG15 7EQ |
| Roseberry Gardens | NG15 7PX |
| Rufford Close | NG15 7PL |
| Ryknield Road | NG15 8GN |
| Senator Close | NG15 8GH |
| Shelton Avenue | NG15 7QA |
| Sherwood Street | NG15 7SE |
| Snowdrop Close | NG15 7EX |
| Spruce Grove | NG15 6AP |
| St Johns Crescent | NG15 7PW |
| Station Road | NG15 7UD |
| Storth Avenue | NG15 7LY |
| The Copse | NG15 7RS |
| Thorn Grove | NG15 6AT |
| Violet Grove | NG15 7TL |
| Voce Gardens | NG15 7UR |
| Wenlock Drive | NG15 8HW NG15 8HX |
| Wigwam Grove | NG15 7TD |
| Wigwam Lane | NG15 7BP NG15 7SH NG15 7SZ |
| Winifred Street | NG15 7RX |
| Woodford Road | NG15 7LR |
| Woodstock Street | NG15 7SP |
| Yewtree Road | NG15 6AQ |
Transport near Hucknall East
- FAQ
- Price Paid By Year
- Property Type Price
Frequently asked questions about Hucknall East
What is the average price for a property for sale in Hucknall East?
The average price for a property for sale in Hucknall East is £214,443. This amount is 24% lower than the average price in Nottingham. There are 3,100 property listings for sale in Hucknall East.
What streets have the most expensive properties for sale in Hucknall East?
The streets with the most expensive properties for sale in Hucknall East are Falcon Way at an average of £416,111, Bowden Avenue at an average of £382,921 and Park Drive at an average of £377,387.
What streets have the most affordable properties for sale in Hucknall East?
The streets with the most affordable properties for sale in Hucknall East are Graingers Terrace at an average of £123,000, Henry Street at an average of £130,300 and Bodill Gardens at an average of £131,650.
Which train stations are available in or near Hucknall East?
Some of the train stations available in or near Hucknall East are Hucknall, Bulwell and Newstead.
Property Price Paid in Hucknall East by Year
The average sold property price by year was:
| Year | Average Sold Price | Price Change |
Sold Properties
|
|---|---|---|---|
| 2025 | £206,463 | -9% |
89 Properties |
| 2024 | £225,905 | 9% |
172 Properties |
| 2023 | £206,130 | -3% |
125 Properties |
| 2022 | £213,103 | 9% |
166 Properties |
| 2021 | £194,285 | 5% |
208 Properties |
| 2020 | £183,602 | 2% |
143 Properties |
| 2019 | £180,112 | 10% |
178 Properties |
| 2018 | £162,865 | 1% |
181 Properties |
| 2017 | £161,401 | 4% |
210 Properties |
| 2016 | £155,432 | 5% |
232 Properties |
| 2015 | £148,213 | -10% |
216 Properties |
| 2014 | £162,807 | 8% |
255 Properties |
| 2013 | £149,187 | -4% |
178 Properties |
| 2012 | £154,765 | -1% |
179 Properties |
| 2011 | £156,187 | 15% |
204 Properties |
| 2010 | £132,782 | -0,2% |
236 Properties |
| 2009 | £133,078 | -3% |
140 Properties |
| 2008 | £136,759 | -8% |
181 Properties |
| 2007 | £147,465 | 7% |
247 Properties |
| 2006 | £137,484 | 10% |
210 Properties |
| 2005 | £123,466 | 2% |
192 Properties |
| 2004 | £120,560 | 19% |
193 Properties |
| 2003 | £98,154 | 24% |
121 Properties |
| 2002 | £74,928 | 24% |
158 Properties |
| 2001 | £56,656 | -1% |
142 Properties |
| 2000 | £57,370 | 14% |
112 Properties |
| 1999 | £49,299 | 9% |
94 Properties |
| 1998 | £45,070 | 9% |
94 Properties |
| 1997 | £41,178 | -15% |
92 Properties |
| 1996 | £47,462 | -7% |
119 Properties |
| 1995 | £50,635 | - |
140 Properties |
Property Price per Property Type in Hucknall East
Here you can find historic sold price data in order to help with your property search.
The average Property Paid Price for specific property types in the last three years are:
| Property Type | Average Sold Price | Sold Properties |
|---|---|---|
| Flat | £128,360.00 | 82 Flats |
| Semi Detached House | £201,920.00 | 226 Semi Detached Houses |
| Detached House | £328,124.00 | 121 Detached Houses |
| Terraced House | £183,008.00 | 123 Terraced Houses |

