
Houses for sale in Nottingham, Nottinghamshire
House Prices in Nottingham
Properties in Nottingham have an average house price of £283k and had 18,563 Property Transactions within the last 3 years.¹
Nottingham is an area in Nottinghamshire with 190,574 households², where the most expensive property was sold for £5.13M.
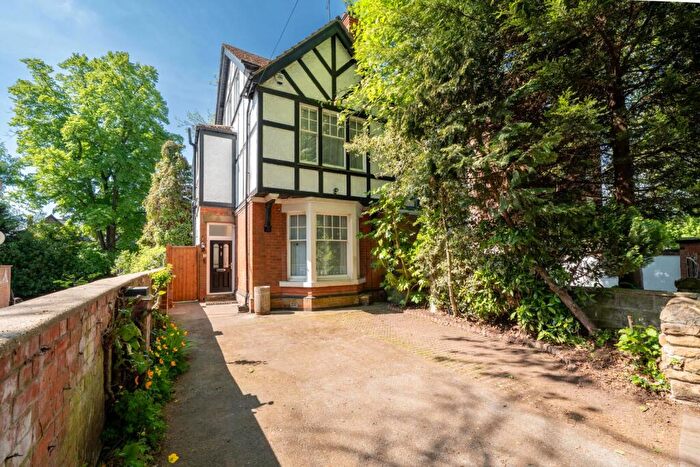
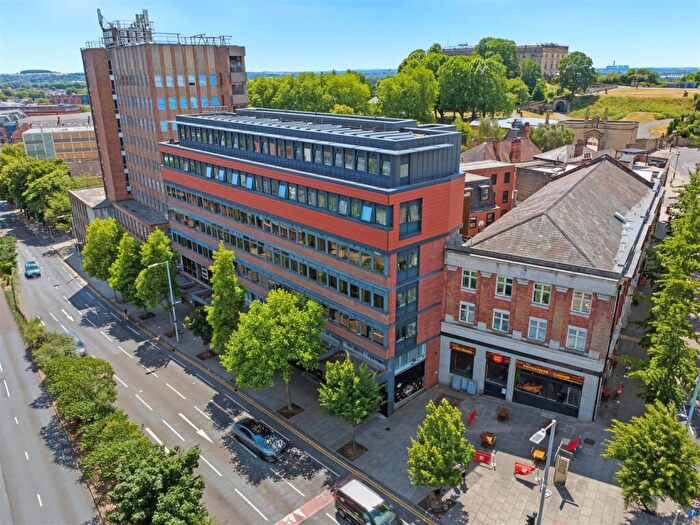
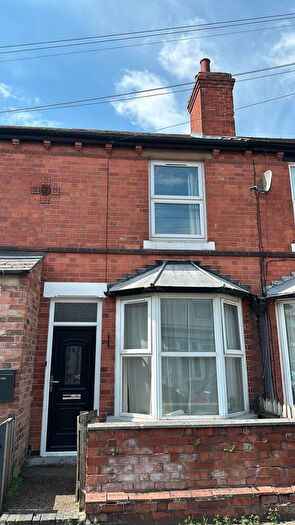
Properties for sale in Nottingham
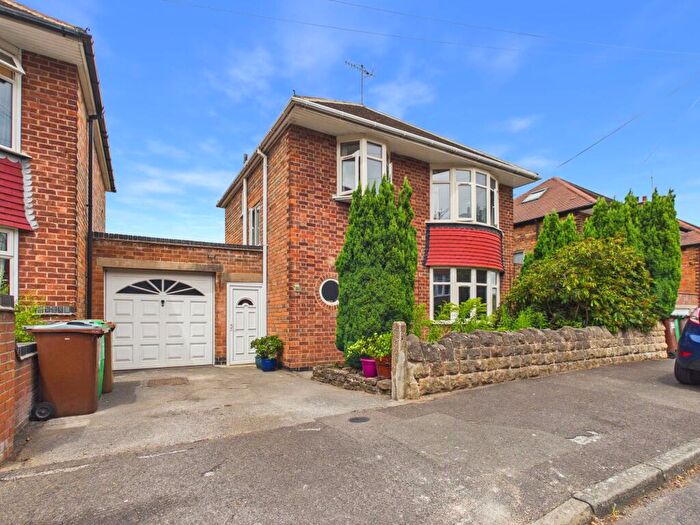
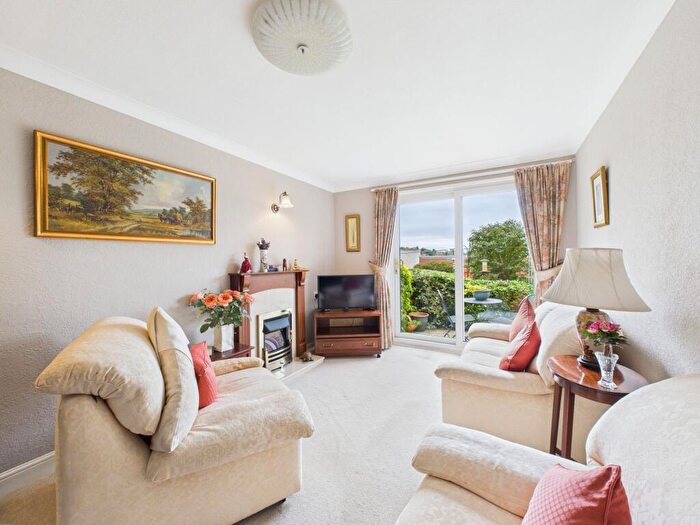
![]()
If you are looking to sell your house, let it out, or receive a property valuation, an expert can help you.
Click the button below to get started.
Neighbourhoods in Nottingham
Navigate through our locations to find the location of your next house in Nottingham, Nottinghamshire for sale or to rent.
- Oak
- Abbey
- Attenborough
- Awsworth
- Beeston Central
- Beeston North
- Beeston Rylands
- Beeston West
- Bestwood Village
- Bingham East
- Bingham West
- Bonington
- Bramcote
- Brinsley
- Burton Joyce And Stoke Bardolph
- Calverton
- Carlton
- Carlton Hill
- Chilwell East
- Chilwell West
- Compton Acres
- Cossall And Kimberley
- Cotgrave
- Cranmer
- Daybrook
- Eastwood North And Greasley (beauvale)
- Eastwood South
- Edwalton Village
- Farndon
- Gamston
- Gedling
- Gotham
- Greasley (giltbrook And Newthorpe)
- Hucknall Central
- Hucknall East
- Hucknall North
- Hucknall West
- Jacksdale
- Keyworth North
- Keyworth South
- Killisick
- Kingswell
- Kirkby In Ashfield Central
- Kirkby In Ashfield East
- Kirkby In Ashfield West
- Lady Bay
- Lambley
- Lowdham
- Lutterell
- Manvers
- Mapperley Plains
- Melton
- Musters
- Netherfield And Colwick
- Nevile
- Newstead
- Nuthall East And Strelley
- Nuthall West And Greasley (watnall)
- Phoenix
- Porchester
- Ravenshead
- Ruddington
- Selston
- Soar Valley
- St James
- St Marys
- Stanford
- Stapleford North
- Stapleford South East
- Stapleford South West
- Sutton In Ashfield Central
- Sutton In Ashfield East
- Sutton In Ashfield West
- Thoroton
- Tollerton
- Toton And Chilwell Meadows
- Trent
- Trent Bridge
- Trowell
- Underwood
- Valley
- Wiverton
- Wolds
- Woodborough
- Woodhouse
- Woodthorpe
- St. Ann's
- Bunny
- Clifton West
- Radcliffe on Trent
- East Bridgford
- Cropwell
- Gamston North
- Nevile & Langar
- Edwalton
- Meadows
- Keyworth & Wolds
- Farndon & Fernwood
- Trent Valley
- Dover Beck
- Dumbles
- Annesley & Kirkby Woodhouse
- Newstead Abbey
- Hucknall South
- Kimberley
- Watnall & Nuthall West
- Greasley
- Nuthall East & Strelley
- Awsworth, Cossall & Trowell
- Eastwood St Mary's
- Eastwood Hall
- Eastwood Hilltop
- Kirkby Cross & Portland
- Central & New Cross
- Leamington
- Larwood
- Ashfields
- Huthwaite & Brierley
- Carsic
- The Dales
- Sutton Junction & Harlow Wood
- Summit
- Abbey Hill
- Gamston South
- Coppice
- Plains
- Colwick
- Ernehale
- Bestwood St Albans
- Hyson Green & Arboretum
- Lenton & Wollaton East
- Attenborough & Chilwell East
- Toton & Chilwell Meadows
- Clifton East
- Shipley Park, Horsley and Horsley Woodhouse
- Langley Mill and Aldercar
- Mapperley
- Dales
- Cavendish
- Bulwell Forest
- Bestwood
- Redhill
- Bulwell
- Wollaton West
- Bilborough
- Aspley
- Basford
- Castle
- Bingham North
- Newton
- Sutton St Mary's
- Stanton Hill & Teversal
- Skegby
- Sutton Central & New Cross
- Greenwood & Summit
- Berridge
- Sherwood
- Radford
Property price trends in Nottingham
According to the latest Land Registry data, the average home in Nottingham sold for £286,699 in 2026. That figure comes from a substantial record of 230,103 sales logged over the past 31 years.
Prices have moved up over the last three years. Compared with 2023, when the typical sale came in around £277,923, that's a rise of roughly 3.2%.
Looking back five years, average prices are up about 6.8% since 2021, a gain of around £18,268 in cash terms.
Zoom out to the past decade for the fuller picture. Back in 2016, homes here averaged £203,121, so the typical sold price has climbed about 41.1% since then, roughly 3.5% a year. Stretch the view to fifteen years and that annual pace holds at about 3.5%.
Frequently asked questions about Nottingham
What is the average price for a property for sale in Nottingham?
The average price for a property for sale in Nottingham is £282,833. This amount is 12% higher than the average price in Nottinghamshire. There are more than 10,000 property listings for sale in Nottingham.
What locations have the most expensive properties for sale in Nottingham?
The locations with the most expensive properties for sale in Nottingham are Gamston North at an average of £1,750,000, Soar Valley at an average of £1,385,000 and Wolds at an average of £683,991.
What locations have the most affordable properties for sale in Nottingham?
The locations with the most affordable properties for sale in Nottingham are Bulwell Forest at an average of £80,782, Eastwood Hilltop at an average of £98,500 and Cavendish at an average of £101,250.
Which train stations are available in or near Nottingham?
Some of the train stations available in or near Nottingham are Bulwell, Nottingham and Carlton.
Property Price Paid in Nottingham by Year
The average sold property price by year was:
| Year | Average Sold Price | Price Change |
Sold Properties
|
|---|---|---|---|
| 2026 | £286,699 | 0,2% |
426 Properties |
| 2025 | £286,249 | 1% |
6,023 Properties |
| 2024 | £283,691 | 2% |
6,458 Properties |
| 2023 | £277,923 | -0,5% |
5,656 Properties |
| 2022 | £279,222 | 4% |
7,110 Properties |
| 2021 | £268,431 | 8% |
8,881 Properties |
| 2020 | £246,638 | 10% |
6,736 Properties |
| 2019 | £222,302 | 0,4% |
8,073 Properties |
| 2018 | £221,380 | 4% |
7,955 Properties |
| 2017 | £212,214 | 4% |
8,206 Properties |
Property Price per Property Type in Nottingham
Here you can find historic sold price data in order to help with your property search.
The average Property Paid Price for specific property types in the last three years are:
| Property Type | Average Sold Price | Sold Properties |
|---|---|---|
| Semi Detached House | £248,052.00 | 6,696 Semi Detached Houses |
| Terraced House | £191,564.00 | 3,716 Terraced Houses |
| Detached House | £393,532.00 | 6,767 Detached Houses |
| Flat | £154,899.00 | 1,384 Flats |
Transport in Nottingham
Please see below transportation links in this area:
