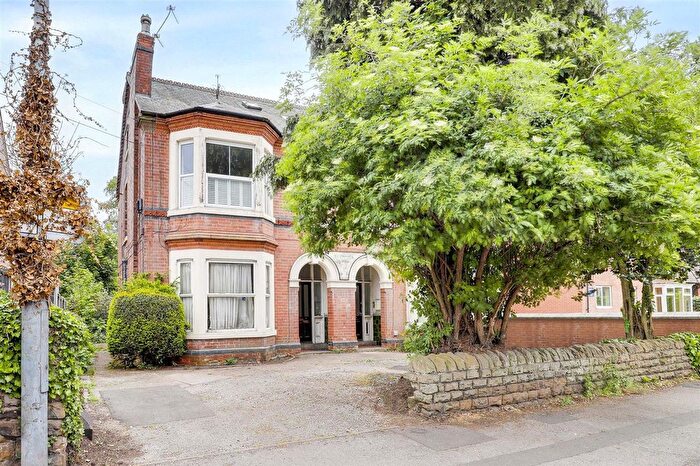
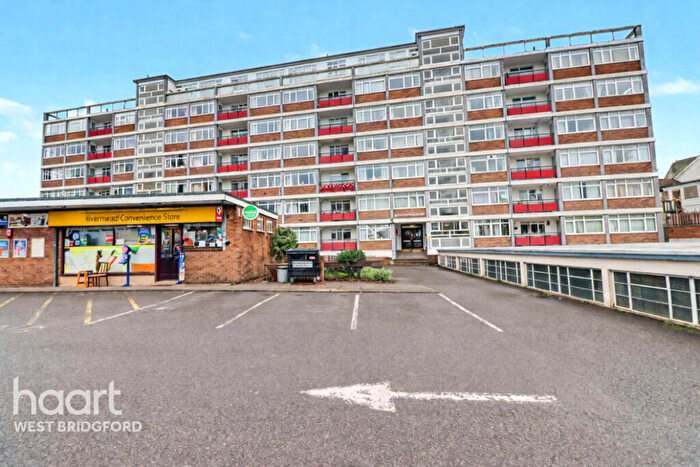
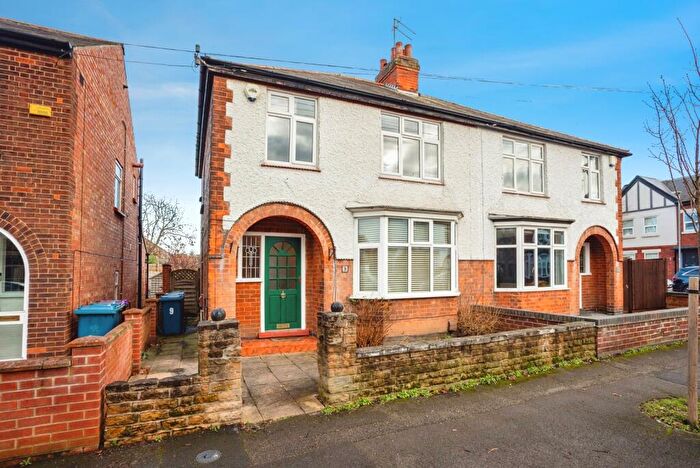
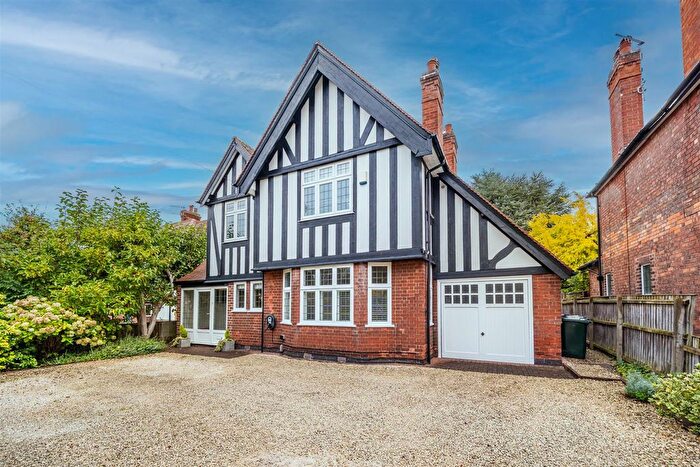
Houses for sale & to rent in Lutterell, Nottingham
House Prices in Lutterell
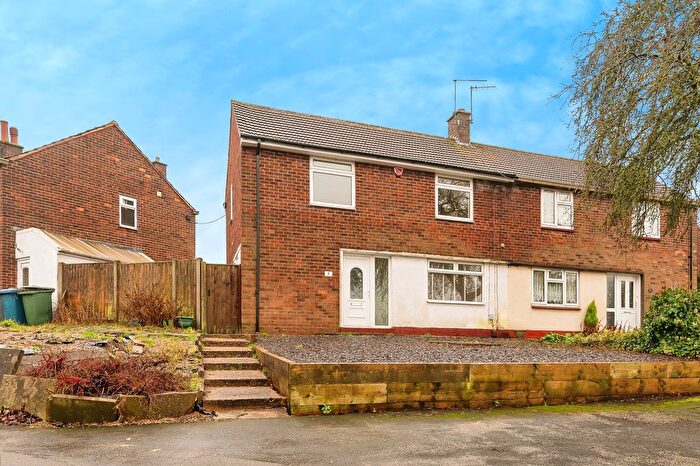
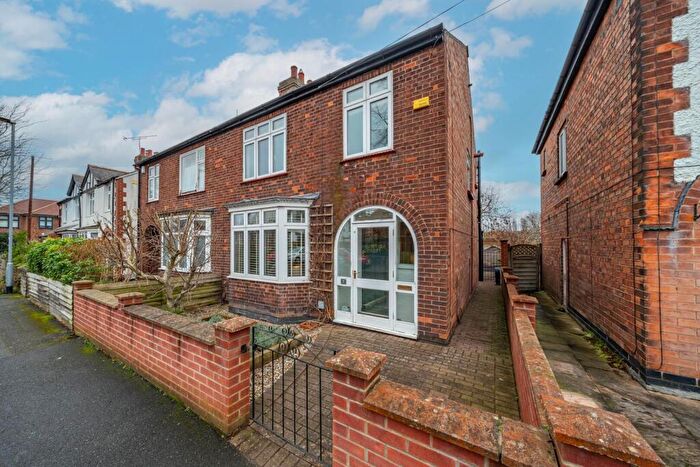
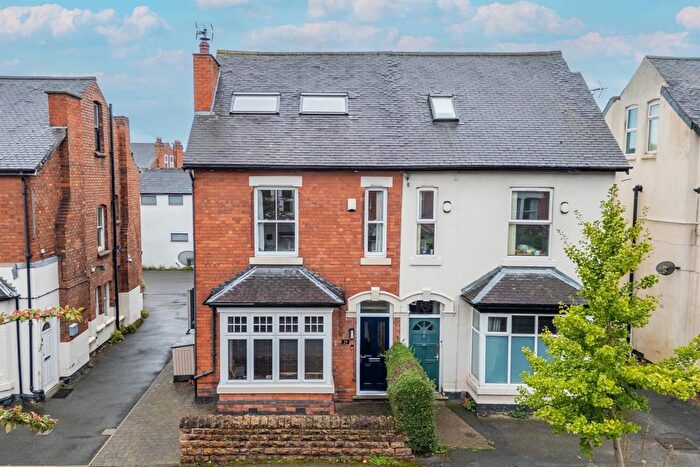
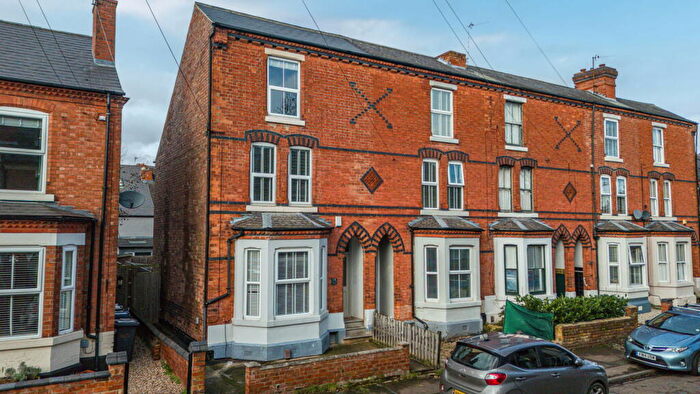
Properties in Lutterell have an average house price of £368,558.00 and had 179 Property Transactions within the last 3 years¹.
Lutterell is an area in Nottingham, Nottinghamshire with 1,760 households², where the most expensive property was sold for £740,000.00.
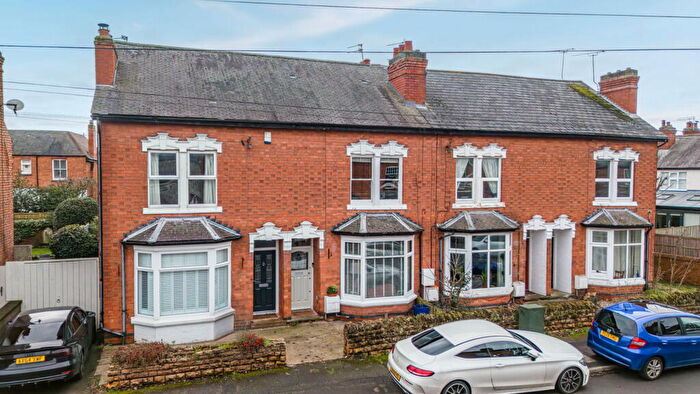
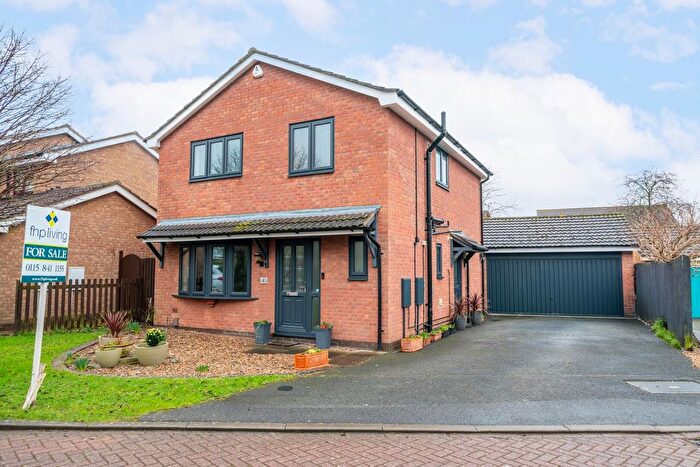
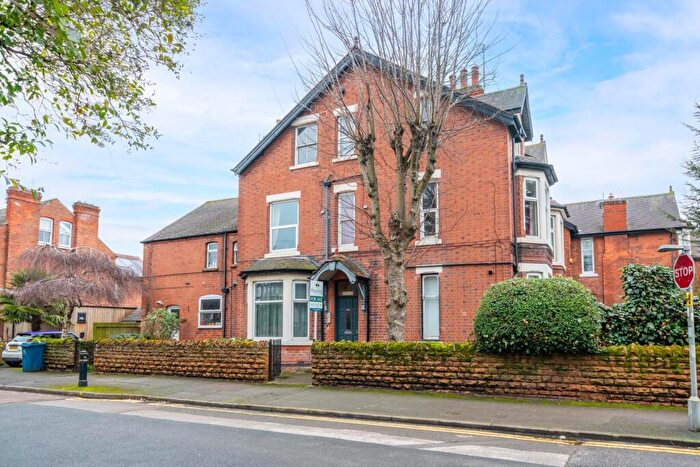
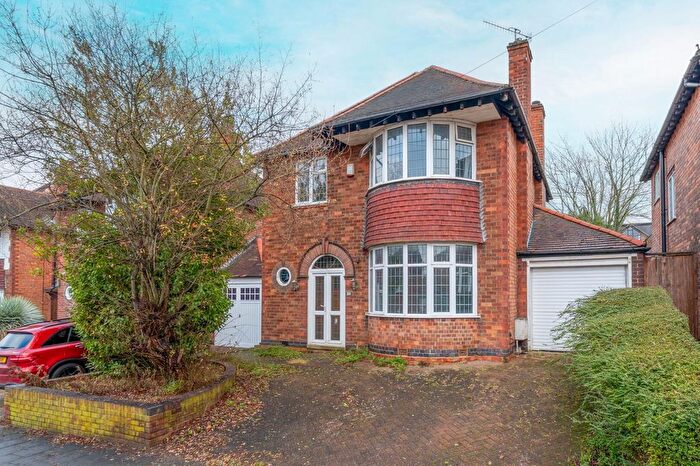
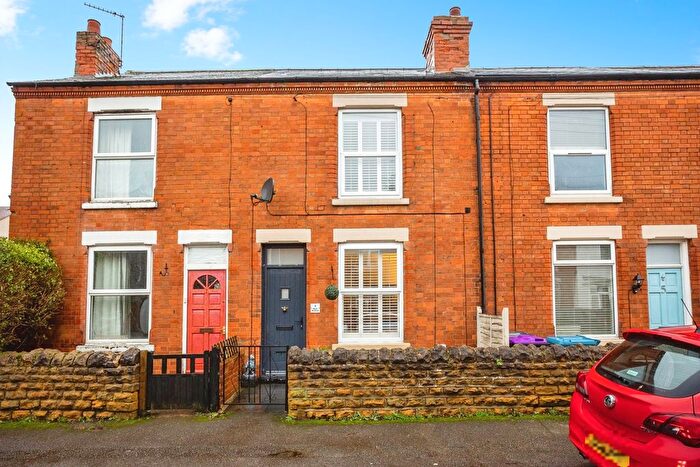
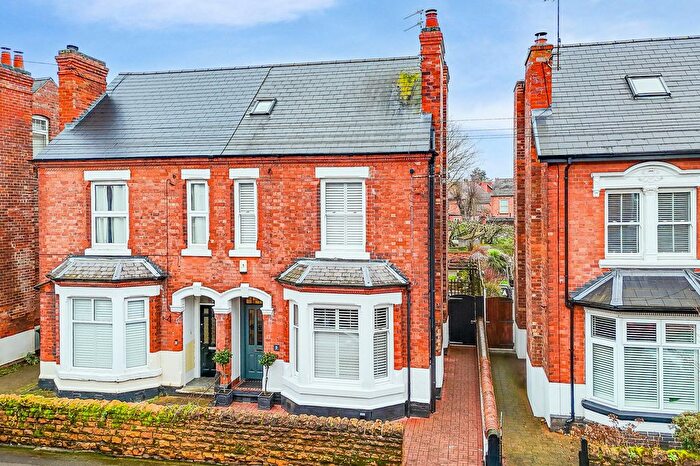
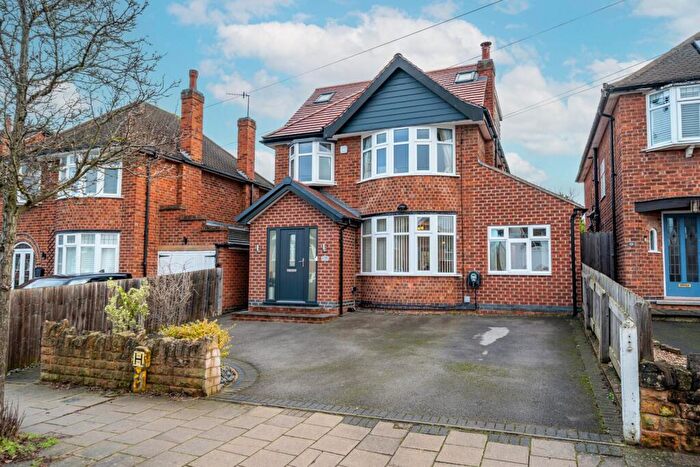
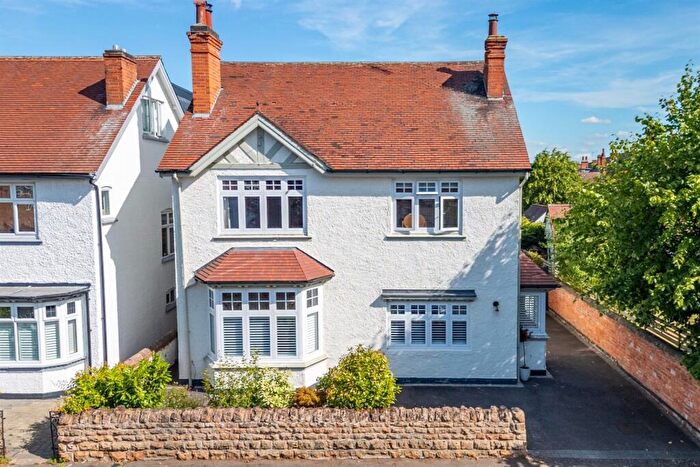
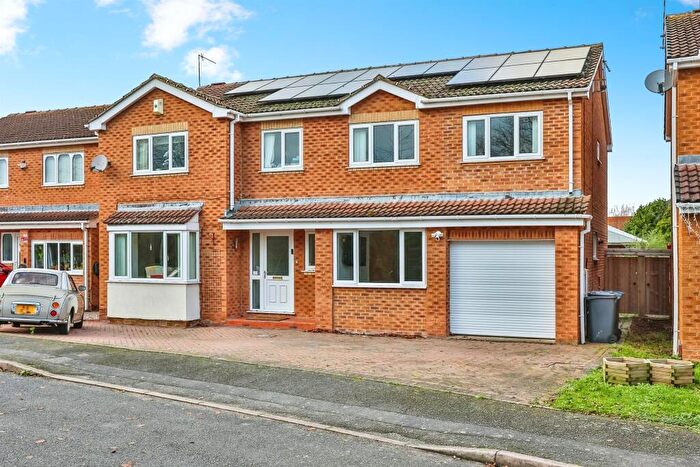
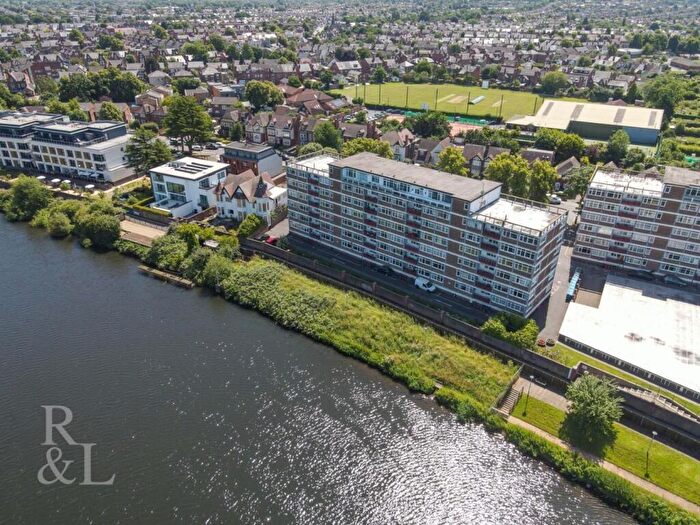
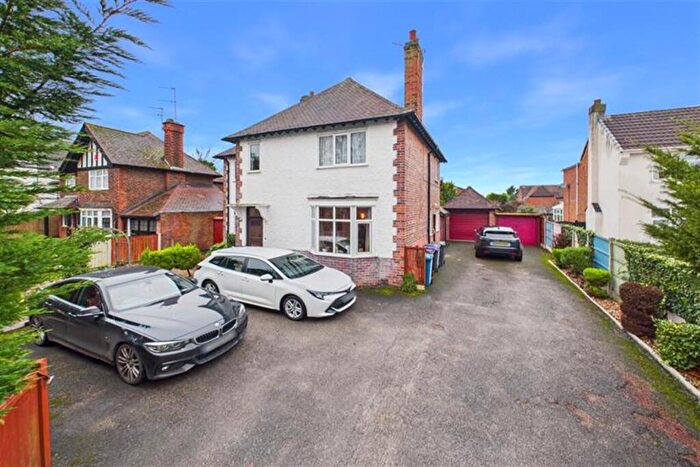
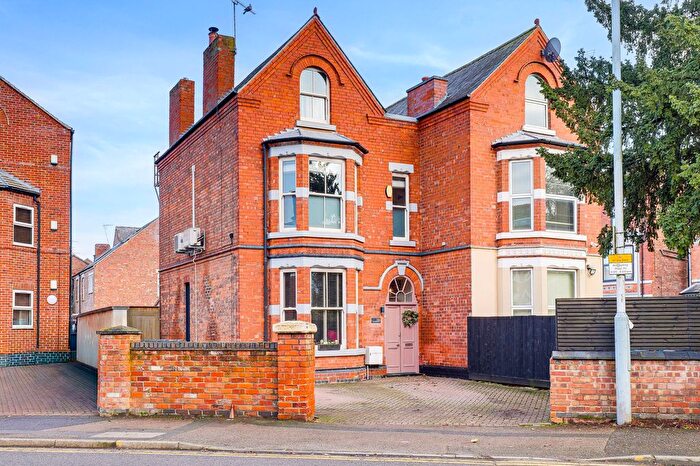
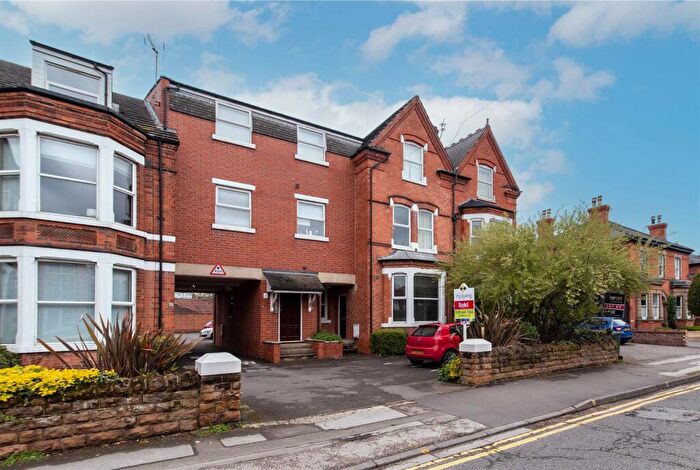
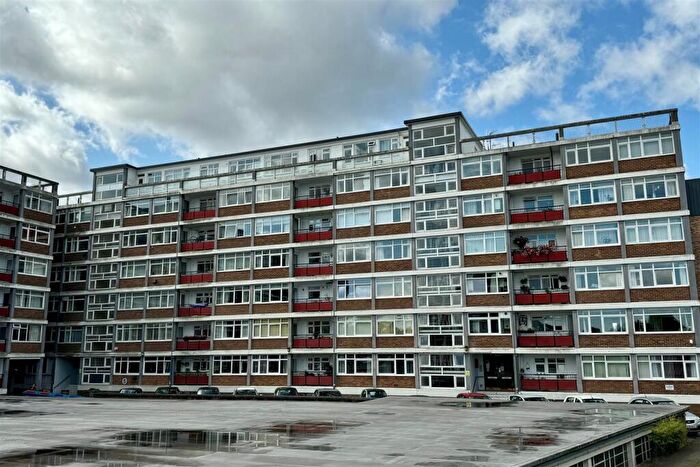
Properties for sale in Lutterell
Roads and Postcodes in Lutterell
Navigate through our locations to find the location of your next house in Lutterell, Nottingham for sale or to rent.
| Streets | Postcodes |
|---|---|
| A52 | NG11 6LP |
| Autumn Close | NG2 7YL |
| Beaumont Gardens | NG2 7FW |
| Boxley Drive | NG2 7GL NG2 7GN NG2 7GP NG2 7GQ NG2 7HA NG2 7HB |
| Branston Gardens | NG2 7FR |
| Burnside Road | NG2 7HU NG2 7HW |
| Canberra Crescent | NG2 7FL |
| Canberra Gardens | NG2 7FN |
| Carlyle Road | NG2 7PJ |
| Castle View | NG2 7RW |
| Cheshire Court | NG2 7BT |
| Churchview Court | NG2 7TY |
| Collington Way | NG2 7LR |
| Colston Crescent | NG2 7FT |
| Cropston Close | NG2 7FX |
| Denton Drive | NG2 7FS |
| East View | NG2 7QN |
| Edmonton Court | NG2 7EQ |
| Fairland Crescent | NG2 7FH |
| Giles Avenue | NG2 7JN |
| Greythorn Drive | NG2 7GA NG2 7GB NG2 7GD NG2 7GG NG2 7GH |
| Halberton Drive | NG2 7GU |
| Haven Close | NG2 7LP |
| Hussar Terrace | NG2 7JP |
| Ives Close | NG2 7LU |
| Kingswood Close | NG2 7HL |
| Kingswood Road | NG2 7HS NG2 7HT |
| Knights Close | NG2 7HJ |
| Lancelyn Gardens | NG2 7FG |
| Lansdowne Drive | NG2 7FJ |
| Laughton Avenue | NG2 7GJ |
| Loughborough Road | NG11 6LU NG2 7EE NG2 7FB NG2 7FD NG2 7HZ NG2 7JF NG2 7FA NG2 7FE NG2 7JA NG2 7JB NG2 7LB |
| Lutterell Court | NG2 7LN |
| Lyndhurst Gardens | NG2 7GW |
| Melrose Gardens | NG2 7FQ |
| Newton Drive | NG2 7LX |
| North Road | NG2 7NJ |
| Northwold Avenue | NG2 7JD NG2 7LQ |
| Oakham Road | NG11 6LT |
| Queensbury Avenue | NG2 7GE |
| Roecliffe | NG2 7FY |
| Rosewood Gardens | NG2 7HH |
| Rugby Road | NG2 7HX NG2 7HY |
| Spinney Hill | NG11 6LN |
| Spring Close | NG2 7YR |
| Springfields | NG2 7JL |
| Squires Way | NG2 7RR |
| Stanhome Court | NG2 7HD |
| Stanhome Drive | NG2 7FF NG2 7FP NG2 7FU |
| Stanhome Square | NG2 7GF |
| Stowe Avenue | NG2 7HP NG2 7HQ NG2 7HR |
| Summer Drive | NG2 7YJ |
| Swithland Drive | NG2 7FZ |
| Uppingham Crescent | NG2 7HN |
| Waddington Drive | NG2 7GT NG2 7GX |
| Walcote Drive | NG2 7GR NG2 7GS NG2 7GY NG2 7JQ NG2 7GZ |
| West Place Court | NG2 7PF |
| West View | NG2 7LS |
| Willwell Drive | NG2 7HG |
| Worwood Drive | NG2 7LY |
Transport near Lutterell
-
Nottingham Station
-
Beeston Station
-
Attenborough Station
-
Netherfield Station
-
Carlton Station
-
Radcliffe (Nottinghamshire) Station
- FAQ
- Price Paid By Year
- Property Type Price
Frequently asked questions about Lutterell
What is the average price for a property for sale in Lutterell?
The average price for a property for sale in Lutterell is £368,558. This amount is 31% higher than the average price in Nottingham. There are 606 property listings for sale in Lutterell.
What streets have the most expensive properties for sale in Lutterell?
The streets with the most expensive properties for sale in Lutterell are Edmonton Court at an average of £740,000, Loughborough Road at an average of £472,291 and Worwood Drive at an average of £462,500.
What streets have the most affordable properties for sale in Lutterell?
The streets with the most affordable properties for sale in Lutterell are Springfields at an average of £135,000, Giles Avenue at an average of £223,333 and Northwold Avenue at an average of £238,000.
Which train stations are available in or near Lutterell?
Some of the train stations available in or near Lutterell are Nottingham, Beeston and Attenborough.
Property Price Paid in Lutterell by Year
The average sold property price by year was:
| Year | Average Sold Price | Price Change |
Sold Properties
|
|---|---|---|---|
| 2025 | £363,471 | -2% |
53 Properties |
| 2024 | £372,213 | 1% |
66 Properties |
| 2023 | £369,031 | -2% |
60 Properties |
| 2022 | £378,001 | 9% |
69 Properties |
| 2021 | £342,473 | 19% |
105 Properties |
| 2020 | £278,457 | -4% |
59 Properties |
| 2019 | £290,067 | 4% |
90 Properties |
| 2018 | £277,066 | -3% |
92 Properties |
| 2017 | £286,086 | 4% |
83 Properties |
| 2016 | £274,148 | 9% |
64 Properties |
| 2015 | £250,450 | 7% |
73 Properties |
| 2014 | £232,621 | 13% |
69 Properties |
| 2013 | £202,561 | 4% |
59 Properties |
| 2012 | £194,703 | -6% |
45 Properties |
| 2011 | £206,584 | -6% |
63 Properties |
| 2010 | £218,016 | 15% |
46 Properties |
| 2009 | £184,948 | -5% |
77 Properties |
| 2008 | £194,060 | 1% |
38 Properties |
| 2007 | £192,780 | - |
81 Properties |
| 2006 | £192,856 | 3% |
90 Properties |
| 2005 | £187,256 | 1% |
64 Properties |
| 2004 | £185,949 | 10% |
84 Properties |
| 2003 | £168,005 | 12% |
67 Properties |
| 2002 | £147,744 | 21% |
104 Properties |
| 2001 | £116,364 | 15% |
89 Properties |
| 2000 | £98,416 | 12% |
75 Properties |
| 1999 | £86,380 | 4% |
79 Properties |
| 1998 | £82,752 | 11% |
72 Properties |
| 1997 | £73,861 | 6% |
97 Properties |
| 1996 | £69,420 | -10% |
63 Properties |
| 1995 | £76,430 | - |
46 Properties |
Property Price per Property Type in Lutterell
Here you can find historic sold price data in order to help with your property search.
The average Property Paid Price for specific property types in the last three years are:
| Property Type | Average Sold Price | Sold Properties |
|---|---|---|
| Semi Detached House | £356,195.00 | 23 Semi Detached Houses |
| Detached House | £405,703.00 | 123 Detached Houses |
| Terraced House | £261,573.00 | 26 Terraced Houses |
| Flat | £153,857.00 | 7 Flats |

