Houses for sale & to rent in Clayworth, Retford
House Prices in Clayworth
Properties in Clayworth have an average house price of £306,328.00 and had 61 Property Transactions within the last 3 years¹.
Clayworth is an area in Retford, Nottinghamshire with 781 households², where the most expensive property was sold for £1,060,000.00.
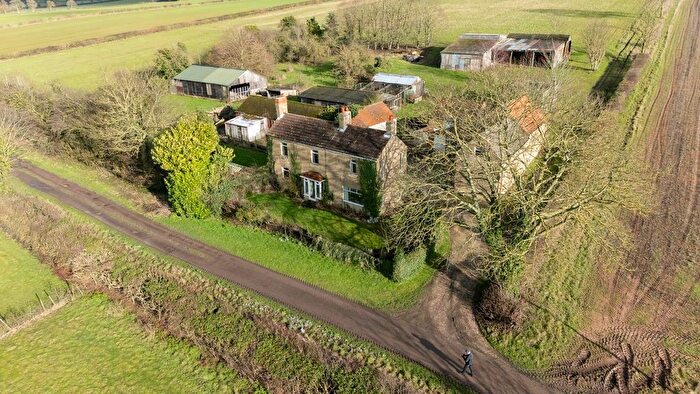
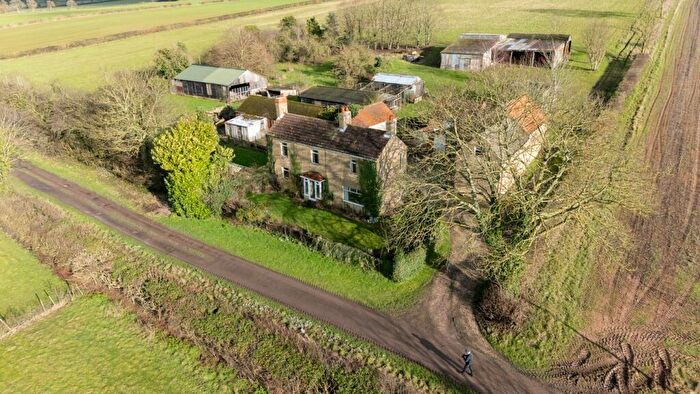
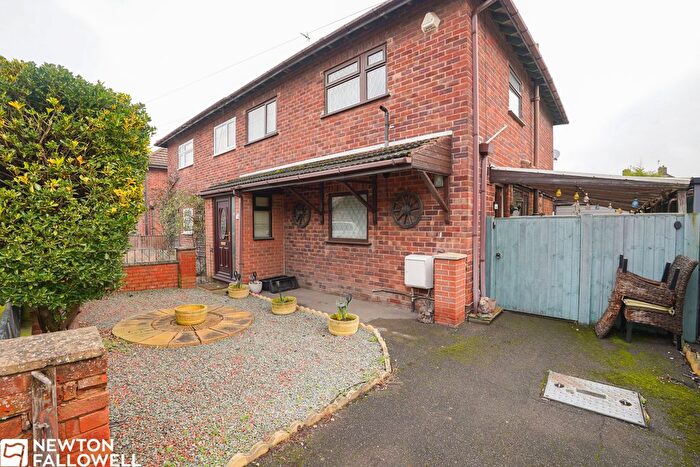
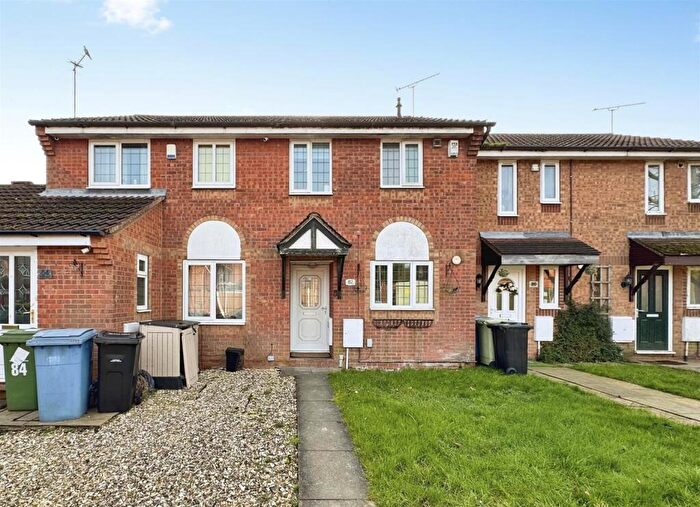
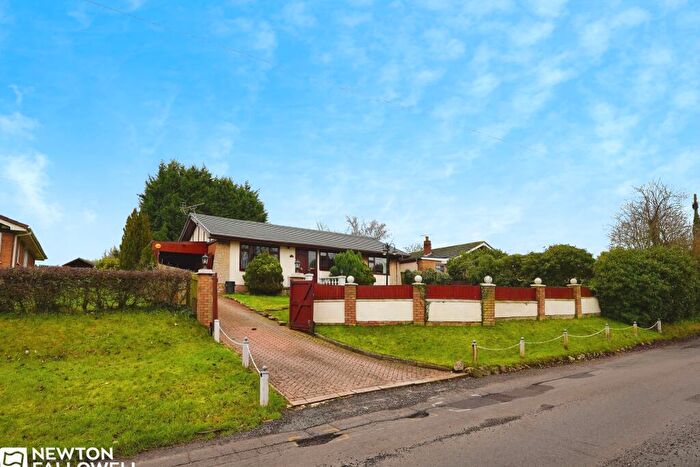
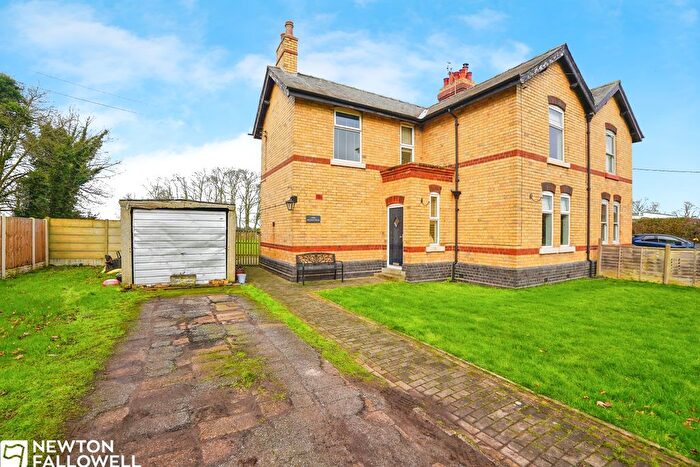
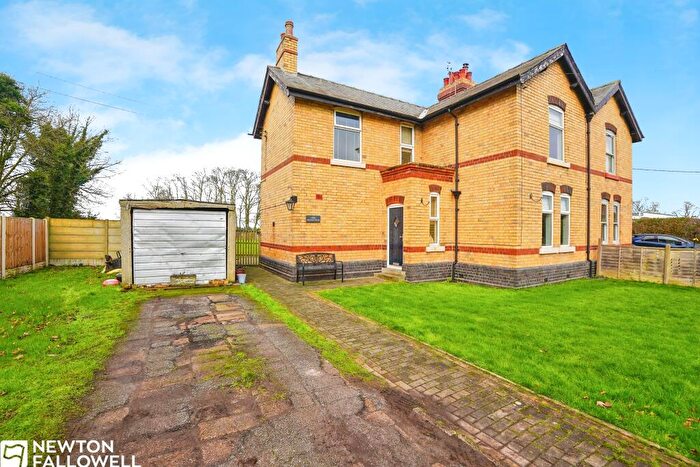
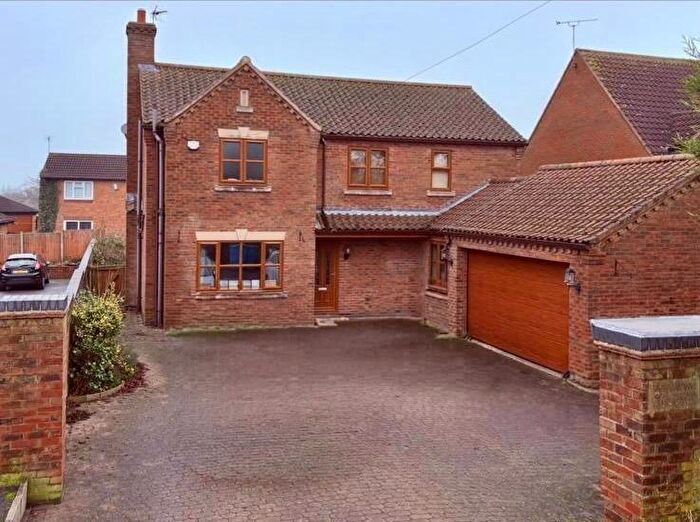
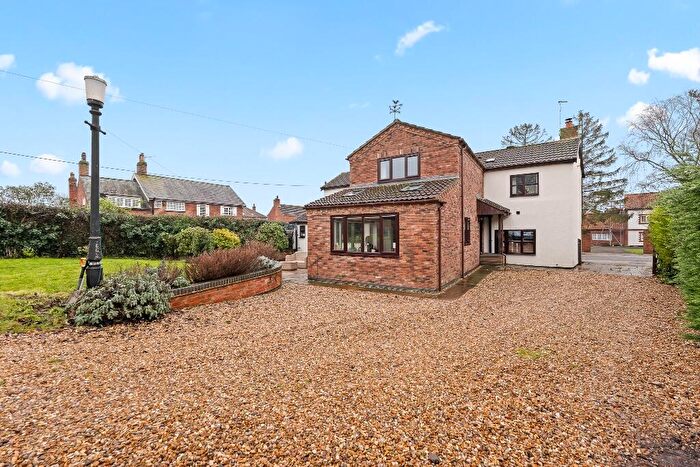
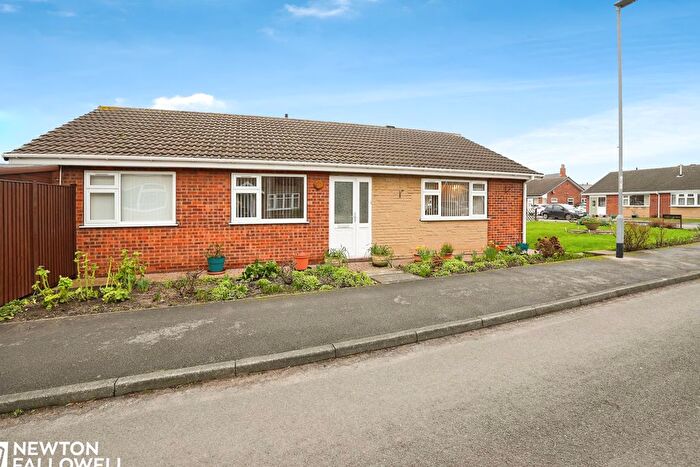
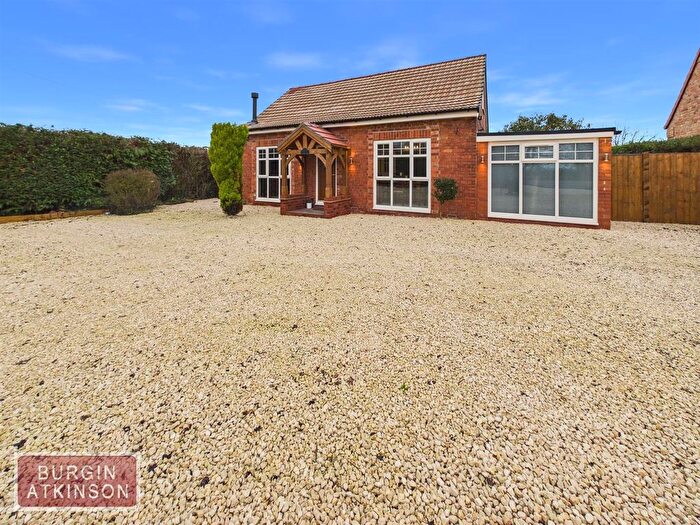
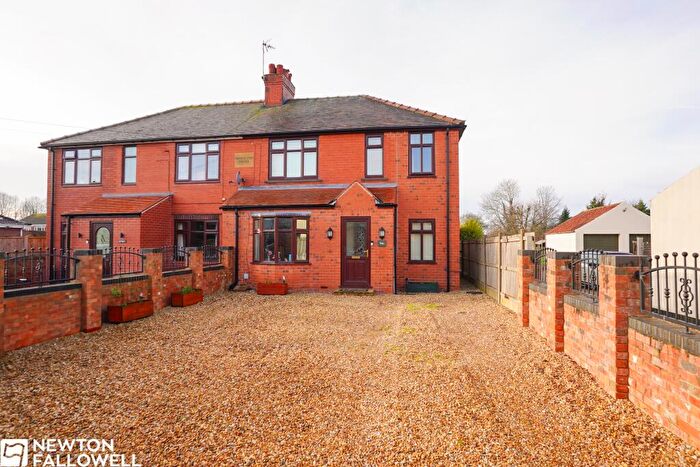
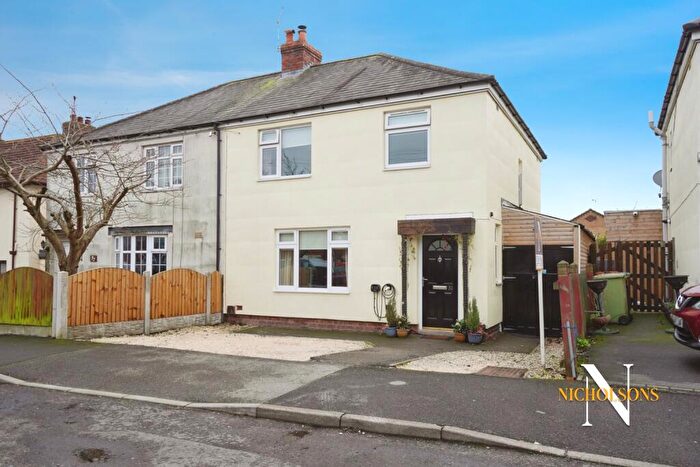
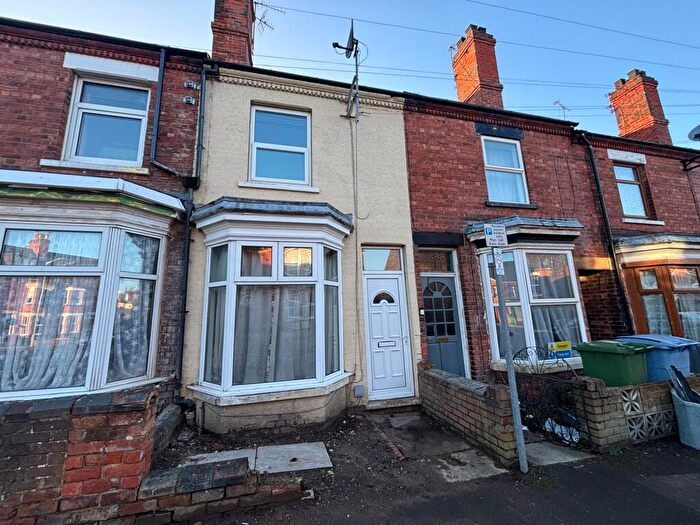
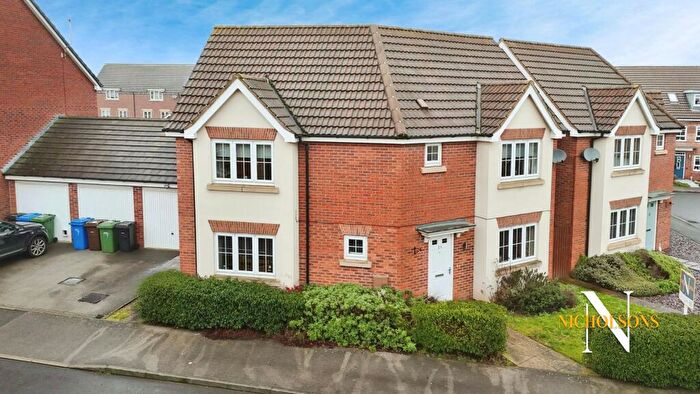
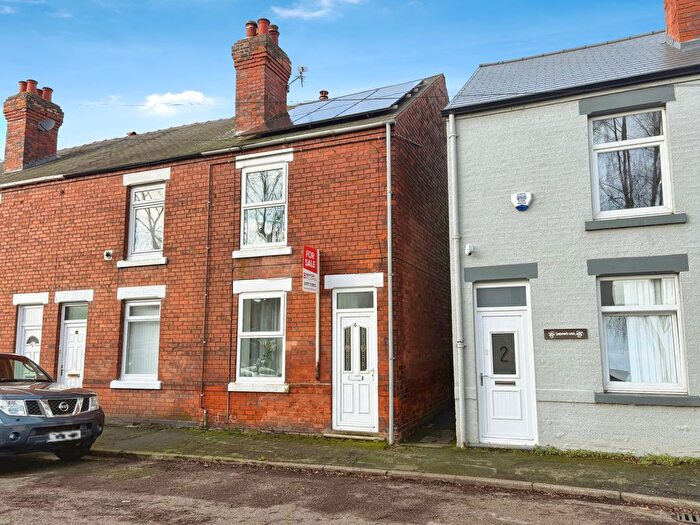
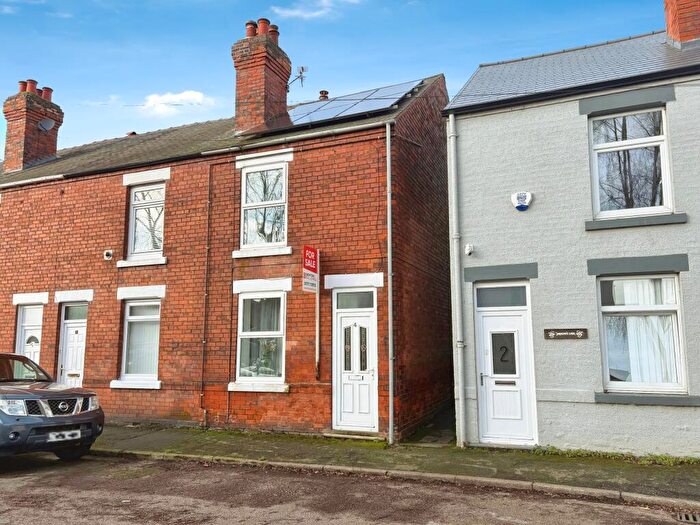
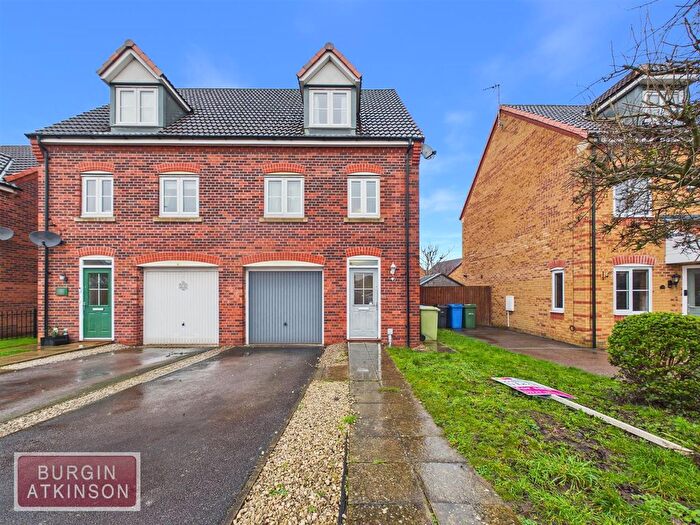
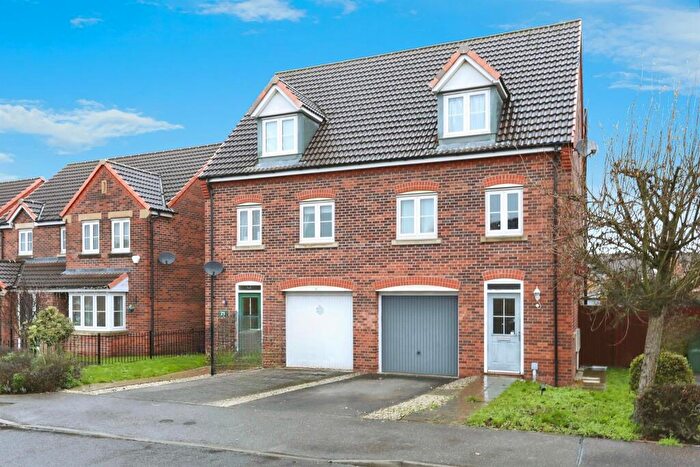
Properties for sale in Clayworth
Roads and Postcodes in Clayworth
Navigate through our locations to find the location of your next house in Clayworth, Retford for sale or to rent.
| Streets | Postcodes |
|---|---|
| Big Lane | DN22 9LT DN22 9LU DN22 9LX DN22 9LY |
| Bone Mill Lane | DN22 9NL |
| Broad Gores | DN22 9JR DN22 9JX |
| Celery Meadows | DN22 9AX |
| Chambers Gardens | DN22 9AE |
| Chapel Close | DN22 9LP |
| Church Lane | DN22 9AN DN22 9LD DN22 9LE DN22 9NA DN22 9ND DN22 9NG DN22 9NQ DN22 9NB DN22 9NE |
| Clayworth Common | DN22 9BA |
| Gill Green Walk | DN22 9JP |
| Gringley Road | DN22 9BE |
| Hall Drive | DN22 9AF |
| Hill View Crescent | DN22 9JZ |
| Howbeck Lane | DN22 9LW |
| Kings Arms Yard | DN22 9EE |
| Leverton Road | DN22 0DT DN22 0DZ |
| Little Gringley Lane | DN22 0SD DN22 0SE DN22 0SG |
| Little Lane | DN22 9LR |
| Main Street | DN22 0SH DN22 0SJ DN22 9LA DN22 9LF DN22 9LH DN22 9LL DN22 9LN DN22 9LS DN22 9NH DN22 9LZ DN22 9NJ |
| Mill Lane | DN22 9AG |
| Millers Court | DN22 9GA |
| Pear Tree Close | DN22 9NP |
| Pinfold Lane | DN22 0SQ |
| Plumtree Close | DN22 9TT |
| Rectory Grounds | DN22 9LB |
| Retford Road | DN22 9AJ |
| Smeath Lane | DN22 9JN DN22 9JS DN22 9JT DN22 9JU DN22 9JW |
| South View Drive | DN22 9JY |
| St Johns Drive | DN22 9NN |
| St Peters Lane | DN22 9AA |
| The Beck | DN22 9AH |
| The Cottages | DN22 9AQ |
| The Grange Barns | DN22 9AS |
| The Orchard | DN22 9LJ |
| Town Street | DN22 9AD |
| Welham Road | DN22 0SA |
| Wheatley Road | DN22 9AL |
| Wiseton Road | DN22 9AB |
| DN22 0SB DN22 0SF DN22 9BB DN22 9JH DN22 9LG DN22 9AW DN22 9DZ DN22 9EA DN22 9LQ |
Transport near Clayworth
- FAQ
- Price Paid By Year
- Property Type Price
Frequently asked questions about Clayworth
What is the average price for a property for sale in Clayworth?
The average price for a property for sale in Clayworth is £306,328. This amount is 35% higher than the average price in Retford. There are 2,414 property listings for sale in Clayworth.
What streets have the most expensive properties for sale in Clayworth?
The streets with the most expensive properties for sale in Clayworth are Hall Drive at an average of £475,000, Main Street at an average of £411,285 and Church Lane at an average of £405,600.
What streets have the most affordable properties for sale in Clayworth?
The streets with the most affordable properties for sale in Clayworth are Pear Tree Close at an average of £128,000, Gill Green Walk at an average of £131,400 and Smeath Lane at an average of £169,285.
Which train stations are available in or near Clayworth?
Some of the train stations available in or near Clayworth are Retford, Gainsborough Lea Road and Gainsborough Central.
Property Price Paid in Clayworth by Year
The average sold property price by year was:
| Year | Average Sold Price | Price Change |
Sold Properties
|
|---|---|---|---|
| 2025 | £375,933 | 32% |
11 Properties |
| 2024 | £254,080 | -29% |
25 Properties |
| 2023 | £327,951 | 7% |
25 Properties |
| 2022 | £305,189 | -0,5% |
27 Properties |
| 2021 | £306,625 | 14% |
40 Properties |
| 2020 | £262,800 | 7% |
25 Properties |
| 2019 | £244,437 | 16% |
24 Properties |
| 2018 | £204,352 | 11% |
34 Properties |
| 2017 | £181,475 | -29% |
22 Properties |
| 2016 | £233,581 | -4% |
36 Properties |
| 2015 | £242,961 | 10% |
29 Properties |
| 2014 | £219,150 | -12% |
27 Properties |
| 2013 | £244,728 | 31% |
37 Properties |
| 2012 | £168,886 | -31% |
18 Properties |
| 2011 | £220,944 | -5% |
19 Properties |
| 2010 | £231,647 | -3% |
20 Properties |
| 2009 | £238,114 | 22% |
24 Properties |
| 2008 | £185,775 | -4% |
20 Properties |
| 2007 | £192,895 | -0,1% |
30 Properties |
| 2006 | £193,088 | -1% |
28 Properties |
| 2005 | £195,130 | 4% |
23 Properties |
| 2004 | £188,050 | 16% |
35 Properties |
| 2003 | £157,497 | 9% |
36 Properties |
| 2002 | £143,404 | 21% |
34 Properties |
| 2001 | £112,832 | 33% |
34 Properties |
| 2000 | £75,844 | -17% |
35 Properties |
| 1999 | £88,915 | 11% |
34 Properties |
| 1998 | £79,429 | 18% |
22 Properties |
| 1997 | £65,435 | -10% |
24 Properties |
| 1996 | £72,208 | -1% |
27 Properties |
| 1995 | £72,934 | - |
23 Properties |
Property Price per Property Type in Clayworth
Here you can find historic sold price data in order to help with your property search.
The average Property Paid Price for specific property types in the last three years are:
| Property Type | Average Sold Price | Sold Properties |
|---|---|---|
| Semi Detached House | £212,592.00 | 17 Semi Detached Houses |
| Detached House | £387,160.00 | 34 Detached Houses |
| Terraced House | £190,850.00 | 10 Terraced Houses |

