Houses for sale & to rent in East Retford South, Retford
House Prices in East Retford South
Properties in East Retford South have an average house price of £189,099.00 and had 261 Property Transactions within the last 3 years¹.
East Retford South is an area in Retford, Nottinghamshire with 1,873 households², where the most expensive property was sold for £600,000.00.
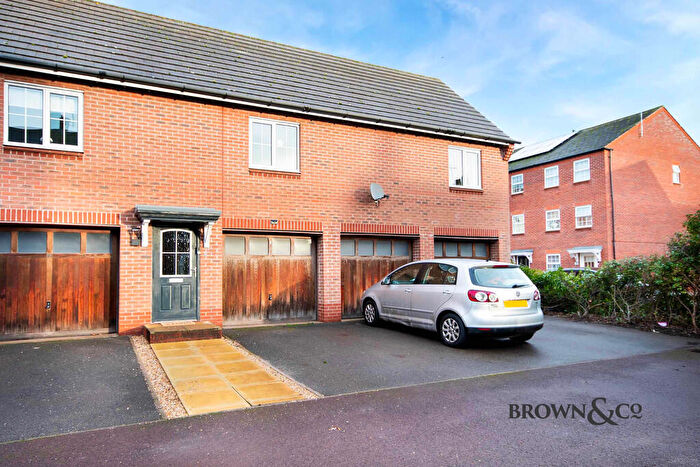
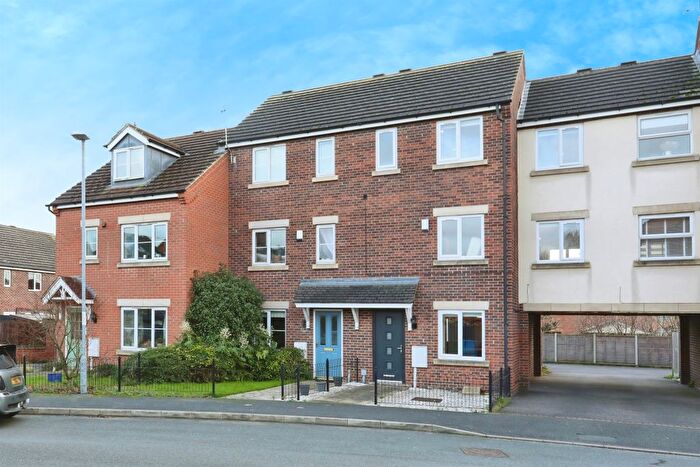
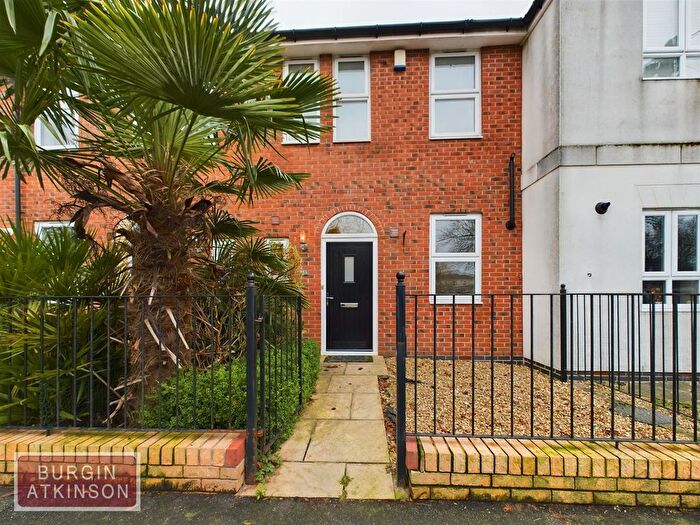
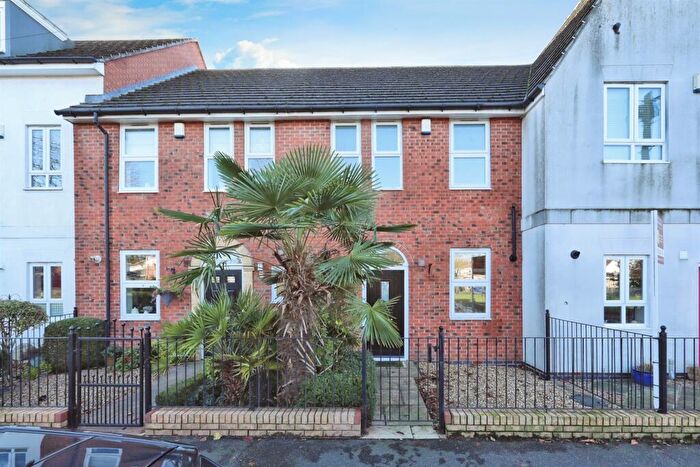
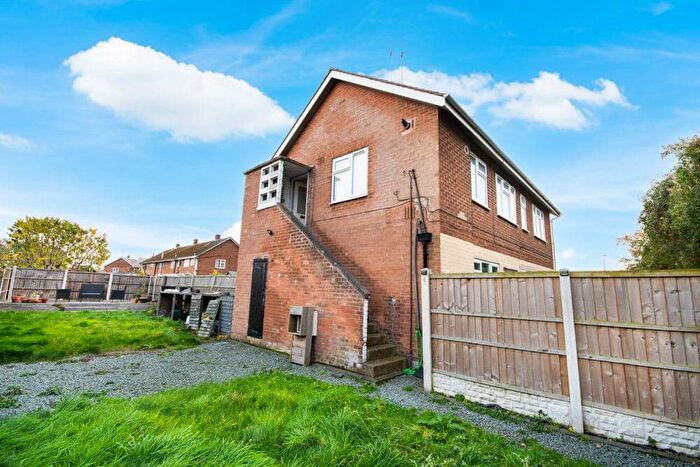
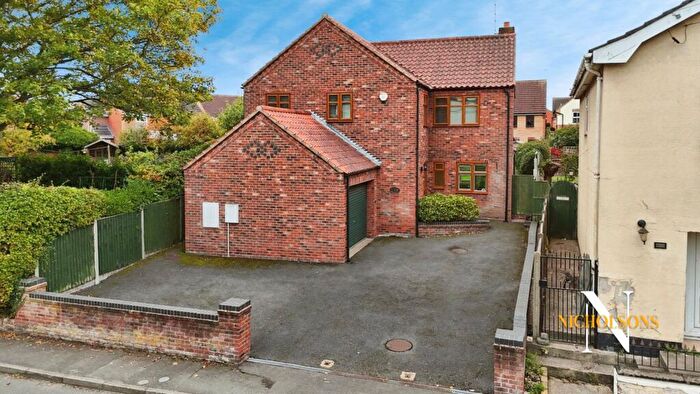
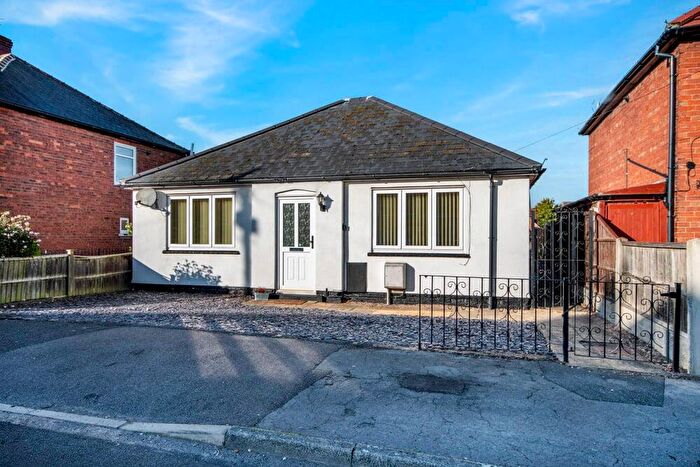
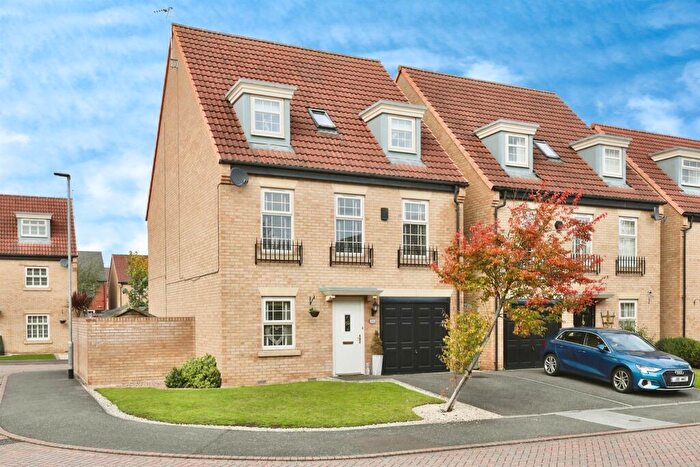
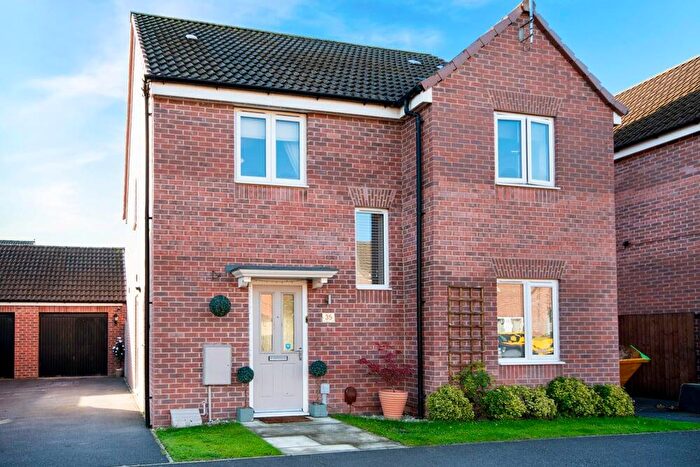
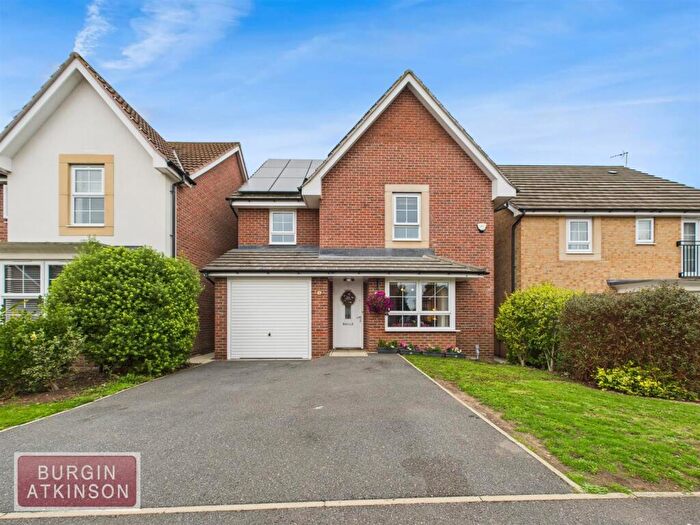
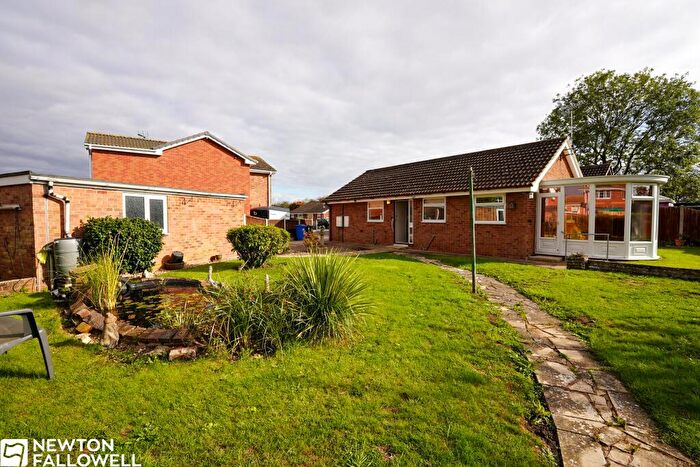
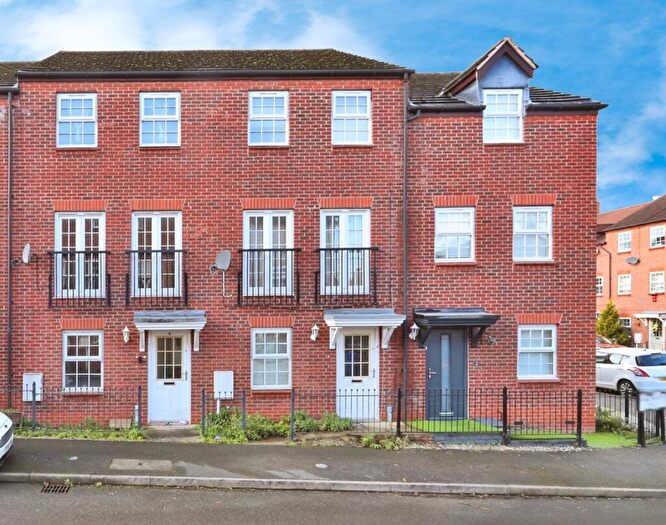
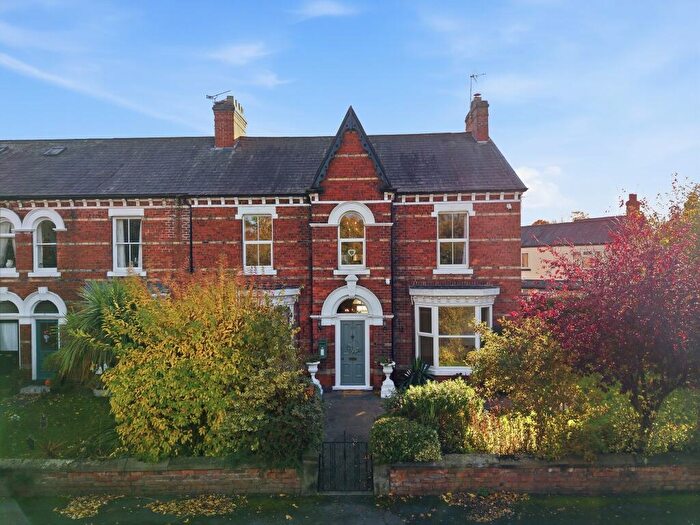
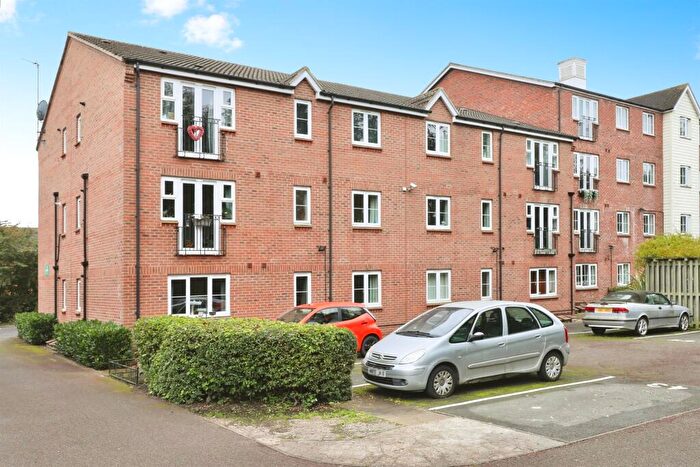
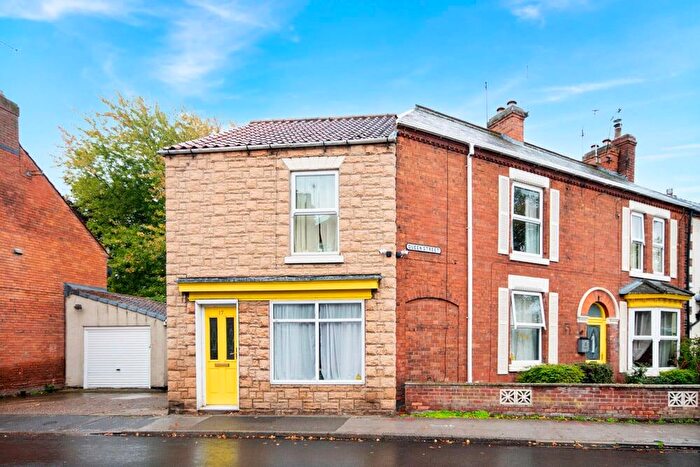
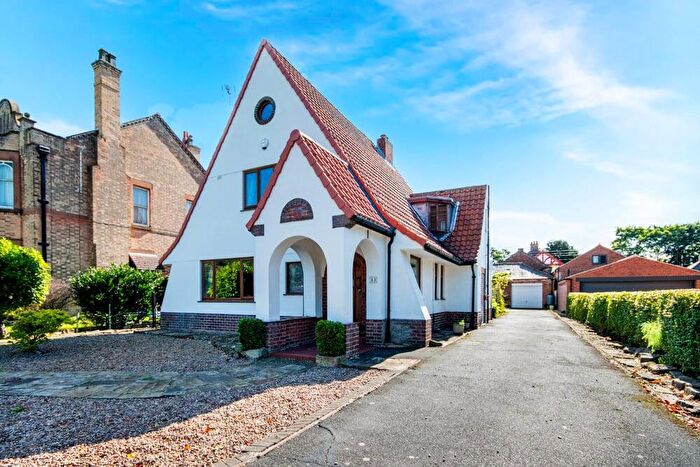
Properties for sale in East Retford South
Roads and Postcodes in East Retford South
Navigate through our locations to find the location of your next house in East Retford South, Retford for sale or to rent.
| Streets | Postcodes |
|---|---|
| Ainsdale Green | DN22 7NQ |
| All Hallows Close | DN22 7UP |
| All Hallows Street | DN22 7TS DN22 7TR |
| All Hallows View | DN22 7US |
| Arum Croft | DN22 7FZ |
| Ash Croft | DN22 7FB |
| Ashford Court | DN22 7GH |
| Bankside | DN22 7UR DN22 7UW |
| Beechways | DN22 7RL |
| Birkdale Grove | DN22 7DS |
| Black Hereford Way | DN22 7ZQ DN22 7ZT |
| Blandford Drive | DN22 7FS |
| Blue Albion Street | DN22 7WZ |
| Brecks Road | DN22 7UA DN22 7UB |
| Briar Lea | DN22 7RZ |
| Bridon Close | DN22 7WN |
| Broadleigh Court | DN22 7GP |
| Canterbury Close | DN22 7TN DN22 7WG |
| Century Road | DN22 7TD |
| Chelmsford Mews | DN22 7ER |
| Chestnut Avenue | DN22 7RN |
| Cheyne Walk | DN22 7GA |
| Chidmere | DN22 7FX |
| Church Lane | DN22 7TU |
| Dale Close | DN22 7UN |
| Eden Court | DN22 7WW |
| Edgbaston Drive | DN22 7HN |
| Fairway | DN22 7SQ |
| Farfield | DN22 7TL |
| Farm View | DN22 7UJ DN22 7UT |
| Forest View | DN22 7UD |
| Glen Eagles Way | DN22 7DP |
| Goosemoor Lane | DN22 7TT |
| Grace Road | DN22 7GZ |
| Grange Road | DN22 7UQ |
| Greenway | DN22 7RX |
| Harlow Terrace | DN22 7TB |
| Hawthorne Court | DN22 7WH |
| Headingley Road | DN22 7EE |
| High Street | DN22 7TY DN22 7TZ |
| Hillview | DN22 7FW |
| Hine Close | DN22 7ZH |
| Hove Chase | DN22 7WE |
| Kingsmead | DN22 7FD |
| Lansdown Drive | DN22 7WY |
| Lansdowne Court | DN22 7GL |
| Lincoln Red Close | DN22 7ZE |
| Lindrick Court | DN22 7NF |
| Lockwood Drive | DN22 7PU |
| Lords Court | DN22 7WL |
| Lyncombe Court | DN22 7FY |
| Millfield Close | DN22 7TW |
| Newlands | DN22 7FA |
| Ollerton Road | DN22 7DW DN22 7JQ DN22 7TE DN22 7TF DN22 7TH DN22 7TJ DN22 7TQ DN22 7UE DN22 7UG DN22 7FE DN22 7UF |
| Ordsall Road | DN22 7SJ DN22 7SL |
| Oxton Close | DN22 7WR |
| Plough Inn Court | DN22 7ZP |
| River View | DN22 7UL DN22 7UU |
| Rose Bowl Gardens | DN22 7WA |
| Rose Lea | DN22 7SB |
| Rufford Avenue | DN22 7RU DN22 7RY |
| Sedgemere | DN22 7FT |
| Sherwood Road | DN22 7UH |
| Southgate | DN22 7NS |
| St Andrews Way | DN22 7WU |
| Sunningdale | DN22 7NH |
| Sycamore Court | DN22 7WJ |
| Taunton Way | DN22 7HS |
| The Laurels | DN22 7TP DN22 7ZG |
| The Old Gardens | DN22 7ZR |
| The Oval | DN22 7SA DN22 7SD DN22 7SE DN22 7SF |
| Thoresby Way | DN22 7WS |
| Torksey Mews | DN22 7ND |
| Trent Bridge Road | DN22 7SR DN22 7ZL |
| Troon Court | DN22 7DR |
| Tunnel Road | DN22 7TA |
| Welbeck Road | DN22 7RP DN22 7RW |
| Wentworth Close | DN22 7NG |
| West Hill Road | DN22 7RR DN22 7RS DN22 7RT DN22 7SG DN22 7SH |
| Wharncliffe Road | DN22 7RH DN22 7RJ |
| Whitcombe Court | DN22 7GN |
| White Park Place | DN22 7ZB |
| Woburn Grove | DN22 7WX |
| Wollaton Rise | DN22 7WT |
| Woodhall Green | DN22 7DN |
| DN22 7FR DN22 7FU |
Transport near East Retford South
-
Retford Station
-
Worksop Station
-
Shireoaks Station
-
Gainsborough Lea Road Station
-
Gainsborough Central Station
- FAQ
- Price Paid By Year
- Property Type Price
Frequently asked questions about East Retford South
What is the average price for a property for sale in East Retford South?
The average price for a property for sale in East Retford South is £189,099. This amount is 17% lower than the average price in Retford. There are 971 property listings for sale in East Retford South.
What streets have the most expensive properties for sale in East Retford South?
The streets with the most expensive properties for sale in East Retford South are Southgate at an average of £466,666, The Old Gardens at an average of £405,000 and Rose Bowl Gardens at an average of £355,000.
What streets have the most affordable properties for sale in East Retford South?
The streets with the most affordable properties for sale in East Retford South are Brecks Road at an average of £107,250, Millfield Close at an average of £118,000 and Ashford Court at an average of £118,500.
Which train stations are available in or near East Retford South?
Some of the train stations available in or near East Retford South are Retford, Worksop and Shireoaks.
Property Price Paid in East Retford South by Year
The average sold property price by year was:
| Year | Average Sold Price | Price Change |
Sold Properties
|
|---|---|---|---|
| 2025 | £190,733 | -3% |
42 Properties |
| 2024 | £196,431 | 10% |
73 Properties |
| 2023 | £176,265 | -9% |
69 Properties |
| 2022 | £192,758 | -3% |
77 Properties |
| 2021 | £197,831 | 20% |
98 Properties |
| 2020 | £158,747 | -12% |
85 Properties |
| 2019 | £177,080 | -3% |
99 Properties |
| 2018 | £182,899 | 8% |
97 Properties |
| 2017 | £168,936 | 5% |
114 Properties |
| 2016 | £159,798 | -3% |
118 Properties |
| 2015 | £164,584 | 16% |
116 Properties |
| 2014 | £137,703 | - |
92 Properties |
| 2013 | £137,739 | -2% |
93 Properties |
| 2012 | £140,963 | -3% |
61 Properties |
| 2011 | £145,438 | 10% |
72 Properties |
| 2010 | £131,046 | -12% |
50 Properties |
| 2009 | £146,316 | 16% |
33 Properties |
| 2008 | £123,412 | -4% |
37 Properties |
| 2007 | £128,438 | -2% |
80 Properties |
| 2006 | £131,401 | -15% |
80 Properties |
| 2005 | £151,456 | 20% |
65 Properties |
| 2004 | £121,320 | 28% |
85 Properties |
| 2003 | £87,171 | 17% |
71 Properties |
| 2002 | £72,300 | 22% |
74 Properties |
| 2001 | £56,510 | 4% |
91 Properties |
| 2000 | £54,484 | -4% |
79 Properties |
| 1999 | £56,713 | 3% |
101 Properties |
| 1998 | £54,925 | 8% |
80 Properties |
| 1997 | £50,448 | 3% |
66 Properties |
| 1996 | £49,115 | 7% |
58 Properties |
| 1995 | £45,474 | - |
63 Properties |
Property Price per Property Type in East Retford South
Here you can find historic sold price data in order to help with your property search.
The average Property Paid Price for specific property types in the last three years are:
| Property Type | Average Sold Price | Sold Properties |
|---|---|---|
| Semi Detached House | £152,813.00 | 92 Semi Detached Houses |
| Detached House | £275,872.00 | 86 Detached Houses |
| Terraced House | £143,463.00 | 77 Terraced Houses |
| Flat | £87,416.00 | 6 Flats |

