
Houses for sale & to rent in Chadderton South, Oldham
House Prices in Chadderton South
Properties in Chadderton South have an average house price of £175k and had 449 Property Transactions within the last 3 years¹.
Chadderton South is an area in Oldham, Oldham with 4,653 households², where the most expensive property was sold for £326k.
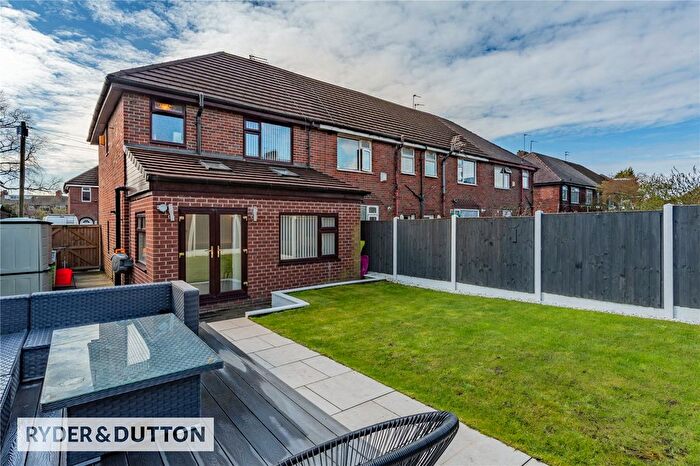
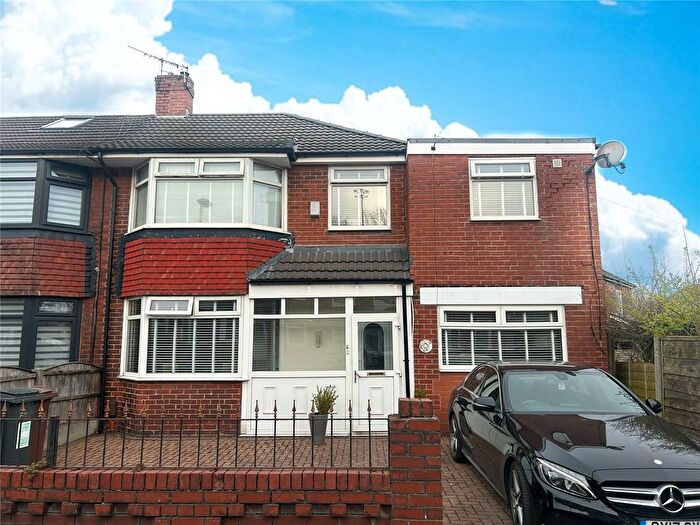
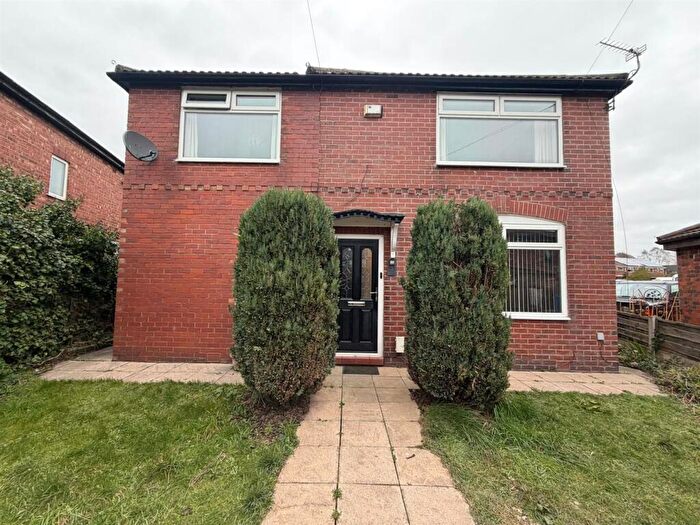
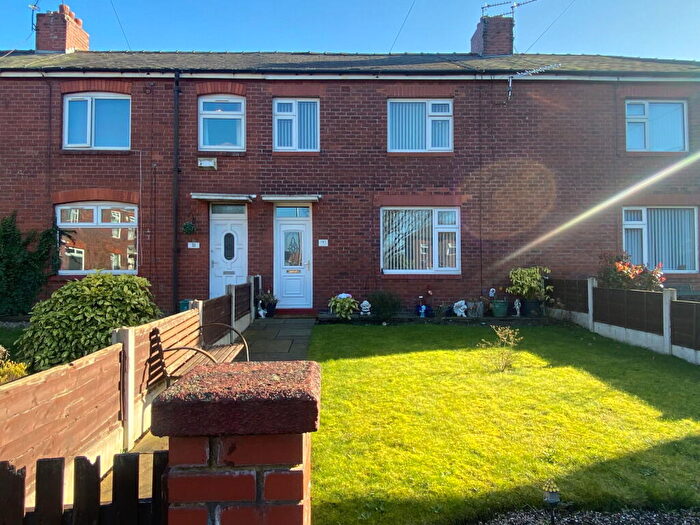
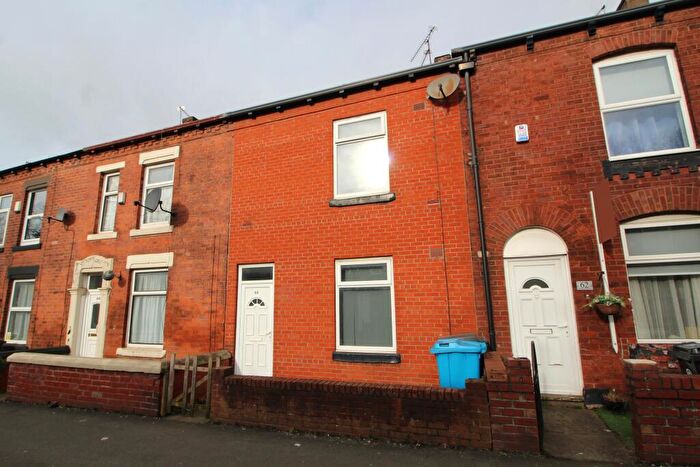
Properties for sale in Chadderton South
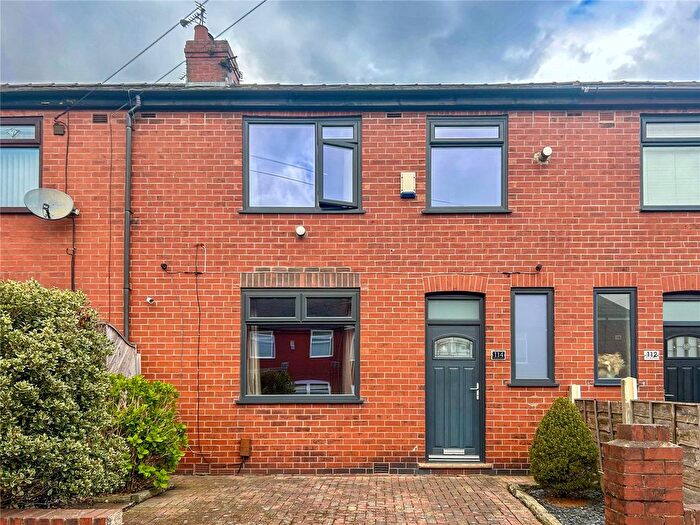
![]()
If you are looking to sell your house, let it out, or receive a property valuation, an expert can help you.
Click the button below to get started.

Roads and Postcodes in Chadderton South
Navigate through our locations to find the location of your next house in Chadderton South, Oldham for sale or to rent.
| Streets | Postcodes |
|---|---|
| Abbey Grove | OL9 8RJ |
| Abingdon Close | OL9 7JF |
| Albert Street | OL9 7EP OL9 7HB OL9 7HD OL9 7HG OL9 7TS |
| Alcester Street | OL9 8LD |
| Arden Street | OL9 8JD OL9 8LA |
| Argyll Road | OL9 8AJ OL9 8AL |
| Ashton Crescent | OL9 8HE |
| Ashworth Close | OL9 7JA |
| Atherley Grove | OL9 8DD |
| Bank Mill Close | OL9 9GF |
| Bardsley Street | OL9 8HG |
| Berkeley Avenue | OL9 8BL |
| Bickerton Court | OL9 7ET |
| Birchenlea Street | OL9 8HA |
| Bowling Green Close | OL9 8LU |
| Broadway | OL9 8AP OL9 8DN OL9 8DW OL9 8RN OL9 9NF OL9 9NH OL9 9NJ OL9 9NR OL9 9NS OL9 9PY OL9 9QP OL9 8AU |
| Bromley Street | OL9 8HD |
| Brown Hill Grove | OL9 9GJ |
| Butler Green | OL9 8NQ |
| Butterworth Lane | OL9 8DX OL9 8DY OL9 8DZ OL9 8EB OL9 8ED |
| Canal Street | OL9 7JR OL9 7HH |
| Carrington Street | OL9 7PE |
| Cartmel Crescent | OL9 8BZ OL9 8DA |
| Chesney Avenue | OL9 8DR |
| Chestnut Street | OL9 8HB OL9 8HF OL9 8HH |
| Coalshaw Green Road | OL9 8JP OL9 8JR OL9 8JS OL9 8JT OL9 8JW |
| Crescent Road | OL9 8DS |
| Cromarty Avenue | OL9 8AW |
| Derby Street | OL9 7HJ OL9 7HX OL9 7HZ |
| Dover Street | OL9 7EW |
| Drury Lane | OL9 8EU OL9 8EY |
| Dunster Close | OL9 8BS OL9 8DJ |
| Eaves Lane | OL9 8RG OL9 8RQ |
| Edgeware Road | OL9 9PU |
| Eli Street | OL9 8HZ |
| Elizabeth Avenue | OL9 8LY |
| Engine Street | OL9 7JG |
| Fields New Road | OL9 8BP OL9 8BT |
| Fife Avenue | OL9 8AG |
| Foxdenton Lane | OL9 9FN |
| Glebe Street | OL9 8HY OL9 8JE |
| Glenham Way | OL9 8BW |
| Goodwin Court | OL9 7HP |
| Gordon Avenue | OL9 8LB |
| Gordon Street | OL9 9QE |
| Granby Street | OL9 8EG OL9 8EX |
| Green Pastures Way | OL9 9GG |
| Green Vale Close | OL9 7FE |
| Halsey Close | OL9 8DU |
| Hardman Street | OL9 7HE OL9 7PB OL9 7PD |
| Hazelhurst Mews | OL9 8BN |
| Henley Street | OL9 8JU OL9 8JX OL9 8JY OL9 8JZ |
| Henrietta Court | OL9 9FS |
| Henshaw Lane | OL9 8RU |
| Higher House Close | OL9 8LP OL9 8LR OL9 8LW |
| Hollingworth Street | OL9 7EY |
| Hollinwood Avenue | OL9 8DE OL9 8DF OL9 8DG OL9 8DQ OL9 9NG OL9 9NQ OL9 8EE OL9 8EF OL9 8EP |
| Houseley Avenue | OL9 8HX |
| Junction 22 Business Park | OL9 8EH |
| Kershaw Drive | OL9 9PN |
| Kings Road | OL9 9PP |
| Kingston Avenue | OL9 8LF OL9 8LL |
| Kirby Avenue | OL9 9PF |
| Lancaster Street | OL9 8LE |
| Leslie Avenue | OL9 7HF |
| Little Cot Close | OL9 7HR |
| Long Lane | OL9 8AY OL9 8AZ OL9 8BA |
| Lurden Walk | OL9 8PZ |
| Manchester Road | OL9 7EL OL9 7PG OL9 7PQ |
| Matthew Fold Way | OL9 9GE |
| Meadow Field Drive | OL9 9GN |
| Meadway | OL9 8DP |
| Mellor Way | OL9 8NN |
| Melrose Court | OL9 8NW |
| Merton Grove | OL9 9PQ |
| Moor Farm Close | OL9 9GL |
| Moray Road | OL9 8AE |
| Moston Lane East | M40 3HZ |
| Mough Lane | OL9 9NT OL9 9PJ OL9 9PL |
| Nelson Way | OL9 8NL |
| Old Lane | OL9 7ER OL9 7JB OL9 7JD OL9 7JQ |
| Oriel Close | OL9 8RL |
| Owler Lane | OL9 9PA OL9 9PB |
| Perth Avenue | OL9 8AF |
| Princess Road | OL9 9PR |
| Priory Grove | OL9 8RH |
| Ravenside Park | OL9 8PA |
| Raymond Avenue | OL9 7HW OL9 7JN |
| Regatta Close | OL9 8JQ |
| Richmond Avenue | OL9 8LG OL9 8LH OL9 8LQ |
| Rose Street | OL9 8ER OL9 8ES |
| Ross Avenue | OL9 8AN |
| Rupert Court | OL9 9FT |
| Ruskin Avenue | OL9 8HT |
| Ryecroft Close | OL9 8AT |
| Scholes Street | OL9 8LN |
| Selkirk Road | OL9 8AA OL9 8AB OL9 8AD |
| Shelley Road | OL9 8HS OL9 8HU |
| Shillingford Road | OL9 8BD |
| Shirley Avenue | OL9 8DH |
| Simpson Street | OL9 7JJ |
| Southgate Road | OL9 9PT |
| Spencer Street | OL9 7JE |
| St Georges Square | OL9 9NX OL9 9NY OL9 9NZ OL9 9NU |
| Stanley Road | OL9 7EX OL9 7HA OL9 7HS OL9 7HT OL9 7QE |
| Stanton Street | OL9 7EZ |
| Stirling Road | OL9 8AQ |
| Stott Road | OL9 9PX |
| Summercroft | OL9 7JP OL9 7JW |
| Sycamore Avenue | OL9 8BB OL9 8BQ |
| Teasdale Close | OL9 8AS |
| Thompson Lane | OL9 8LT OL9 8LX |
| Thorley Close | OL9 8DT |
| Top O Th Green | OL9 7HL |
| Tudor Avenue | OL9 9PG |
| Turf Lane | OL9 8HL OL9 8HN OL9 8HP OL9 8HR OL9 8HW |
| Tweedale Way | OL9 7HU OL9 7LD |
| Vine Street | OL9 7PA |
| Walker Road | OL9 8BY OL9 8DB |
| Wallis Street | OL9 8NG |
| Washbrook | OL9 8JL OL9 8JN |
| Welbeck Avenue | OL9 9PD OL9 9PE |
| Wharf Street | OL9 7HQ OL9 7PF |
| Whitegate Avenue | OL9 8AH |
| Whitegate Lane | OL9 8LS OL9 8RP |
| Whitegate Road | OL9 9PW |
| Whiteley Street | OL9 7HY OL9 7QD |
| Williams Crescent | OL9 8BH OL9 8BJ |
| Wilton Street | OL9 7NY OL9 7NZ |
| Windsor Avenue | OL9 8LJ |
| OL9 7FF OL9 8EQ OL9 9XQ |
Transport near Chadderton South
-
 Moston Station
 -
Mills Hill Station
-
Ashton-Under-Lyne Station
-
Fairfield Station
-
Guide Bridge Station
-
Gorton Station
-
Ashburys Station
-
Mossley (Greater Manchester) Station
-
Belle Vue Station
-
Castleton Station
- FAQ
- Price Paid By Year
- Property Type Price
Frequently asked questions about Chadderton South
What is the average price for a property for sale in Chadderton South?
The average price for a property for sale in Chadderton South is £174,958. This amount is 15% lower than the average price in Oldham. There are 1,123 property listings for sale in Chadderton South.
What streets have the most expensive properties for sale in Chadderton South?
The streets with the most expensive properties for sale in Chadderton South are Moston Lane East at an average of £300,000, St Georges Square at an average of £285,578 and Shirley Avenue at an average of £261,500.
What streets have the most affordable properties for sale in Chadderton South?
The streets with the most affordable properties for sale in Chadderton South are Canal Street at an average of £75,000, Mellor Way at an average of £80,000 and Drury Lane at an average of £92,000.
Which train stations are available in or near Chadderton South?
Some of the train stations available in or near Chadderton South are Moston, Mills Hill and Ashton-Under-Lyne.
Property Price Paid in Chadderton South by Year
The average sold property price by year was:
| Year | Average Sold Price | Price Change |
Sold Properties
|
|---|---|---|---|
| 2026 | £182,000 | -0,4% |
1 Property |
| 2025 | £182,749 | 7% |
141 Properties |
| 2024 | £169,216 | -3% |
160 Properties |
| 2023 | £173,687 | 4% |
147 Properties |
| 2022 | £167,590 | 11% |
173 Properties |
| 2021 | £149,448 | 7% |
203 Properties |
| 2020 | £139,002 | 13% |
173 Properties |
| 2019 | £121,360 | 11% |
198 Properties |
| 2018 | £107,846 | 3% |
168 Properties |
| 2017 | £104,918 | 1% |
178 Properties |
| 2016 | £103,393 | 7% |
154 Properties |
| 2015 | £96,143 | 4% |
121 Properties |
| 2014 | £92,329 | -19% |
126 Properties |
| 2013 | £110,075 | 15% |
118 Properties |
| 2012 | £94,037 | -4% |
77 Properties |
| 2011 | £97,930 | -1% |
90 Properties |
| 2010 | £99,110 | 1% |
110 Properties |
| 2009 | £98,543 | -17% |
95 Properties |
| 2008 | £115,718 | 9% |
125 Properties |
| 2007 | £105,345 | 3% |
238 Properties |
| 2006 | £102,708 | 10% |
245 Properties |
| 2005 | £92,319 | 20% |
207 Properties |
| 2004 | £74,070 | 21% |
240 Properties |
| 2003 | £58,437 | 18% |
260 Properties |
| 2002 | £47,986 | 11% |
236 Properties |
| 2001 | £42,820 | 10% |
191 Properties |
| 2000 | £38,562 | -3% |
204 Properties |
| 1999 | £39,644 | 5% |
207 Properties |
| 1998 | £37,846 | 7% |
202 Properties |
| 1997 | £35,043 | 0,1% |
170 Properties |
| 1996 | £35,010 | -4% |
187 Properties |
| 1995 | £36,367 | - |
139 Properties |
Property Price per Property Type in Chadderton South
Here you can find historic sold price data in order to help with your property search.
The average Property Paid Price for specific property types in the last three years are:
| Property Type | Average Sold Price | Sold Properties |
|---|---|---|
| Flat | £104,475.00 | 20 Flats |
| Semi Detached House | £205,768.00 | 201 Semi Detached Houses |
| Detached House | £245,750.00 | 8 Detached Houses |
| Terraced House | £150,642.00 | 220 Terraced Houses |