
Houses for sale & to rent in Failsworth East, Oldham
House Prices in Failsworth East
Properties in Failsworth East have an average house price of £370k and had 2 Property Transactions within the last 3 years¹.
Failsworth East is an area in Oldham, Oldham with 36 households², where the most expensive property was sold for £520k.
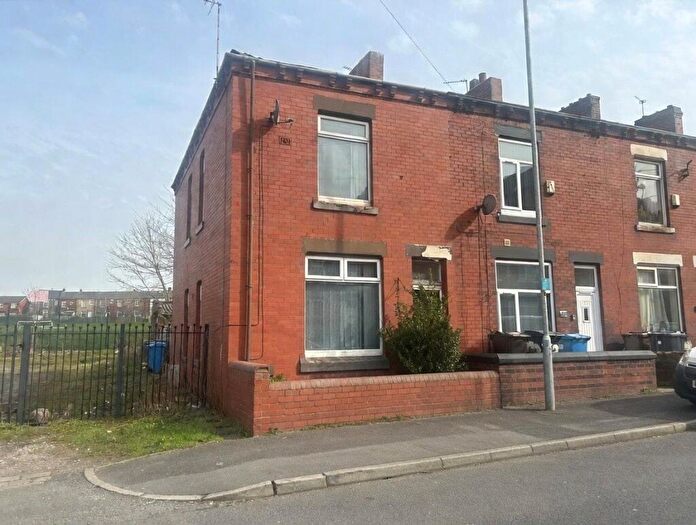
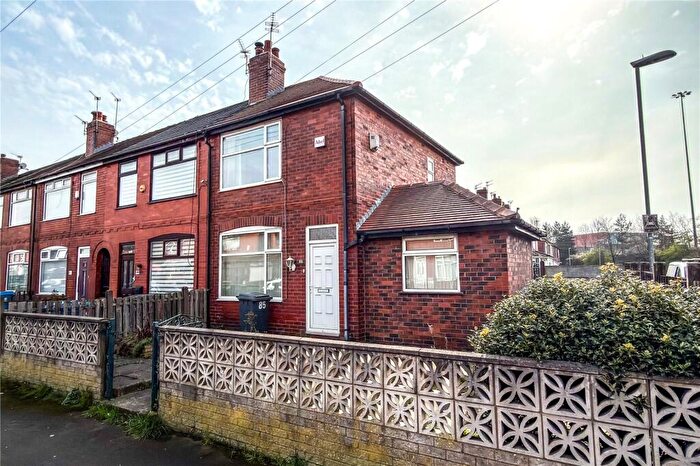
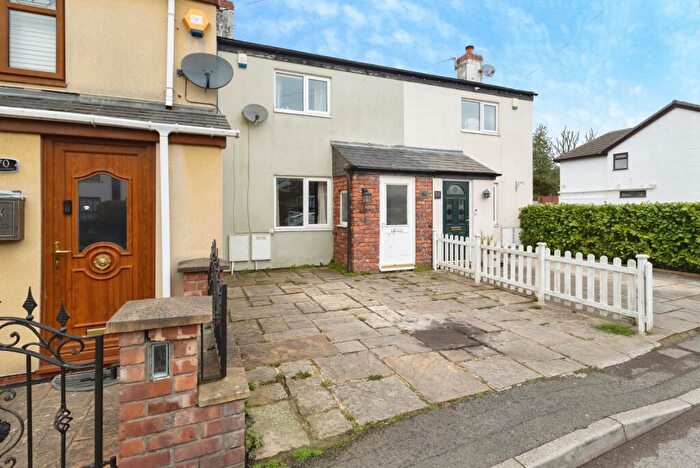
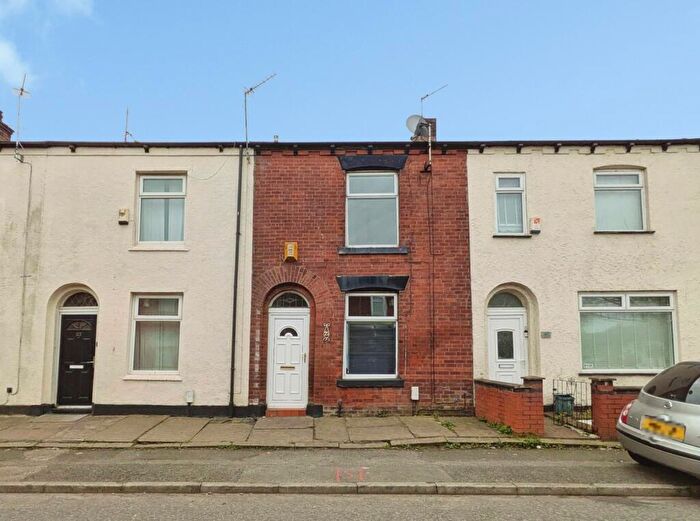
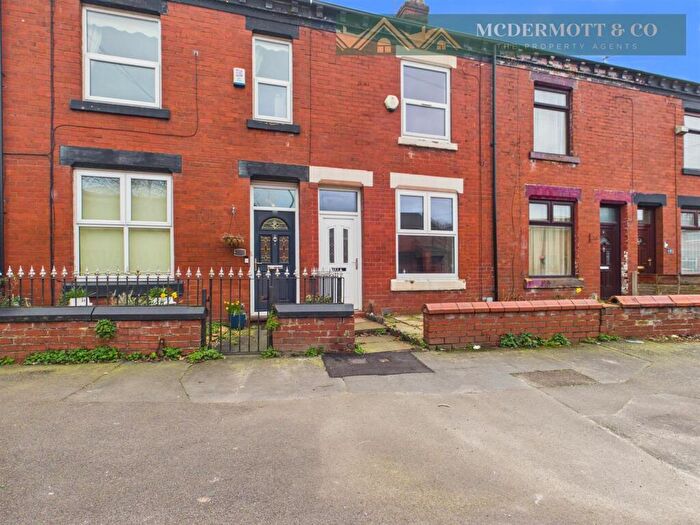
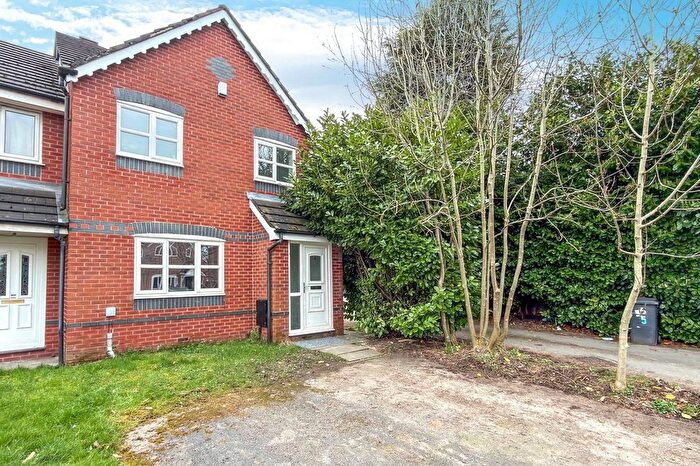
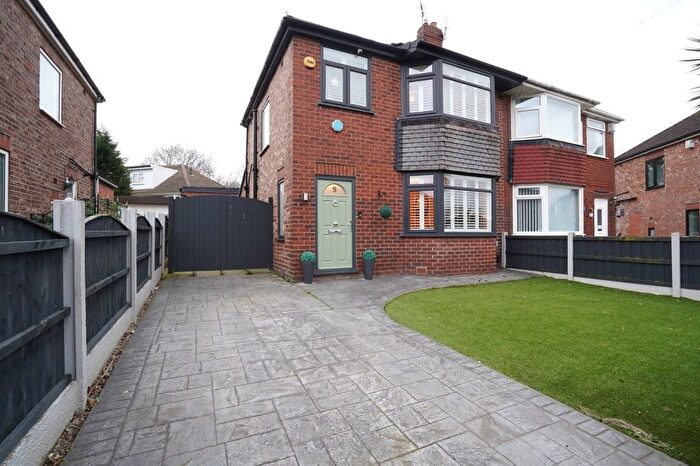
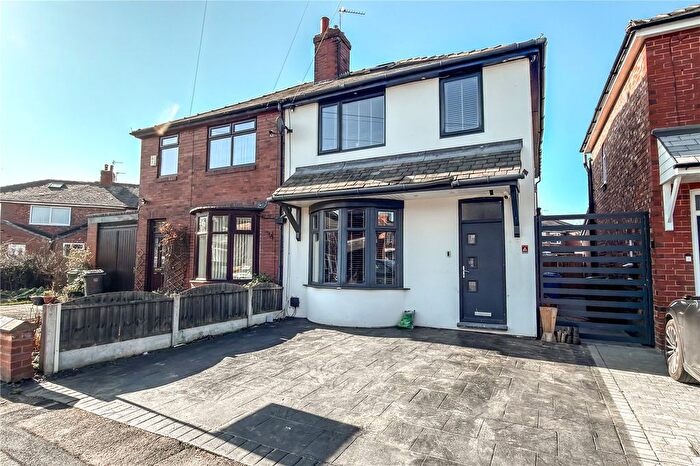
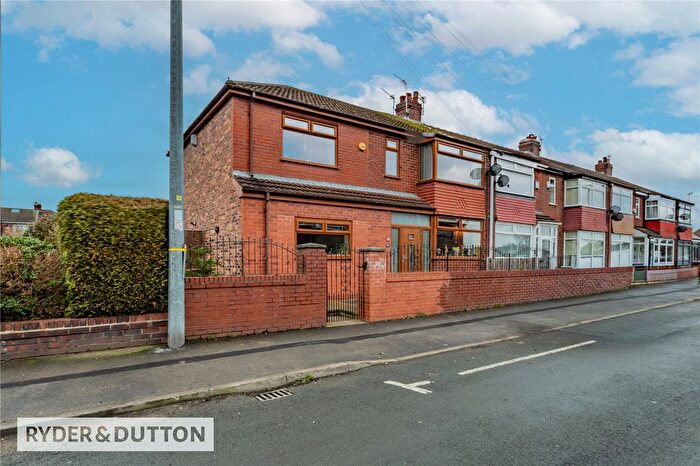
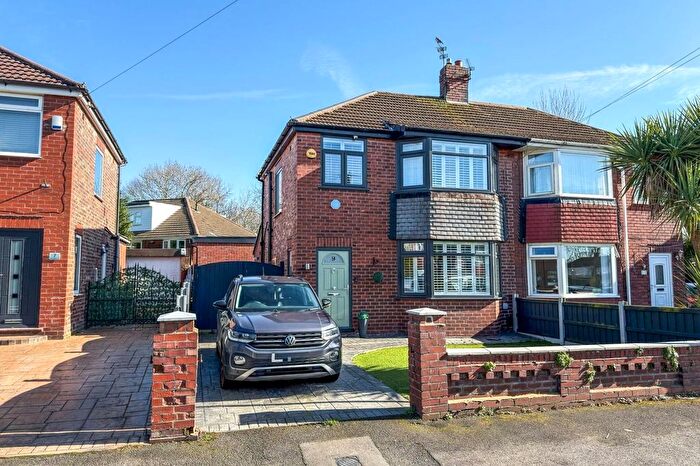
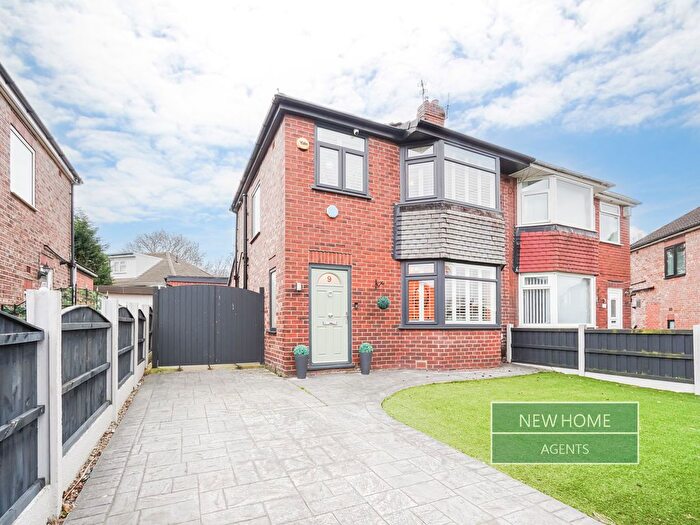
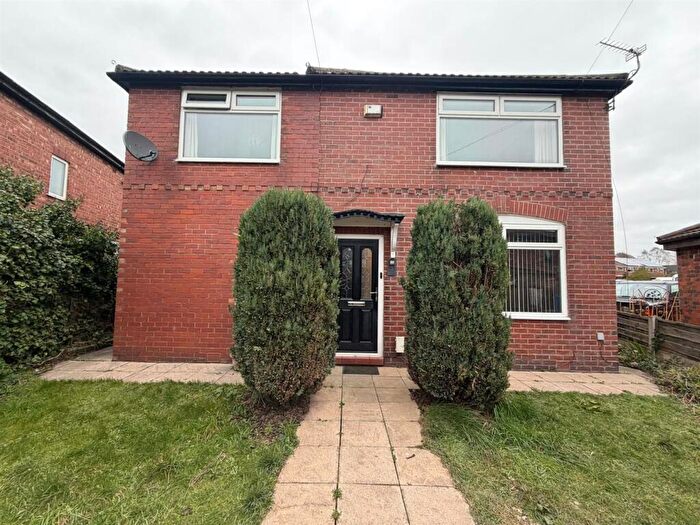
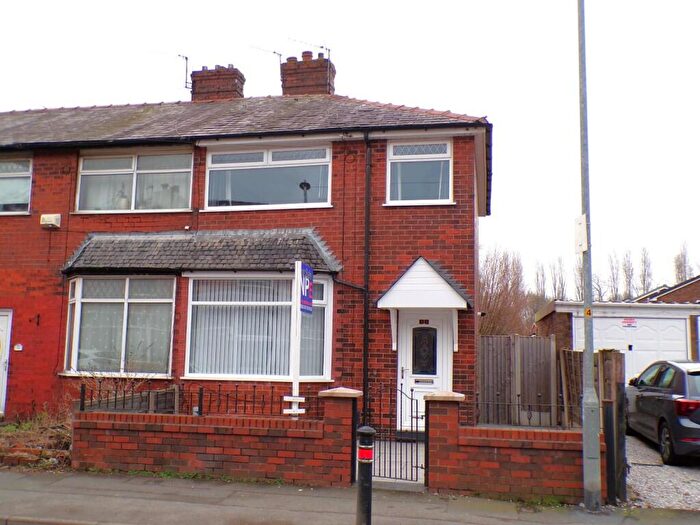
Properties for sale in Failsworth East
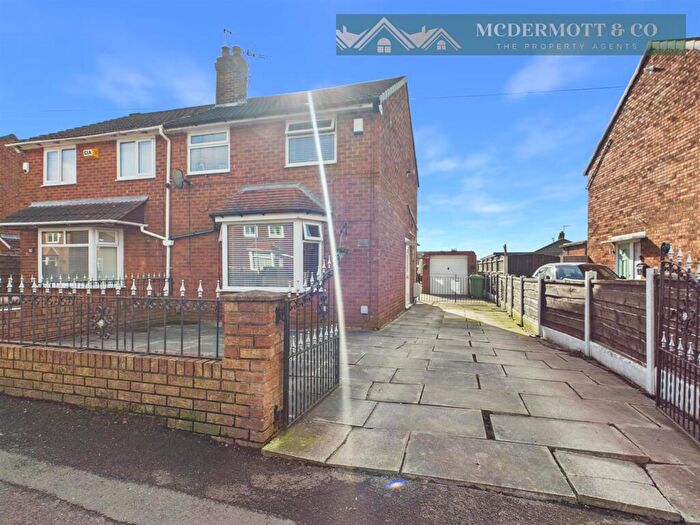

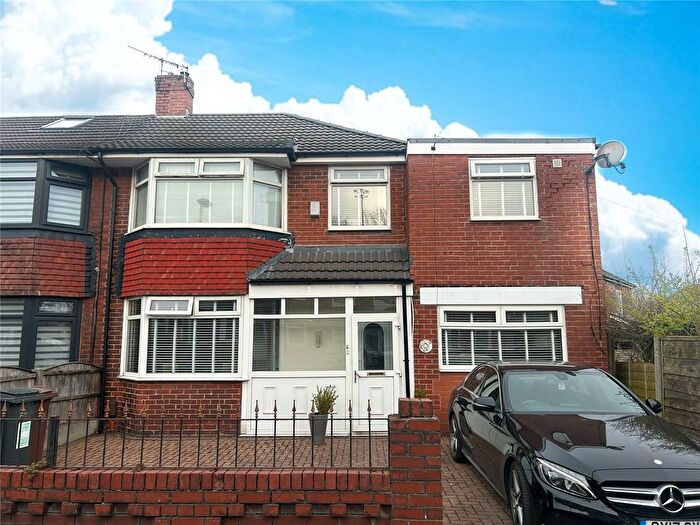
![]()
If you are looking to sell your house, let it out, or receive a property valuation, an expert can help you.
Click the button below to get started.
Roads and Postcodes in Failsworth East
Navigate through our locations to find the location of your next house in Failsworth East, Oldham for sale or to rent.
| Streets | Postcodes |
|---|---|
| Albert Street | OL8 3QP |
| Clifton Street | OL3 7JL |
| Cutler Hill Road | OL8 3NZ |
| Hillingdon Close | OL8 3QJ |
| Hollins Road | OL8 4EH |
| Hollinwood Business Centre | OL8 3QL |
| Manchester Road | OL8 3RB OL9 7AA OL9 7JT |
| Olive Claydon Way | OL8 3QR |
| Railway Road | OL9 7LG |
| Roman Road | OL8 3PH OL8 3PT OL8 3QH |
| Stable Street | OL9 7LH |
Transport near Failsworth East

- FAQ
- Price Paid By Year
- Property Type Price
Frequently asked questions about Failsworth East
What is the average price for a property for sale in Failsworth East?
The average price for a property for sale in Failsworth East is £370,000. This amount is 79% higher than the average price in Oldham. There are 848 property listings for sale in Failsworth East.
What streets have the most expensive properties for sale in Failsworth East?
The street with the most expensive properties for sale in Failsworth East is Cutler Hill Road at an average of £520,000.
What streets have the most affordable properties for sale in Failsworth East?
The street with the most affordable properties for sale in Failsworth East is Hillingdon Close at an average of £220,000.
Which train stations are available in or near Failsworth East?
Some of the train stations available in or near Failsworth East are Moston, Ashton-Under-Lyne and Mills Hill.
Property Price Paid in Failsworth East by Year
The average sold property price by year was:
| Year | Average Sold Price | Price Change |
Sold Properties
|
|---|---|---|---|
| 2025 | £520,000 | 58% |
1 Property |
| 2024 | £220,000 | 6% |
1 Property |
| 2022 | £206,000 | 2% |
1 Property |
| 2020 | £202,000 | 25% |
1 Property |
| 2019 | £152,500 | 5% |
2 Properties |
| 2018 | £145,000 | 35% |
2 Properties |
| 2017 | £94,000 | -80% |
1 Property |
| 2014 | £169,000 | 55% |
1 Property |
| 2013 | £76,000 | -182% |
1 Property |
| 2012 | £214,500 | 53% |
2 Properties |
| 2009 | £101,000 | 12% |
2 Properties |
| 2008 | £89,000 | -35% |
1 Property |
| 2007 | £120,000 | 29% |
1 Property |
| 2004 | £85,000 | 17% |
1 Property |
| 2002 | £70,175 | 31% |
4 Properties |
| 2001 | £48,500 | -12% |
2 Properties |
| 2000 | £54,475 | 61% |
2 Properties |
| 1999 | £21,375 | -148% |
2 Properties |
| 1998 | £53,000 | 16% |
2 Properties |
| 1997 | £44,500 | -26% |
1 Property |
| 1996 | £55,950 | 12% |
1 Property |
| 1995 | £49,000 | - |
2 Properties |
Property Price per Property Type in Failsworth East
Here you can find historic sold price data in order to help with your property search.
The average Property Paid Price for specific property types in the last three years are:
| Property Type | Average Sold Price | Sold Properties |
|---|---|---|
| Semi Detached House | £520,000.00 | 1 Semi Detached House |
| Detached House | £220,000.00 | 1 Detached House |