
Houses for sale & to rent in OL3 7LJ, High Grove Road, Saddleworth South, Oldham
House Prices in OL3 7LJ, High Grove Road, Saddleworth South
Properties in OL3 7LJ have no sales history available within the last 3 years. OL3 7LJ is a postcode in High Grove Road located in Saddleworth South, an area in Oldham, Oldham, with 2 households².
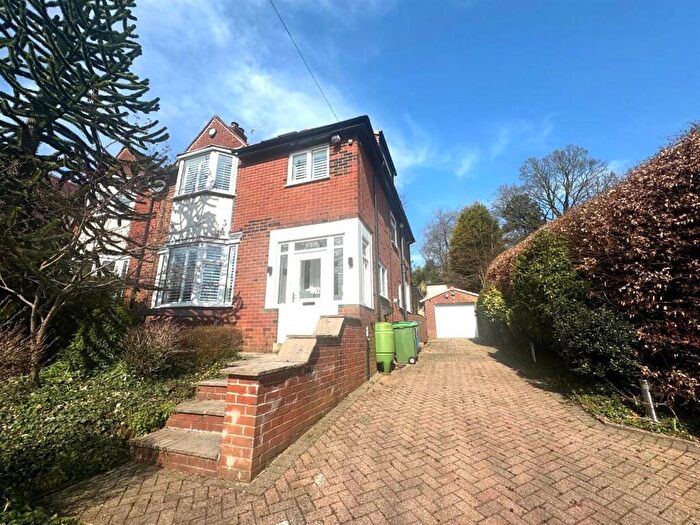
Properties for sale near OL3 7LJ, High Grove Road


![]()
If you are looking to sell your house, let it out, or receive a property valuation, an expert can help you.
Click the button below to get started.


Price Paid in High Grove Road, OL3 7LJ, Saddleworth South
36 High Grove Road, OL3 7LJ, Saddleworth South Oldham
Property 36 has been sold 3 times. The last time it was sold was in 20/06/2014 and the sold price was £362,500.00.
This detached house, sold as a leasehold on 20/06/2014, is a 166 sqm detached house with an EPC rating of C.
| Date | Price | Property Type | Tenure | Classification |
|---|---|---|---|---|
| 20/06/2014 | £362,500.00 | Detached House | leasehold | Established Building |
| 28/02/2007 | £280,000.00 | Detached House | leasehold | Established Building |
| 12/02/1999 | £114,500.00 | Detached House | leasehold | Established Building |
34 High Grove Road, OL3 7LJ, Saddleworth South Oldham
Property 34 has been sold 1 time. The last time it was sold was in 28/02/2002 and the sold price was £165,000.00.
This is a Detached House which was sold as a leasehold in 28/02/2002
| Date | Price | Property Type | Tenure | Classification |
|---|---|---|---|---|
| 28/02/2002 | £165,000.00 | Detached House | leasehold | Established Building |
Postcodes in High Grove Road, Saddleworth South
Navigate through other locations in High Grove Road, Saddleworth South, Oldham to see more property listings for sale or to rent.
Transport near OL3 7LJ, High Grove Road
-
 Greenfield Station
 -
Mossley (Greater Manchester) Station
-
Stalybridge Station
-
Ashton-Under-Lyne Station
House price paid reports for OL3 7LJ, High Grove Road
Click on the buttons below to see price paid reports by year or property price:
- Price Paid By Year
Property Price Paid in OL3 7LJ, High Grove Road by Year
The average sold property price by year was:
| Year | Average Sold Price | Price Change |
Sold Properties
|
|---|---|---|---|
| 2014 | £362,500 | 23% |
1 Property |
| 2007 | £280,000 | 41% |
1 Property |
| 2002 | £165,000 | 31% |
1 Property |
| 1999 | £114,500 | - |
1 Property |