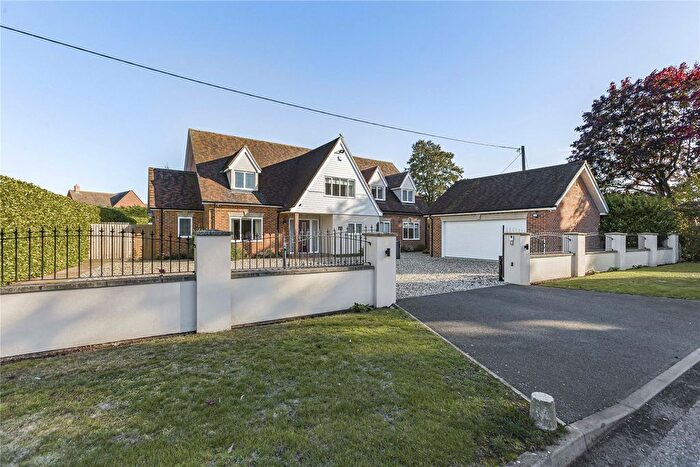
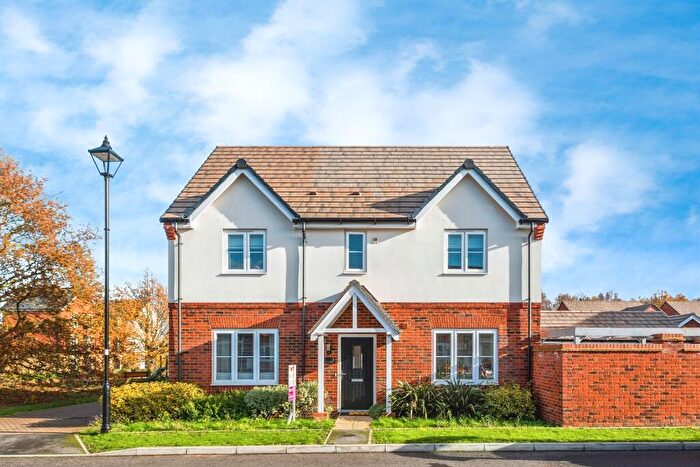
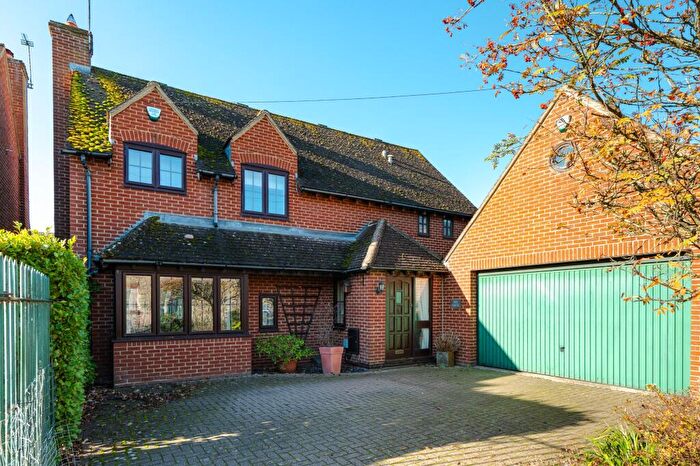
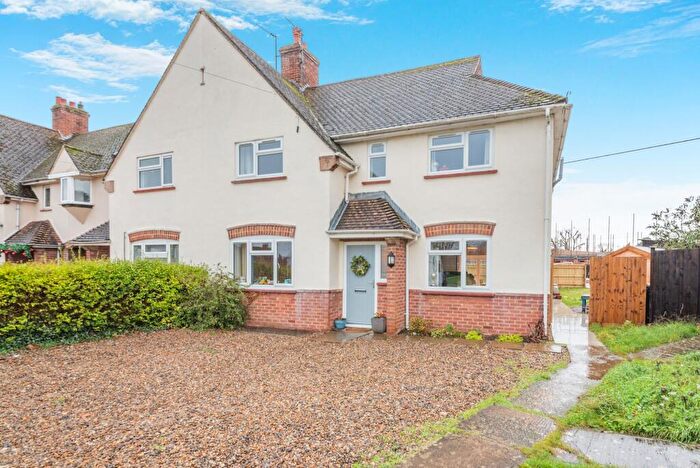
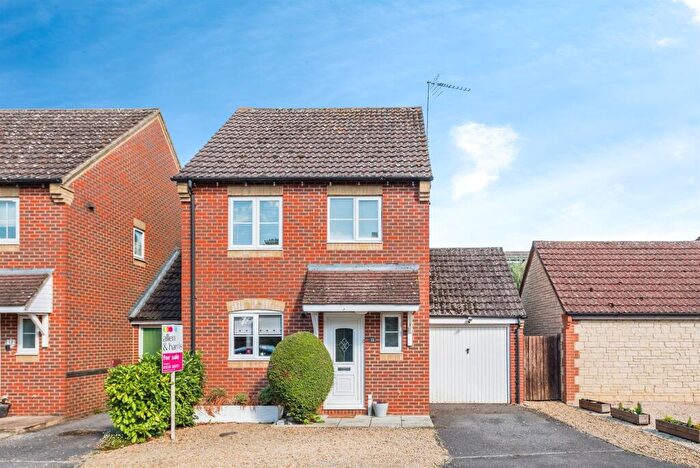
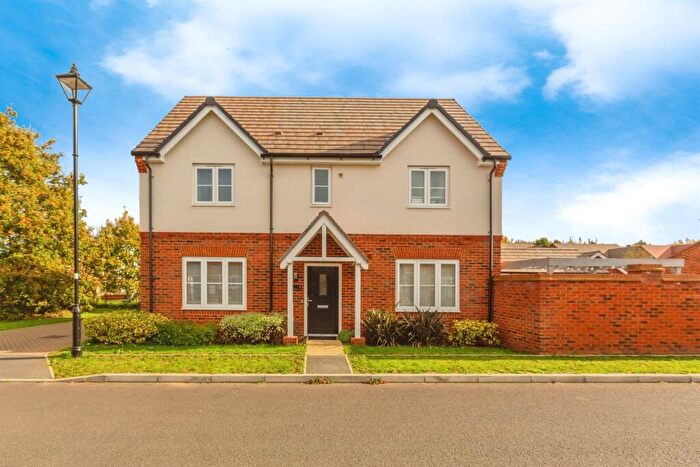
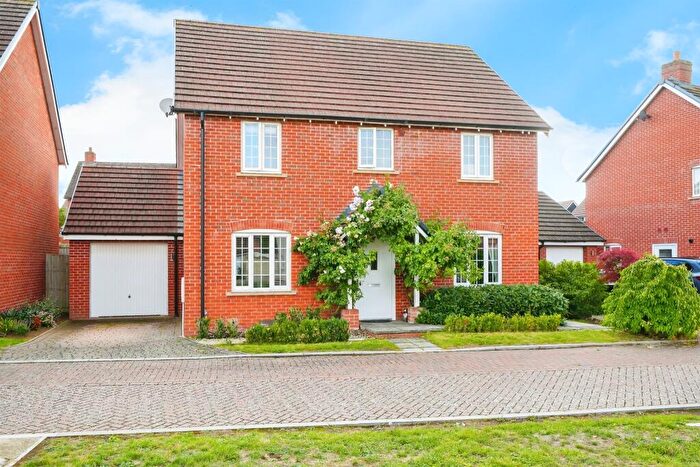
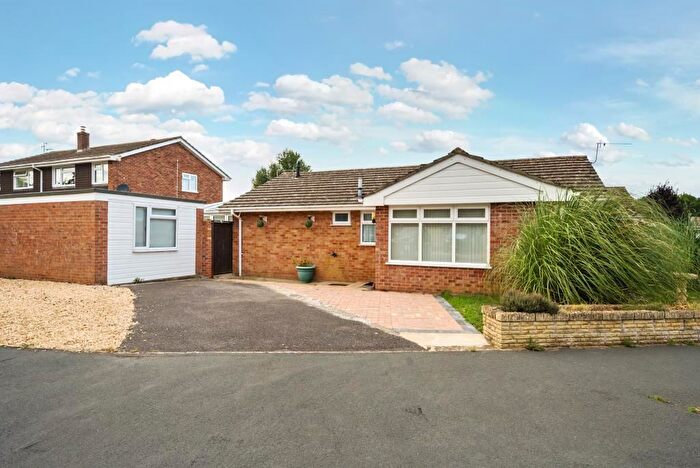
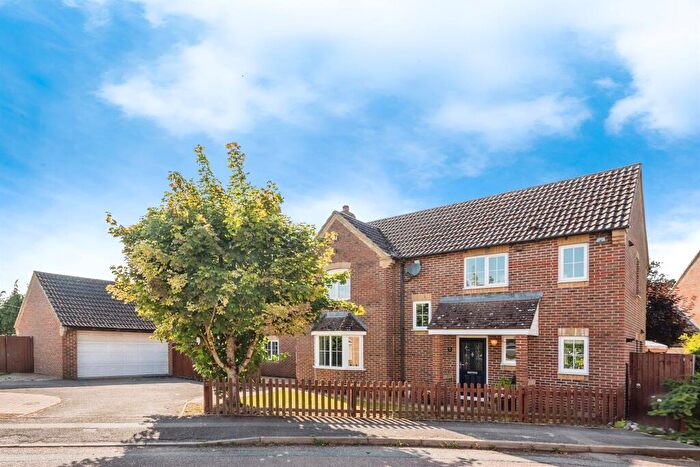
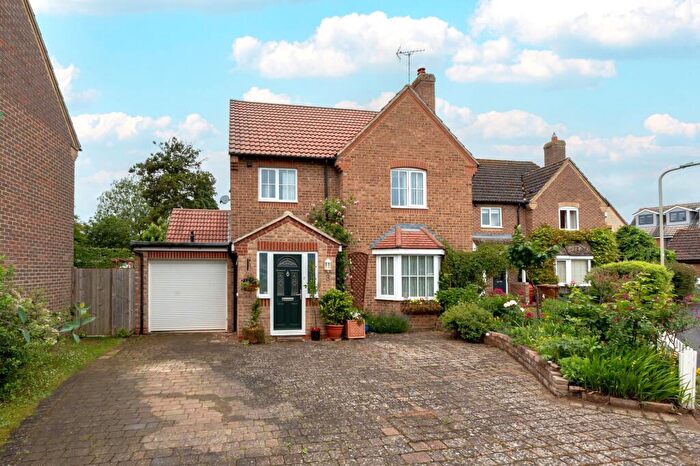
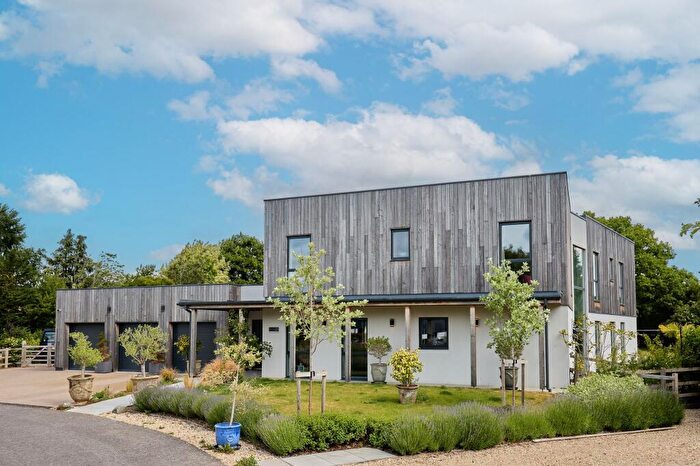
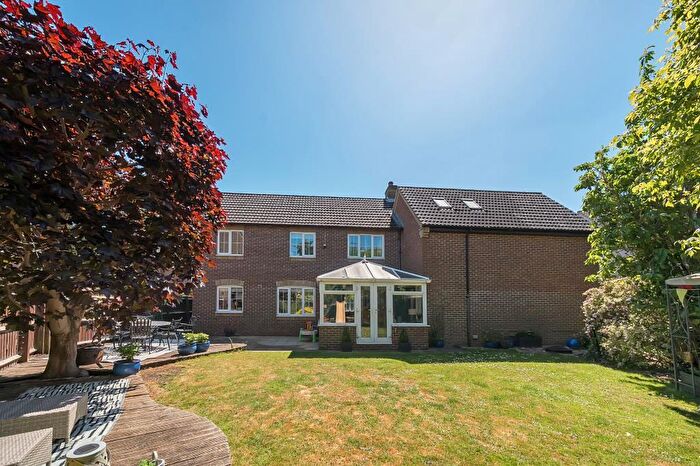
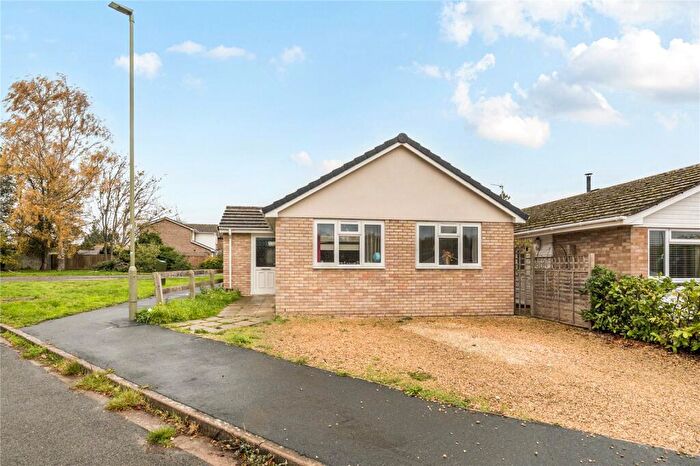
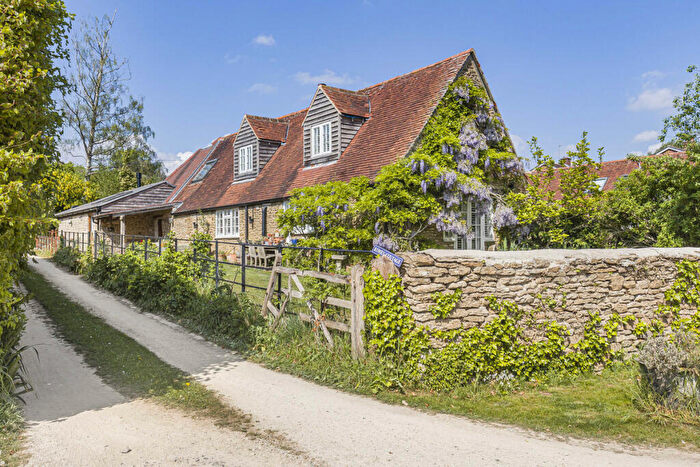
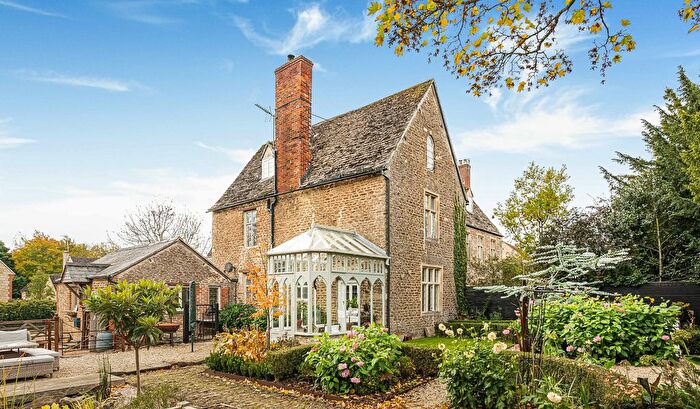
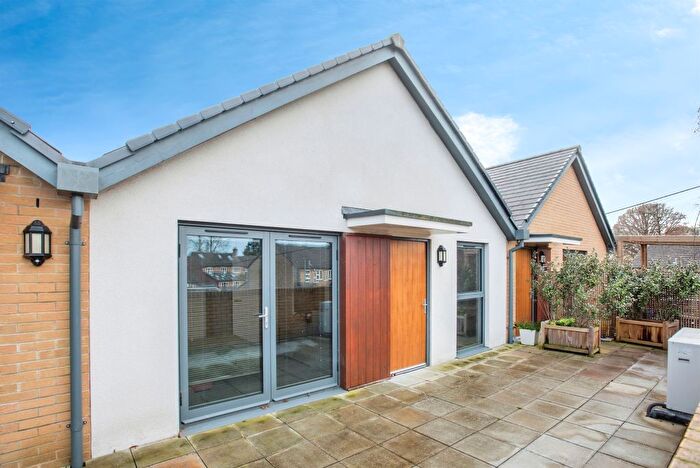
Houses for sale & to rent in Kingston Bagpuize With Southmoor, Abingdon
House Prices in Kingston Bagpuize With Southmoor
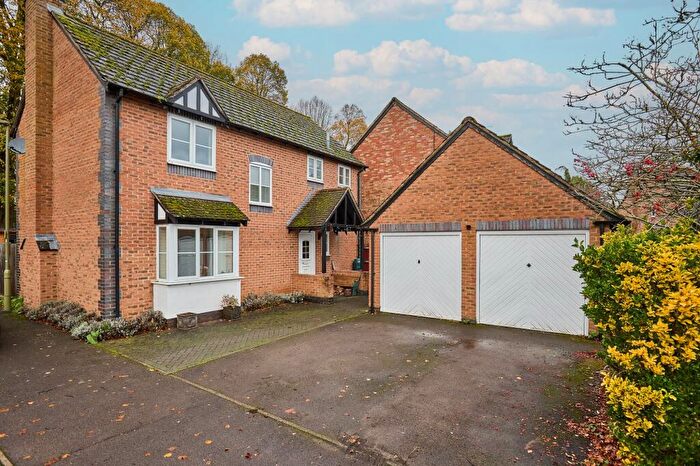
Properties in Kingston Bagpuize With Southmoor have an average house price of £507,970.00 and had 117 Property Transactions within the last 3 years¹.
Kingston Bagpuize With Southmoor is an area in Abingdon, Oxfordshire with 906 households², where the most expensive property was sold for £1,450,000.00.
Properties for sale in Kingston Bagpuize With Southmoor
Previously listed properties in Kingston Bagpuize With Southmoor
Roads and Postcodes in Kingston Bagpuize With Southmoor
Navigate through our locations to find the location of your next house in Kingston Bagpuize With Southmoor, Abingdon for sale or to rent.
| Streets | Postcodes |
|---|---|
| Abingdon Road | OX13 5AR OX13 5AW |
| Acacia Gardens | OX13 5DE |
| Beggars Lane | OX13 5BL |
| Bellamy Close | OX13 5AB |
| Blandy Avenue | OX13 5DA OX13 5DB |
| Blenheim Way | OX13 5NQ |
| Bullocks Pit Lane | OX13 5HJ |
| Chapel Mews | OX13 5DL |
| Cherry Tree Close | OX13 5BB OX13 5BE |
| Draycott Road | OX13 5BY OX13 5BZ |
| Faringdon Road | OX13 5AA OX13 5AF OX13 5AG OX13 5AH OX13 5AQ OX13 5BA OX13 5BG OX13 5BH OX13 5BJ |
| Field Close | OX13 5EZ |
| Fir Tree Close | OX13 5DQ |
| Frax Close | OX13 5AZ |
| Greenheart Way | OX13 5DF |
| Hanney Road | OX13 5HT |
| Hayes Avenue | OX13 5BD |
| Larch Close | OX13 5DD |
| Latton Close | OX13 5AE |
| Laurel Drive | OX13 5DG OX13 5DJ |
| Lime Grove | OX13 5DN |
| Northfield Farm Cottages | OX13 5HZ |
| Norwood Avenue | OX13 5AD |
| Oxford Road | OX13 5AP OX13 5FZ |
| Paddock Mews | OX13 5BU |
| Race Farm Lane | OX13 5AU |
| Rectory Lane | OX13 5AT OX13 5DS |
| Redwood Close | OX13 5DH |
| Restwood Place | OX13 5BW |
| Rimes Close | OX13 5AL |
| Sandy Lane | OX13 5HX |
| School Lane | OX13 5AJ |
| Soden Place | OX13 5EY |
| Springhill | OX13 5HL |
| Stone House Close | OX13 5BP |
| Stonehill Lane | OX13 5HU |
| The Paddock | OX13 5BX |
| Town Pond Lane | OX13 5HS |
| Wellington Way | OX13 5FG |
| Witney Road | OX13 5AN |
| Worcester Place | OX13 5NG |
| OX13 5AY OX13 5HY |
Transport near Kingston Bagpuize With Southmoor
- FAQ
- Price Paid By Year
- Property Type Price
Frequently asked questions about Kingston Bagpuize With Southmoor
What is the average price for a property for sale in Kingston Bagpuize With Southmoor?
The average price for a property for sale in Kingston Bagpuize With Southmoor is £507,970. This amount is 14% higher than the average price in Abingdon. There are 311 property listings for sale in Kingston Bagpuize With Southmoor.
What streets have the most expensive properties for sale in Kingston Bagpuize With Southmoor?
The streets with the most expensive properties for sale in Kingston Bagpuize With Southmoor are Springhill at an average of £1,132,500, Beggars Lane at an average of £898,333 and Rectory Lane at an average of £775,000.
What streets have the most affordable properties for sale in Kingston Bagpuize With Southmoor?
The streets with the most affordable properties for sale in Kingston Bagpuize With Southmoor are Redwood Close at an average of £312,000, Larch Close at an average of £342,200 and Hayes Avenue at an average of £346,475.
Which train stations are available in or near Kingston Bagpuize With Southmoor?
Some of the train stations available in or near Kingston Bagpuize With Southmoor are Radley, Culham and Oxford.
Property Price Paid in Kingston Bagpuize With Southmoor by Year
The average sold property price by year was:
| Year | Average Sold Price | Price Change |
Sold Properties
|
|---|---|---|---|
| 2025 | £483,369 | - |
23 Properties |
| 2024 | £483,160 | -9% |
34 Properties |
| 2023 | £527,503 | -1% |
28 Properties |
| 2022 | £534,921 | 15% |
32 Properties |
| 2021 | £452,823 | 3% |
69 Properties |
| 2020 | £438,138 | -14% |
38 Properties |
| 2019 | £501,486 | 9% |
37 Properties |
| 2018 | £457,723 | 9% |
35 Properties |
| 2017 | £416,905 | 3% |
38 Properties |
| 2016 | £405,890 | 1% |
32 Properties |
| 2015 | £402,671 | 3% |
50 Properties |
| 2014 | £392,489 | 8% |
52 Properties |
| 2013 | £362,265 | 2% |
36 Properties |
| 2012 | £353,293 | 15% |
29 Properties |
| 2011 | £300,843 | -33% |
30 Properties |
| 2010 | £398,842 | 24% |
45 Properties |
| 2009 | £304,255 | -9% |
29 Properties |
| 2008 | £330,405 | -11% |
20 Properties |
| 2007 | £365,579 | 15% |
50 Properties |
| 2006 | £309,239 | 13% |
60 Properties |
| 2005 | £268,956 | -6% |
36 Properties |
| 2004 | £284,615 | 9% |
48 Properties |
| 2003 | £259,166 | 18% |
40 Properties |
| 2002 | £213,426 | 10% |
57 Properties |
| 2001 | £192,064 | 9% |
60 Properties |
| 2000 | £174,269 | 22% |
56 Properties |
| 1999 | £136,619 | 6% |
53 Properties |
| 1998 | £128,487 | 13% |
77 Properties |
| 1997 | £112,188 | 3% |
77 Properties |
| 1996 | £109,112 | 17% |
47 Properties |
| 1995 | £90,227 | - |
45 Properties |
Property Price per Property Type in Kingston Bagpuize With Southmoor
Here you can find historic sold price data in order to help with your property search.
The average Property Paid Price for specific property types in the last three years are:
| Property Type | Average Sold Price | Sold Properties |
|---|---|---|
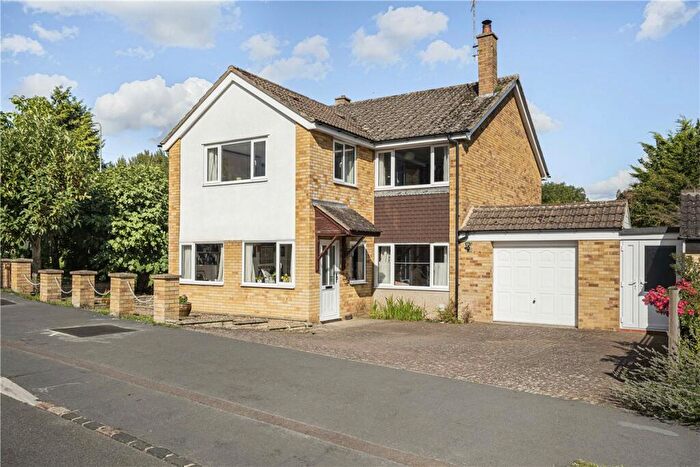
| Semi Detached House | £412,223.00 | 36 Semi Detached Houses |
| Detached House | £623,904.00 | 63 Detached Houses |
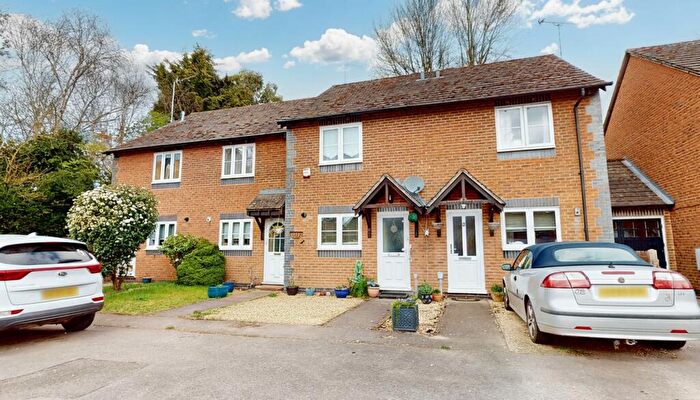
| Terraced House | £329,107.00 | 14 Terraced Houses |
| Flat | £169,750.00 | 4 Flats |

