
Houses for sale in Abingdon, Oxfordshire
House Prices in Abingdon
Properties in Abingdon have an average house price of £442k and had 2,419 Property Transactions within the last 3 years.¹
Abingdon is an area in Oxfordshire with 25,658 households², where the most expensive property was sold for £4.82M.
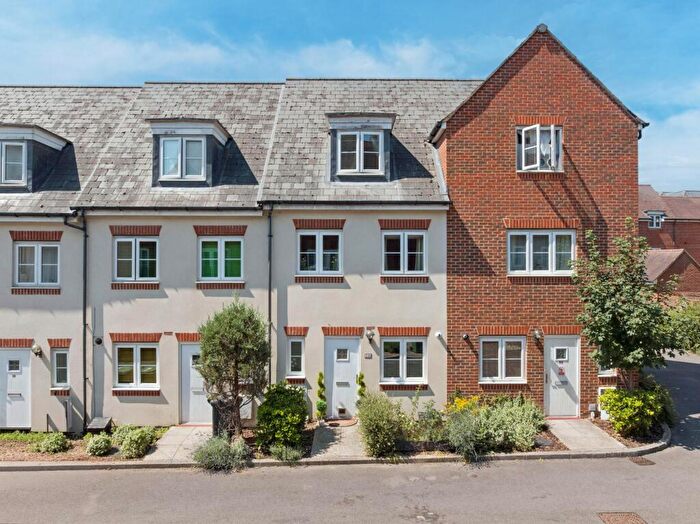
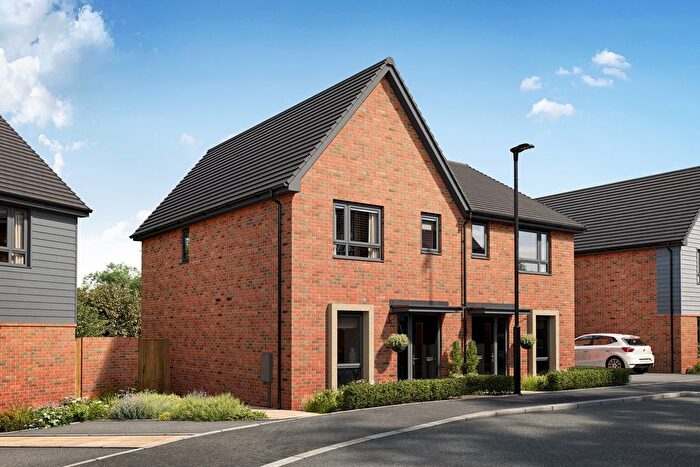
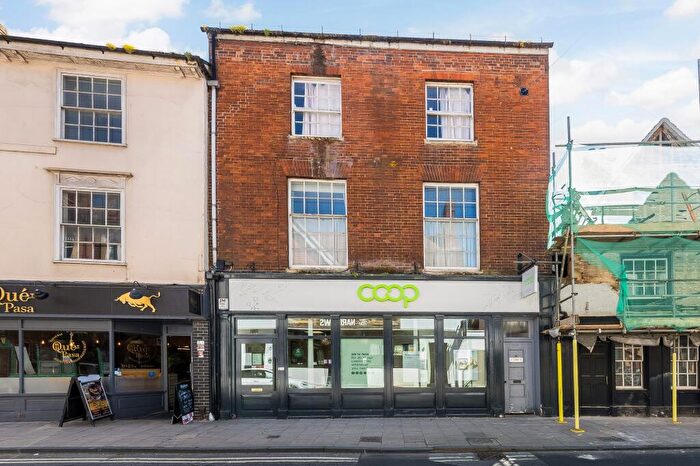
Properties for sale in Abingdon

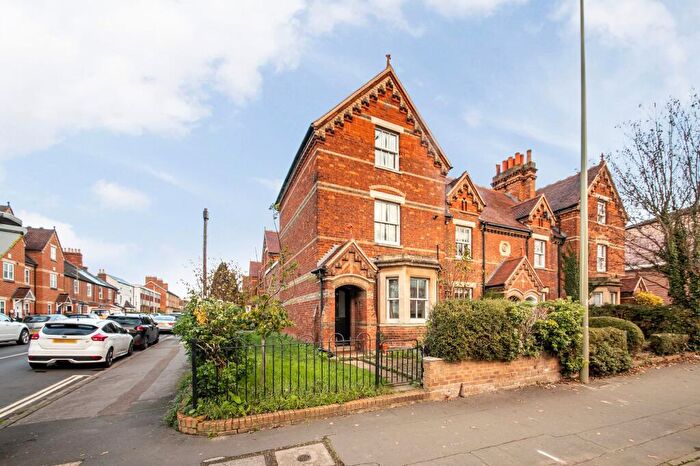

![]()
If you are looking to sell your house, let it out, or receive a property valuation, an expert can help you.
Click the button below to get started.


Neighbourhoods in Abingdon
Navigate through our locations to find the location of your next house in Abingdon, Oxfordshire for sale or to rent.
- Abingdon Abbey And Barton
- Abingdon Caldecott
- Abingdon Dunmore
- Abingdon Fitzharris
- Abingdon Northcourt
- Abingdon Ock Meadow
- Abingdon Peachcroft
- Appleton And Cumnor
- Brightwell
- Drayton
- Hanneys
- Harwell
- Hendreds
- Kingston Bagpuize With Southmoor
- Longworth
- Marcham And Shippon
- Radley
- Sandford
- Sunningwell And Wootton
- Sutton Courtenay And Appleford
- Kingston Bagpuize
- Marcham
- Steventon & the Hanneys
- Botley & Sunningwell
- Abingdon Abbey Northcourt
- Kennington & Radley
- Sandford & the Wittenhams
- Sutton Courtenay
- Thames
- Wootton
Property price trends in Abingdon
According to the latest Land Registry data, the average home in Abingdon sold for £380,353 in 2026. That figure comes from a substantial record of 30,931 sales logged over the past 31 years.
Prices have fallen back over the last three years. Compared with 2023, when the typical sale came in around £456,415, that's a fall of roughly 16.7%.
Looking back five years, average prices are down about 14.5% since 2021, a drop of around £64,752 in cash terms.
Zoom out to the past decade for the fuller picture. Back in 2016, homes here averaged £376,789, so the typical sold price has climbed about 0.9% since then, roughly 0.1% a year. Stretch the view to fifteen years and that annual pace edges up closer to 2%.
Frequently asked questions about Abingdon
What is the average price for a property for sale in Abingdon?
The average price for a property for sale in Abingdon is £442,233. This amount is 7% lower than the average price in Oxfordshire. There are more than 10,000 property listings for sale in Abingdon.
What locations have the most expensive properties for sale in Abingdon?
The locations with the most expensive properties for sale in Abingdon are Wootton at an average of £1,100,000, Hanneys at an average of £1,028,916 and Longworth at an average of £699,062.
What locations have the most affordable properties for sale in Abingdon?
The locations with the most affordable properties for sale in Abingdon are Abingdon Abbey Northcourt at an average of £240,150, Abingdon Ock Meadow at an average of £312,569 and Abingdon Abbey And Barton at an average of £326,003.
Which train stations are available in or near Abingdon?
Some of the train stations available in or near Abingdon are Radley, Culham and Appleford.
Property Price Paid in Abingdon by Year
The average sold property price by year was:
| Year | Average Sold Price | Price Change |
Sold Properties
|
|---|---|---|---|
| 2026 | £380,353 | -15% |
46 Properties |
| 2025 | £435,776 | -1% |
760 Properties |
| 2024 | £438,434 | -4% |
841 Properties |
| 2023 | £456,415 | 2% |
772 Properties |
| 2022 | £448,629 | 1% |
872 Properties |
| 2021 | £445,105 | 1% |
1,136 Properties |
| 2020 | £441,274 | 11% |
909 Properties |
| 2019 | £394,609 | -2% |
1,032 Properties |
| 2018 | £400,857 | 4% |
1,022 Properties |
| 2017 | £385,507 | 2% |
1,044 Properties |
Property Price per Property Type in Abingdon
Here you can find historic sold price data in order to help with your property search.
The average Property Paid Price for specific property types in the last three years are:
| Property Type | Average Sold Price | Sold Properties |
|---|---|---|
| Semi Detached House | £409,378.00 | 693 Semi Detached Houses |
| Terraced House | £342,798.00 | 576 Terraced Houses |
| Detached House | £660,139.00 | 757 Detached Houses |
| Flat | £226,174.00 | 393 Flats |
Transport in Abingdon
Please see below transportation links in this area:
