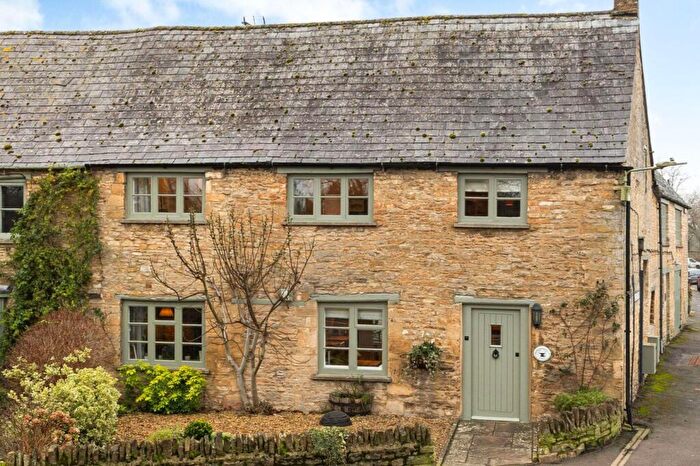
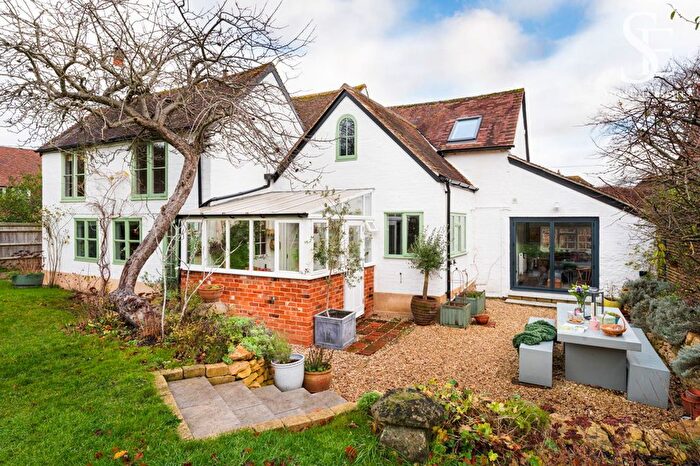
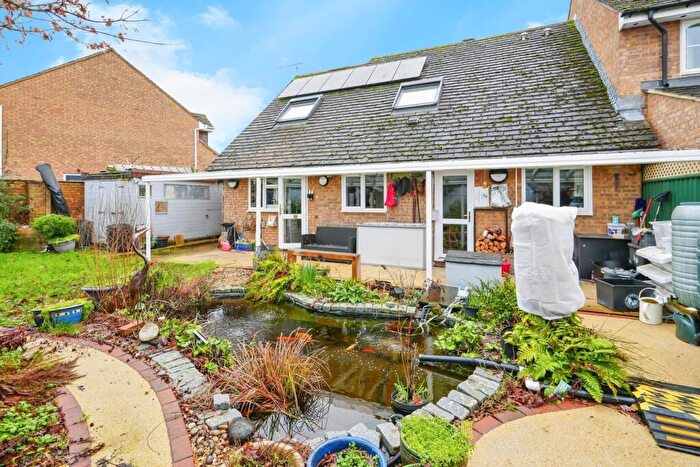
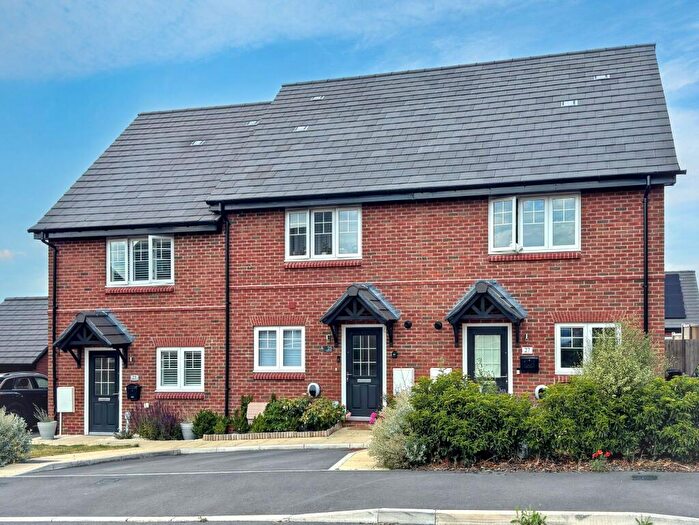
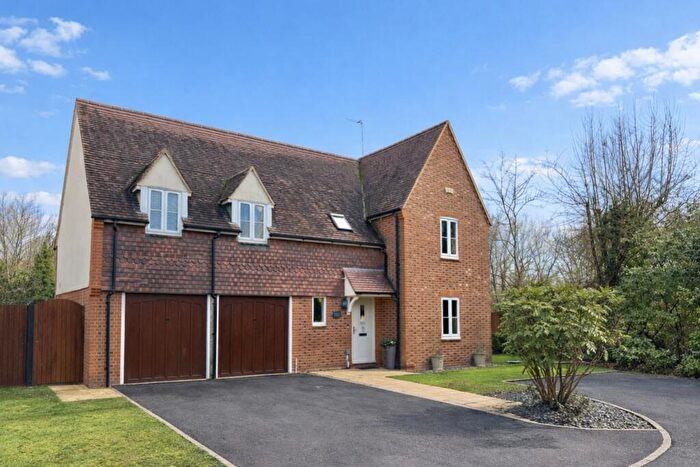
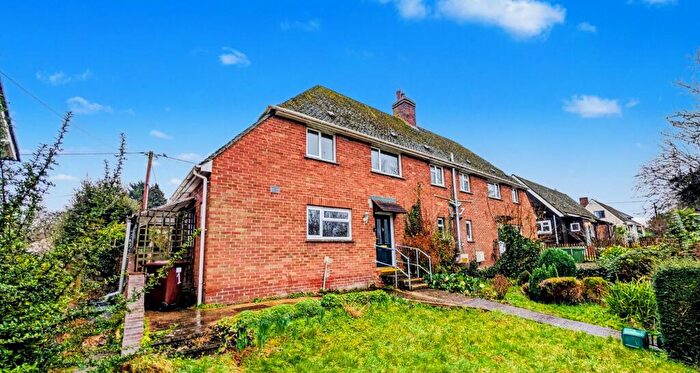
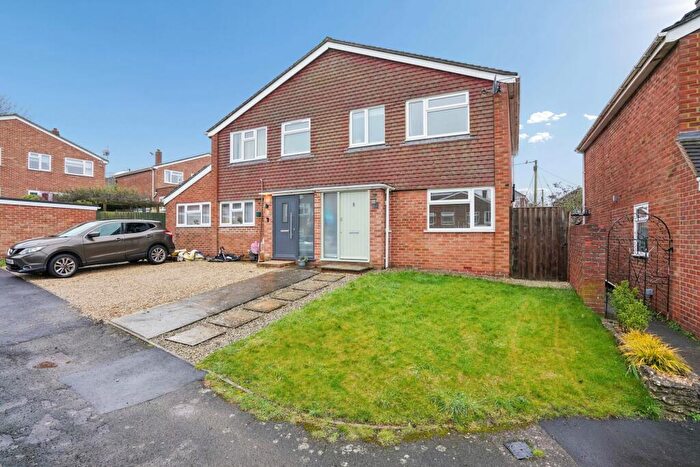
Houses for sale & to rent in Thames, Abingdon
House Prices in Thames
Properties in Thames have an average house price of £620,000.00 and had 3 Property Transactions within the last 3 years¹.
Thames is an area in Abingdon, Oxfordshire with 109 households², where the most expensive property was sold for £940,000.00.
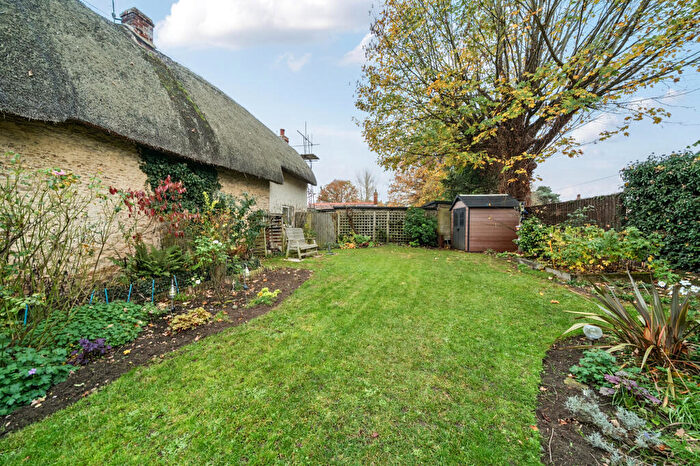
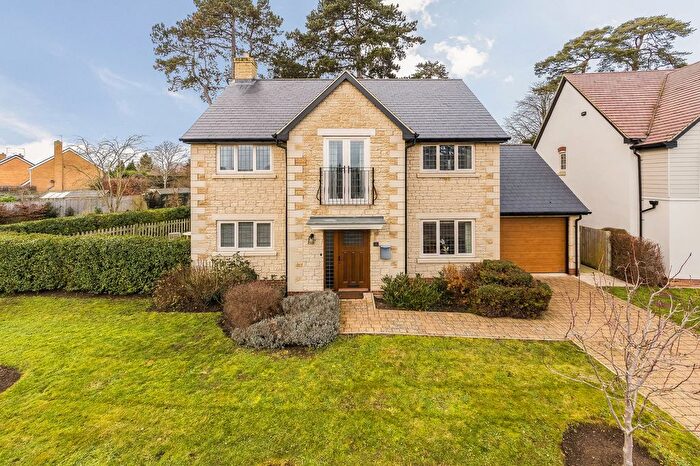
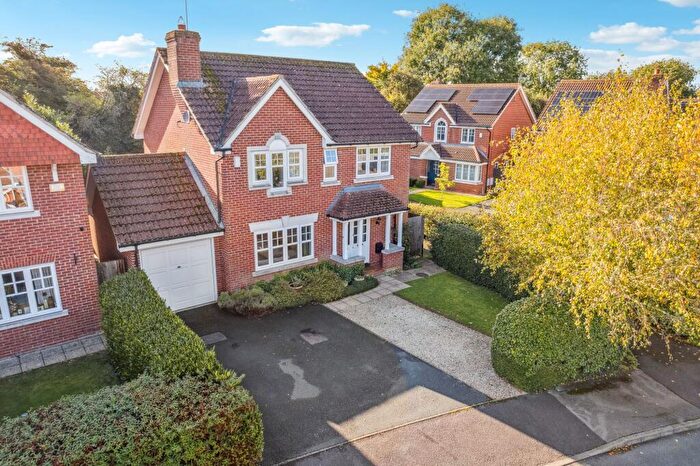
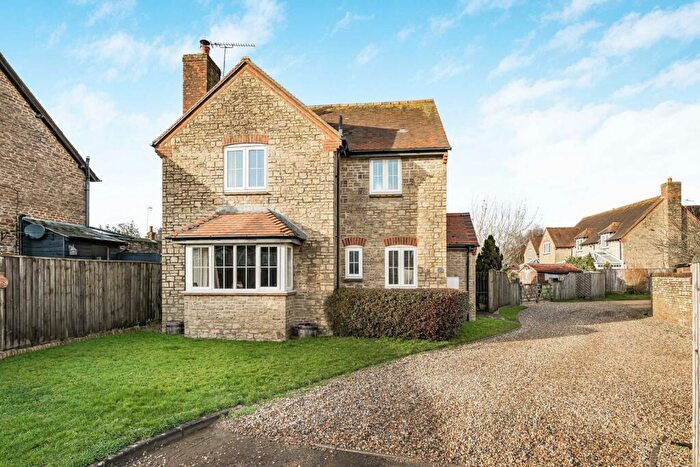
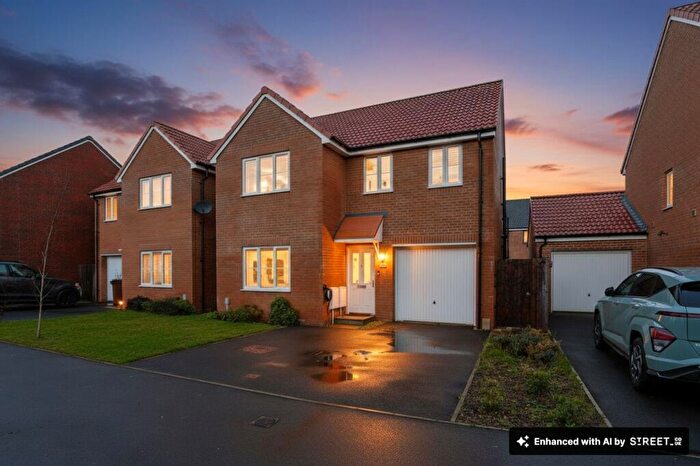
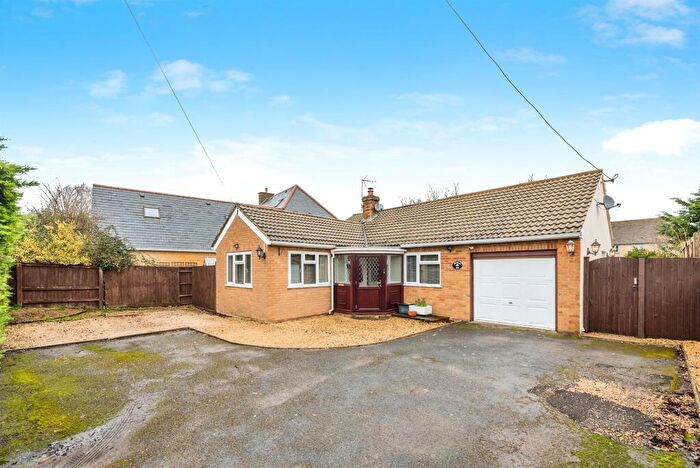
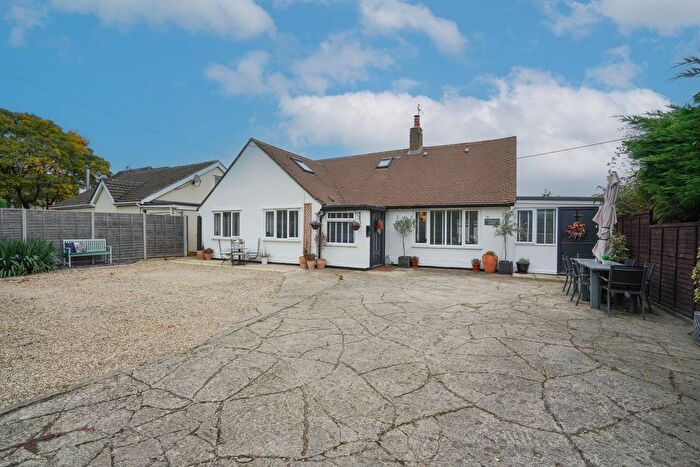
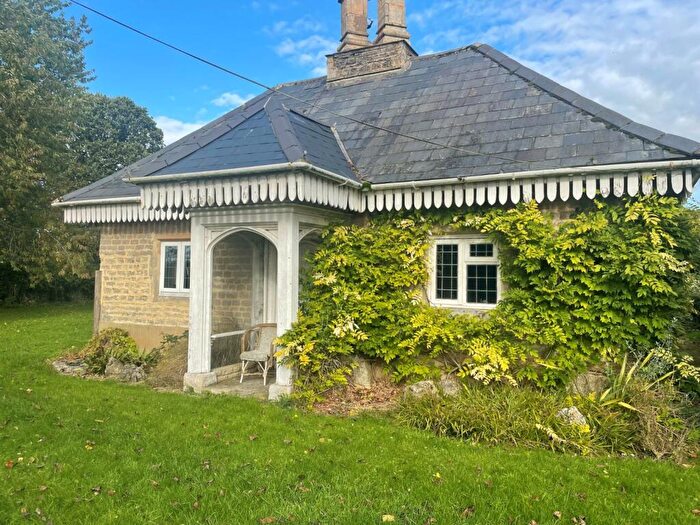
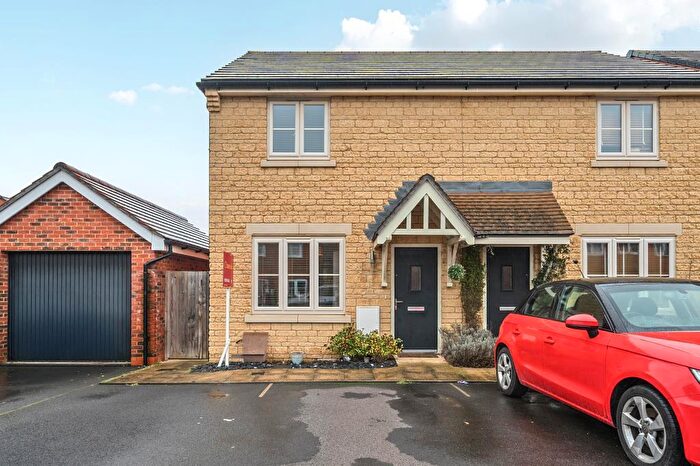
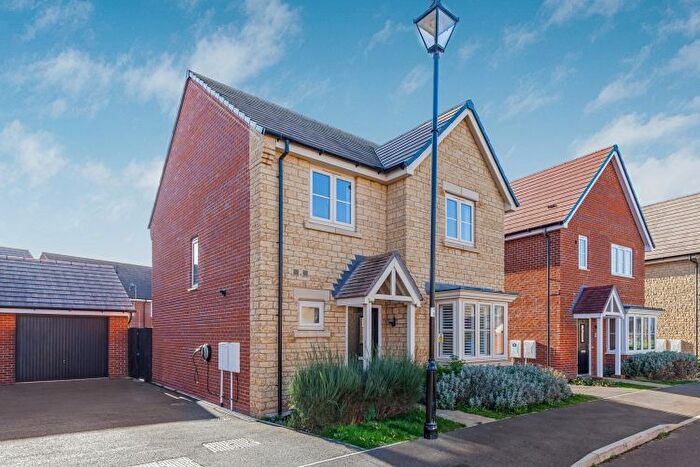
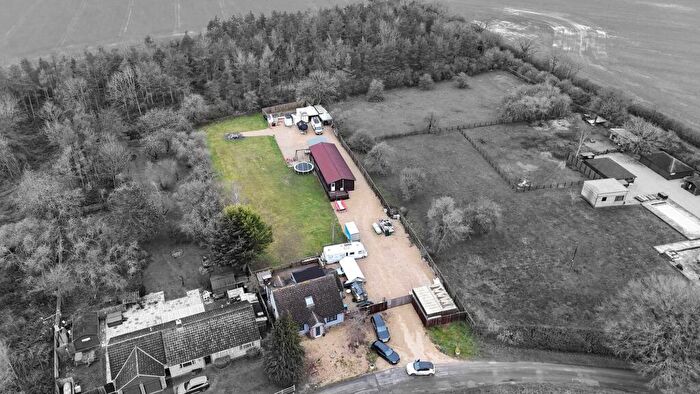
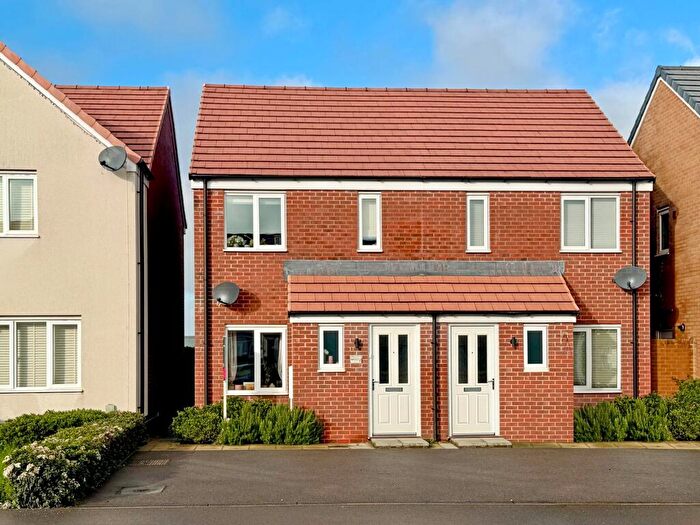
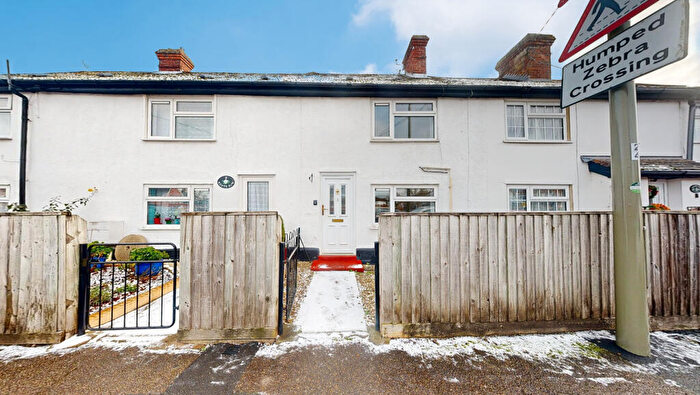
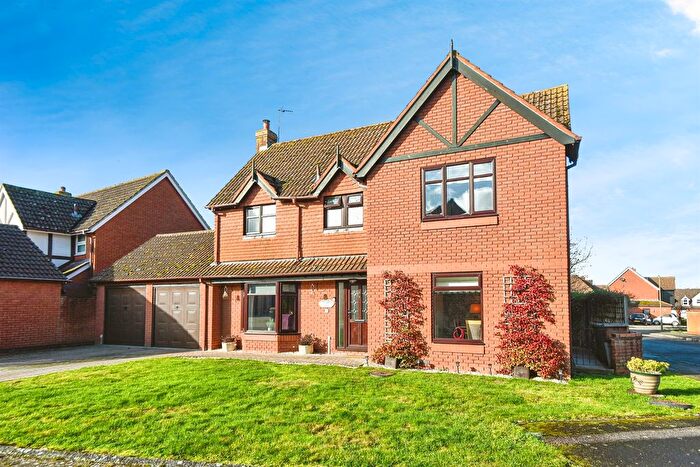
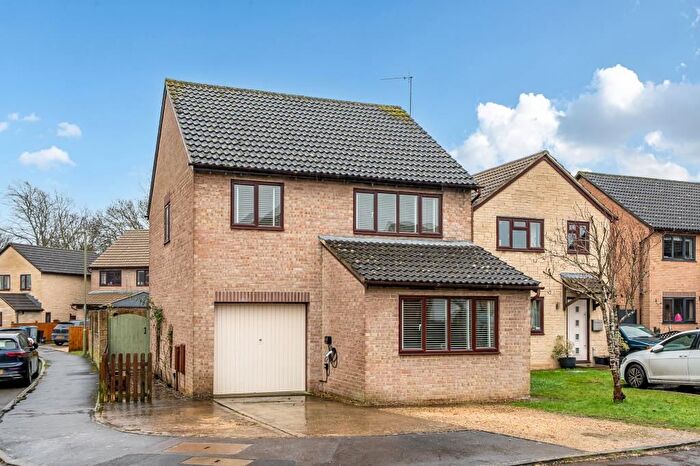
Properties for sale in Thames
Roads and Postcodes in Thames
Navigate through our locations to find the location of your next house in Thames, Abingdon for sale or to rent.
| Streets | Postcodes |
|---|---|
| Buckland | SN7 8PZ SN7 8QT |
| Buckland Park | SN7 8QX |
| Carswell Marsh | SN7 8JN |
| Church Lane | OX13 5DY |
| Church Road | OX13 5JL |
| Englands Lane | OX13 5JF |
| Faringdon Road | OX13 5HN |
| Harris's Lane | OX13 5EX |
| Hinton Road | OX13 5EE |
| Horseshoes Close | OX13 5LH |
| Longworth Road | OX13 5JA |
| Main Road | OX13 5LW |
| Oaks Caravan Park | OX13 5LJ |
| Rodney Place | OX13 5EN |
| Rowleigh Lane | OX13 5QA |
| St Thomas Close | SN7 8RP |
| The Huts | SN7 8QU |
| The Pound | OX13 5JY |
| Witney Road | OX13 5FU |
| OX13 5LZ OX13 5PZ OX13 5QD OX13 5QP OX13 5QU SN7 8EB SN7 8EE SN7 8EG SN7 8JP SN7 8JR SN7 8JS SN7 8JU SN7 8JX SN7 8PT SN7 8PU SN7 8RR SN7 8RZ SN7 8SA SN7 8SG OX13 5PN |
Transport near Thames
- FAQ
- Price Paid By Year
- Property Type Price
Frequently asked questions about Thames
What is the average price for a property for sale in Thames?
The average price for a property for sale in Thames is £620,000. This amount is 40% higher than the average price in Abingdon. There are 3,881 property listings for sale in Thames.
Which train stations are available in or near Thames?
Some of the train stations available in or near Thames are Oxford, Radley and Culham.
Property Price Paid in Thames by Year
The average sold property price by year was:
| Year | Average Sold Price | Price Change |
Sold Properties
|
|---|---|---|---|
| 2024 | £225,000 | -263% |
1 Property |
| 2023 | £817,500 | 2% |
2 Properties |
| 2021 | £800,266 | 10% |
3 Properties |
| 2020 | £720,000 | 26% |
4 Properties |
| 2017 | £531,000 | -32% |
2 Properties |
| 2016 | £700,000 | 45% |
2 Properties |
| 2015 | £384,000 | -60% |
1 Property |
| 2009 | £615,000 | 29% |
1 Property |
| 2005 | £435,000 | 28% |
1 Property |
| 2001 | £315,000 | -19% |
2 Properties |
| 2000 | £375,000 | 61% |
1 Property |
| 1999 | £145,000 | 20% |
2 Properties |
| 1997 | £115,825 | 63% |
1 Property |
| 1995 | £42,500 | - |
1 Property |
Property Price per Property Type in Thames
Here you can find historic sold price data in order to help with your property search.
The average Property Paid Price for specific property types in the last three years are:
| Property Type | Average Sold Price | Sold Properties |
|---|---|---|
| Semi Detached House | £695,000.00 | 1 Semi Detached House |
| Terraced House | £582,500.00 | 2 Terraced Houses |

