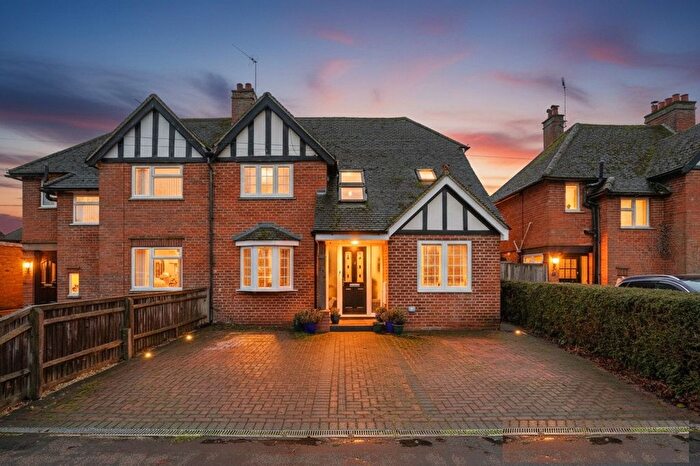
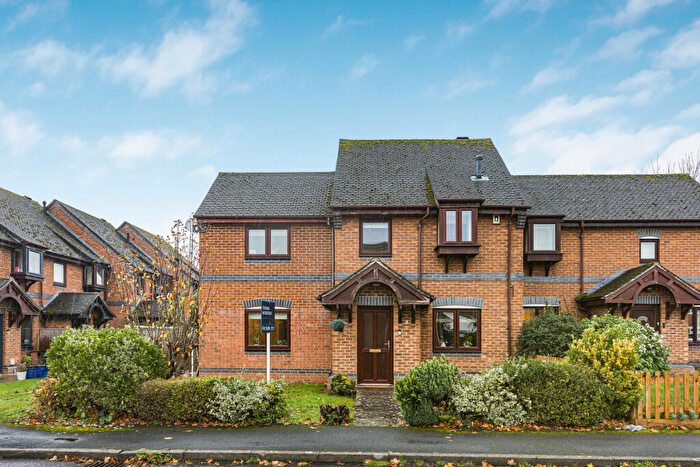
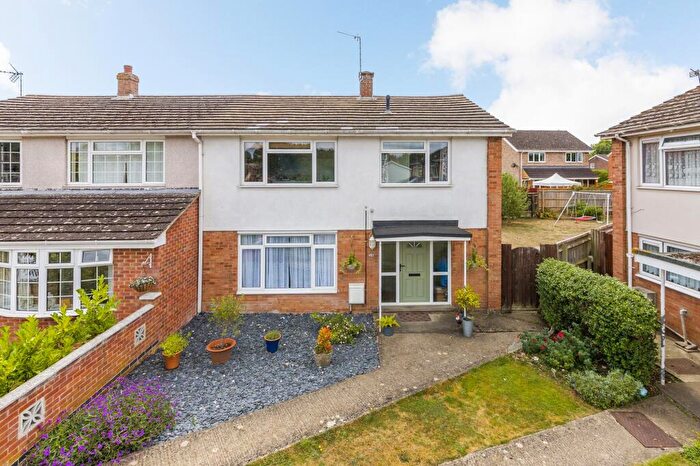
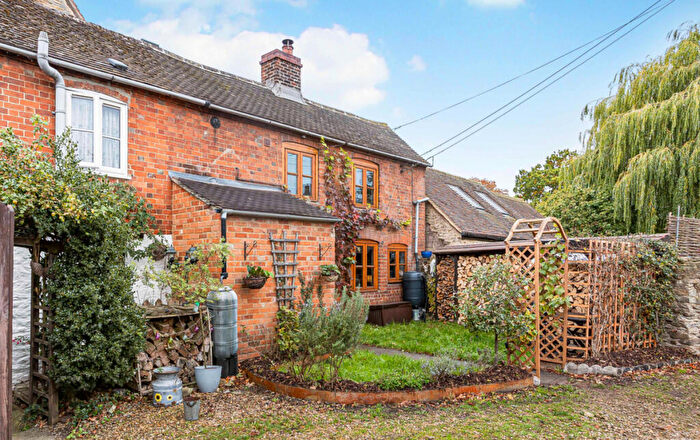
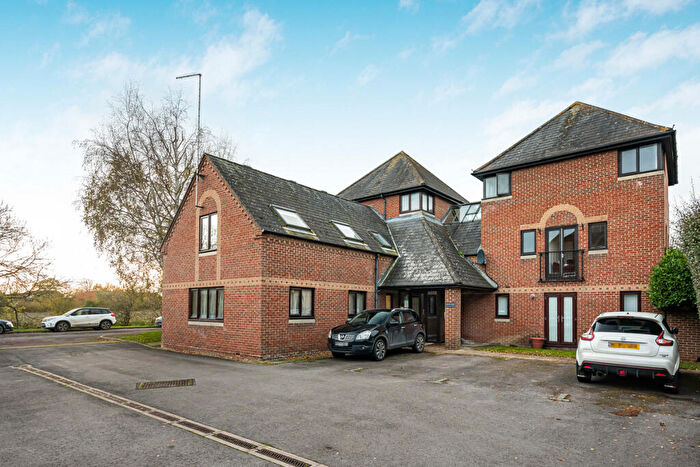
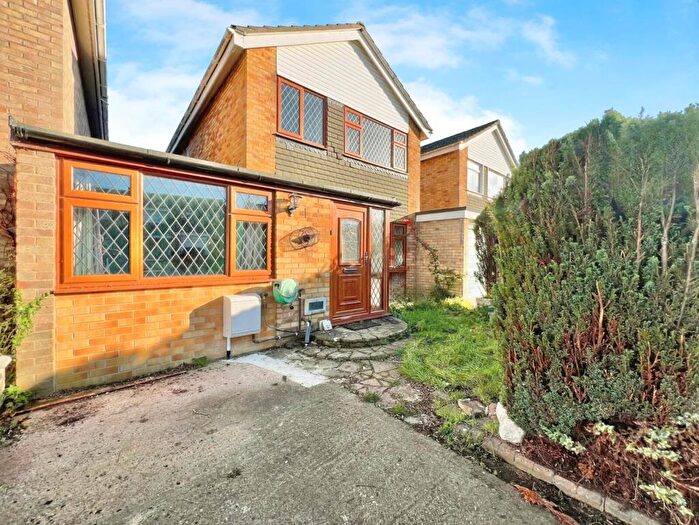
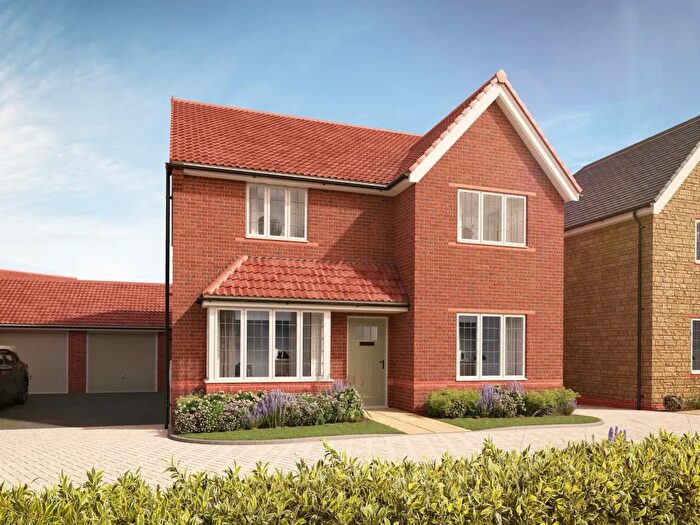
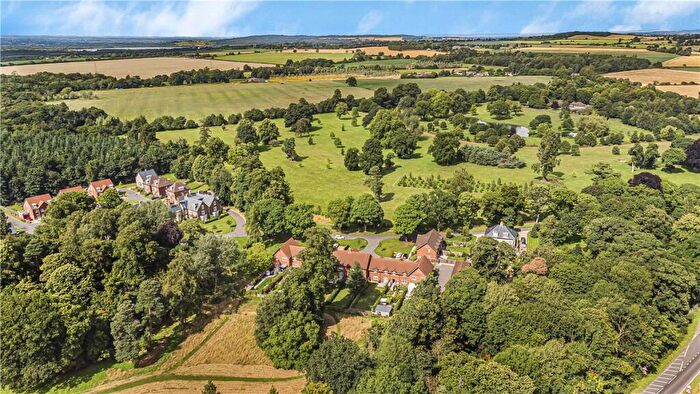
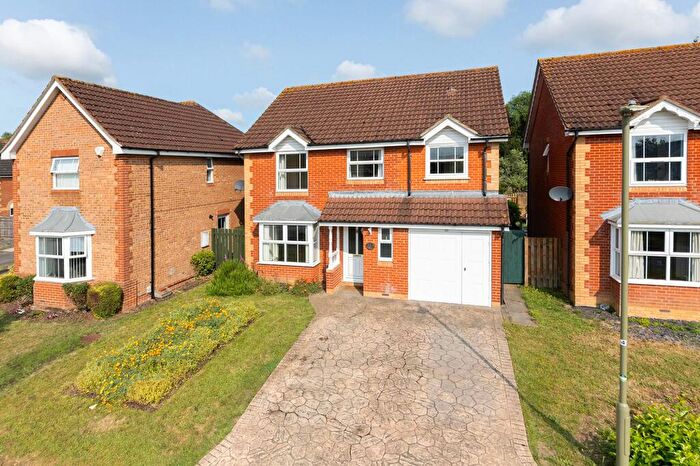
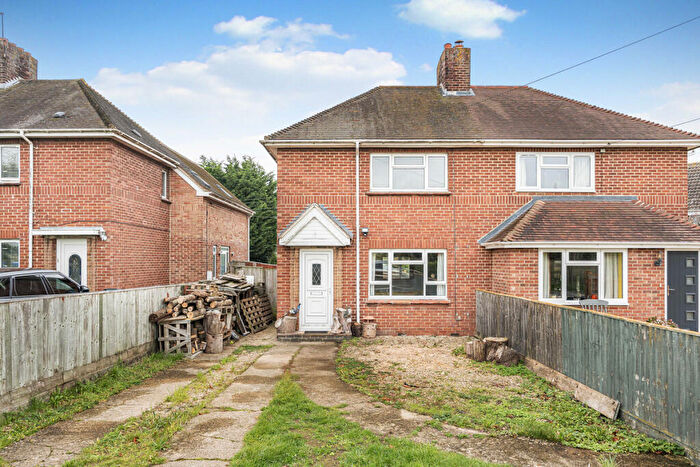
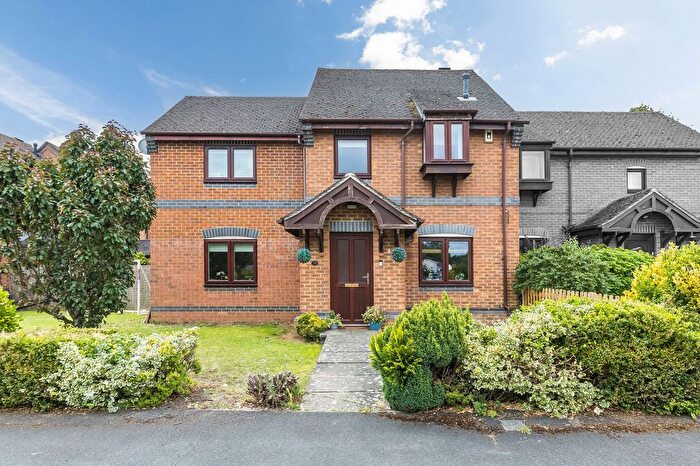
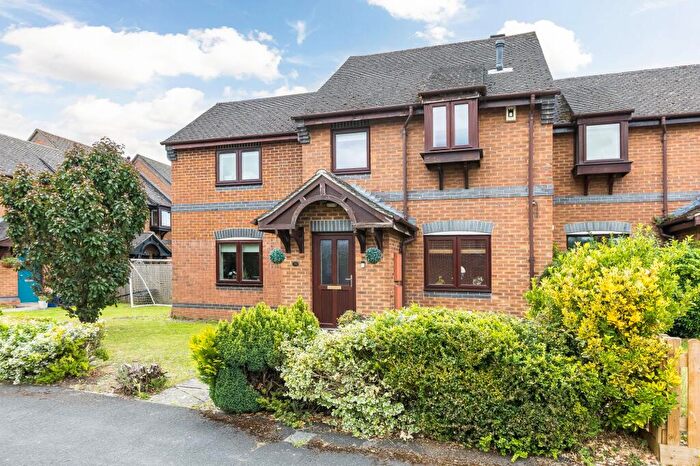
Houses for sale & to rent in Marcham And Shippon, Abingdon
House Prices in Marcham And Shippon
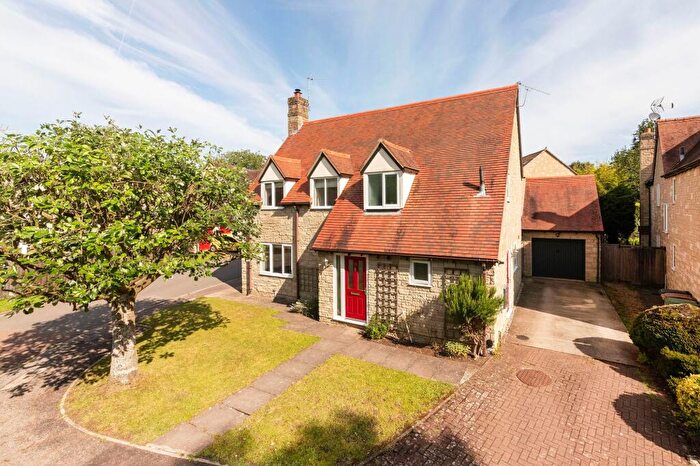
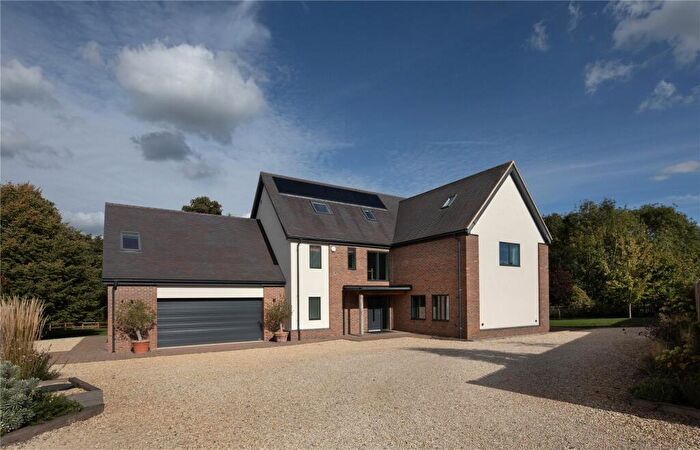
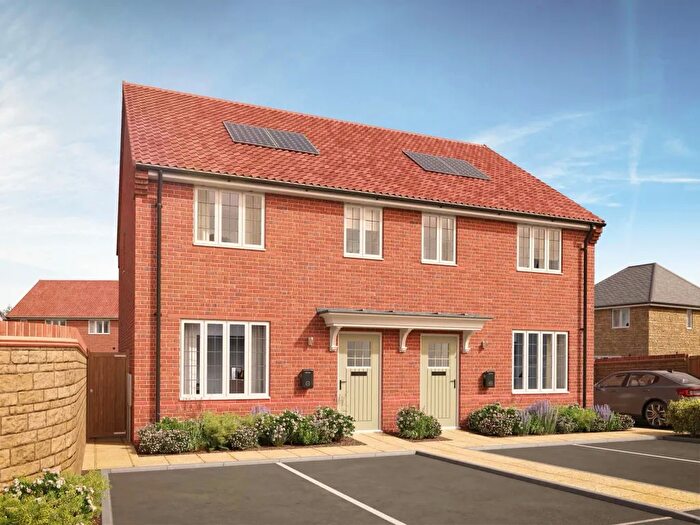
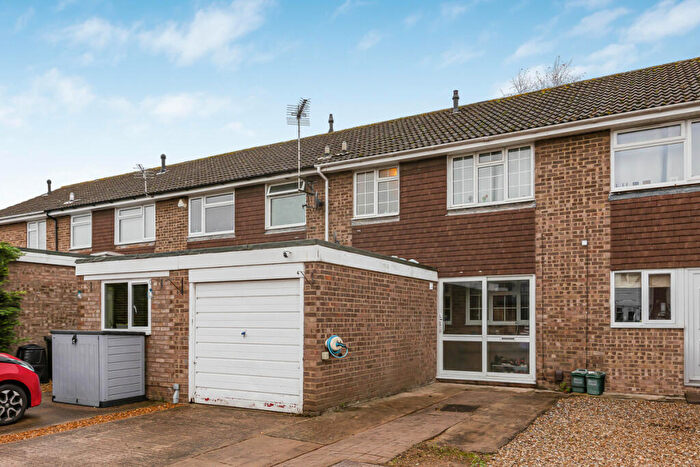
Properties in Marcham And Shippon have an average house price of £619,966.00 and had 90 Property Transactions within the last 3 years¹.
Marcham And Shippon is an area in Abingdon, Oxfordshire with 868 households², where the most expensive property was sold for £4,823,000.00.
Properties for sale in Marcham And Shippon
Roads and Postcodes in Marcham And Shippon
Navigate through our locations to find the location of your next house in Marcham And Shippon, Abingdon for sale or to rent.
| Streets | Postcodes |
|---|---|
| Abingdon Road | OX13 6NU OX13 6NX |
| All Saints Close | OX13 6PE |
| Anson Close | OX13 6QF |
| Barrow Road | OX13 6JF OX13 6JQ |
| Chancel Way | OX13 6QB |
| Cholswell Road | OX13 6HW |
| Church Street | OX13 6NP |
| Cothill | OX13 6JN |
| Cothill Road | OX13 6QQ |
| Elm Tree Walk | OX13 6LX |
| Elwes Road | OX13 6PR |
| Faringdon Road | OX13 6LN OX13 6LT OX13 6LW OX13 6QJ |
| Fettiplace Road | OX13 6PL |
| Frilford Heath | OX13 5QG |
| Frilford Road | OX13 6NR OX13 6NS |
| Gozzards Ford | OX13 6JH |
| Haines Court | OX13 6PN |
| Howard Cornish Road | OX13 6PH OX13 6PU OX13 6PW |
| Hyde Copse | OX13 6PT |
| Kings Avenue | OX13 6QA |
| Longfields | OX13 6QP |
| Mill Road | OX13 6NZ OX13 6PB |
| Morland Road | OX13 6PY |
| New Road | OX13 6NL |
| North Street | OX13 6NG OX13 6NQ |
| Oakley Park | OX13 6QW |
| Orchard Way | OX13 6PP OX13 6PS |
| Packhorse Lane | OX13 6NT |
| Parkside | OX13 6NN |
| Priory Lane | OX13 6NY |
| Rookery Close | OX13 6LY OX13 6LZ |
| Sheepstead Road | OX13 6QG |
| Sweet Briar | OX13 6PD |
| Sycamore Close | OX13 6ER |
| The Croft | OX13 6NF |
| The Farthings | OX13 6QD |
| The Gap | OX13 6NJ |
| The Green | OX13 6NE |
| Tower Close | OX13 6PZ |
| Wantage Road | OX13 5NY |
| White House Close | OX13 6LP |
| Willow Tree Close | OX13 6LU |
| OX13 6UX |
Transport near Marcham And Shippon
- FAQ
- Price Paid By Year
- Property Type Price
Frequently asked questions about Marcham And Shippon
What is the average price for a property for sale in Marcham And Shippon?
The average price for a property for sale in Marcham And Shippon is £619,966. This amount is 39% higher than the average price in Abingdon. There are 1,565 property listings for sale in Marcham And Shippon.
What streets have the most expensive properties for sale in Marcham And Shippon?
The streets with the most expensive properties for sale in Marcham And Shippon are Frilford Heath at an average of £2,641,000, Sycamore Close at an average of £1,360,000 and Sheepstead Road at an average of £1,250,000.
What streets have the most affordable properties for sale in Marcham And Shippon?
The streets with the most affordable properties for sale in Marcham And Shippon are Sweet Briar at an average of £135,408, Longfields at an average of £231,150 and Frilford Road at an average of £235,750.
Which train stations are available in or near Marcham And Shippon?
Some of the train stations available in or near Marcham And Shippon are Radley, Culham and Appleford.
Property Price Paid in Marcham And Shippon by Year
The average sold property price by year was:
| Year | Average Sold Price | Price Change |
Sold Properties
|
|---|---|---|---|
| 2025 | £494,000 | - |
12 Properties |
| 2024 | £494,214 | -50% |
21 Properties |
| 2023 | £741,955 | 13% |
28 Properties |
| 2022 | £645,370 | 30% |
29 Properties |
| 2021 | £452,484 | -26% |
33 Properties |
| 2020 | £568,583 | 33% |
36 Properties |
| 2019 | £383,137 | -6% |
29 Properties |
| 2018 | £407,038 | 11% |
33 Properties |
| 2017 | £364,083 | -9% |
24 Properties |
| 2016 | £397,796 | -14% |
31 Properties |
| 2015 | £453,450 | 17% |
30 Properties |
| 2014 | £374,294 | 10% |
29 Properties |
| 2013 | £337,735 | -20% |
21 Properties |
| 2012 | £405,904 | 9% |
32 Properties |
| 2011 | £369,847 | 4% |
23 Properties |
| 2010 | £356,551 | -1% |
25 Properties |
| 2009 | £359,361 | 11% |
18 Properties |
| 2008 | £320,280 | -5% |
25 Properties |
| 2007 | £335,997 | -13% |
31 Properties |
| 2006 | £378,902 | 15% |
36 Properties |
| 2005 | £320,283 | 11% |
30 Properties |
| 2004 | £283,911 | -0,2% |
35 Properties |
| 2003 | £284,413 | 29% |
23 Properties |
| 2002 | £202,686 | 2% |
44 Properties |
| 2001 | £199,281 | 12% |
38 Properties |
| 2000 | £175,358 | 9% |
29 Properties |
| 1999 | £160,090 | -3% |
42 Properties |
| 1998 | £164,462 | 15% |
37 Properties |
| 1997 | £139,726 | 22% |
30 Properties |
| 1996 | £109,456 | 1% |
32 Properties |
| 1995 | £108,181 | - |
22 Properties |
Property Price per Property Type in Marcham And Shippon
Here you can find historic sold price data in order to help with your property search.
The average Property Paid Price for specific property types in the last three years are:
| Property Type | Average Sold Price | Sold Properties |
|---|---|---|
| Semi Detached House | £400,097.00 | 17 Semi Detached Houses |
| Detached House | £833,513.00 | 50 Detached Houses |
| Terraced House | £382,779.00 | 17 Terraced Houses |
| Flat | £135,408.00 | 6 Flats |

