Houses for sale & to rent in Sunningwell And Wootton, Abingdon
House Prices in Sunningwell And Wootton
Properties in Sunningwell And Wootton have an average house price of £548,657.00 and had 100 Property Transactions within the last 3 years¹.
Sunningwell And Wootton is an area in Abingdon, Oxfordshire with 1,096 households², where the most expensive property was sold for £3,350,000.00.
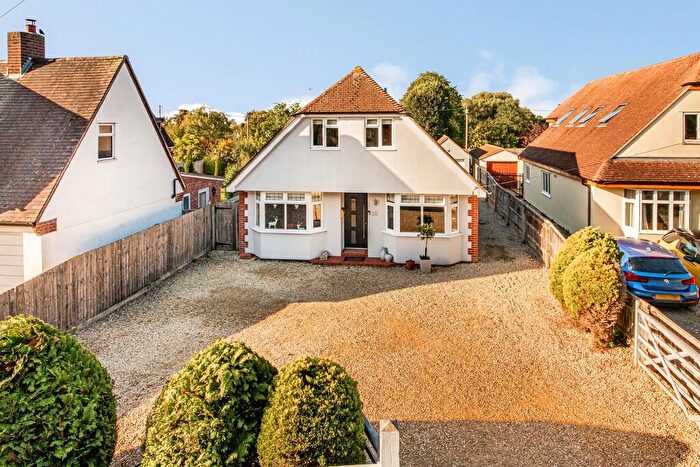
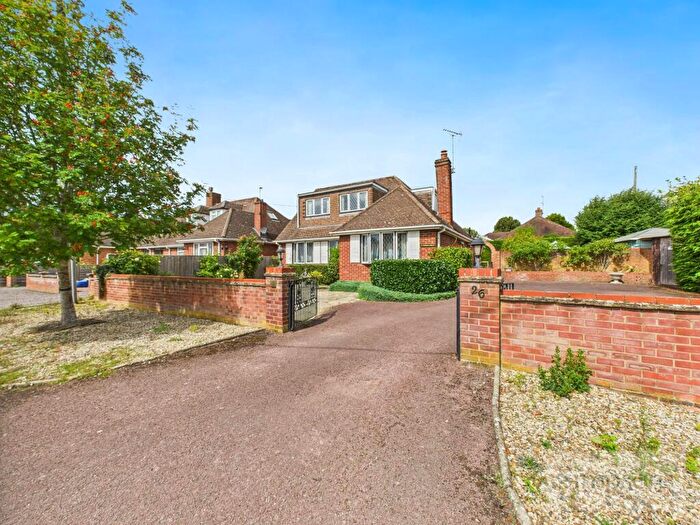
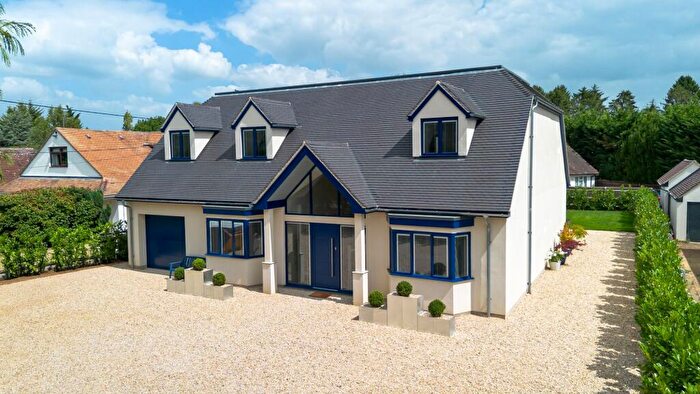
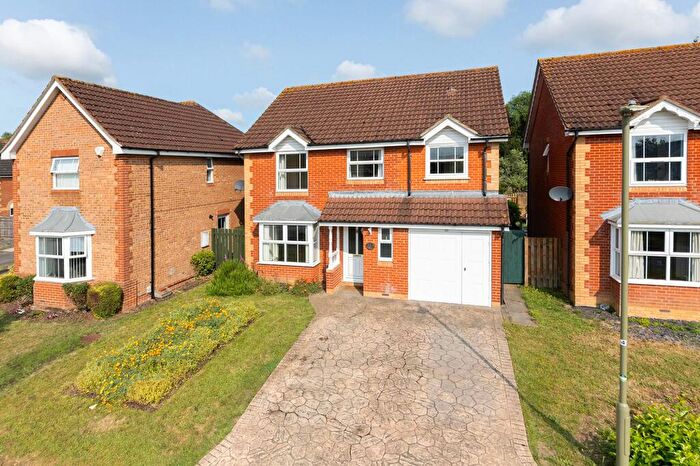
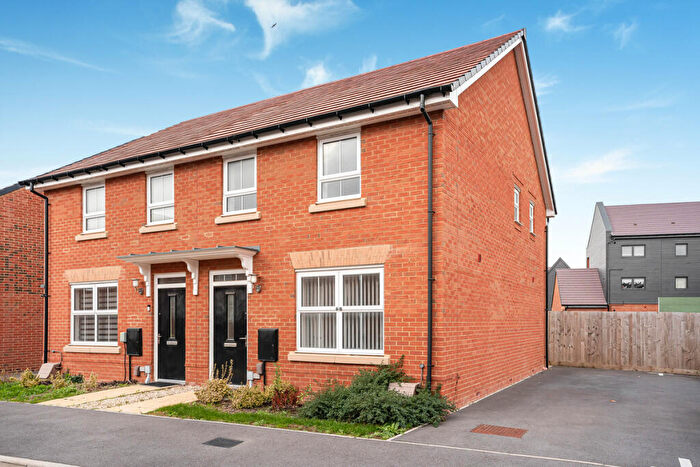
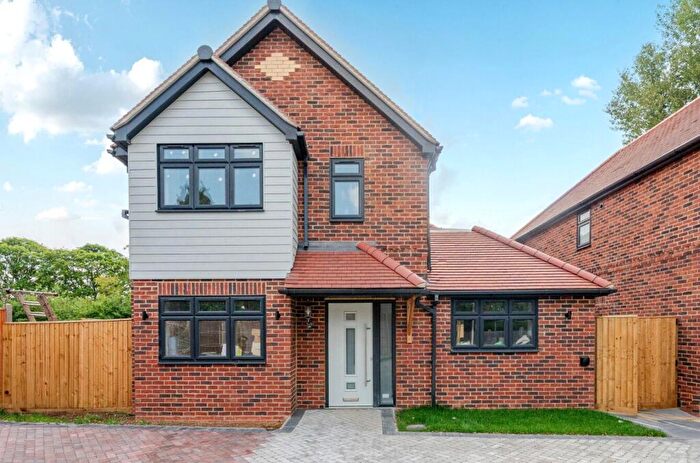
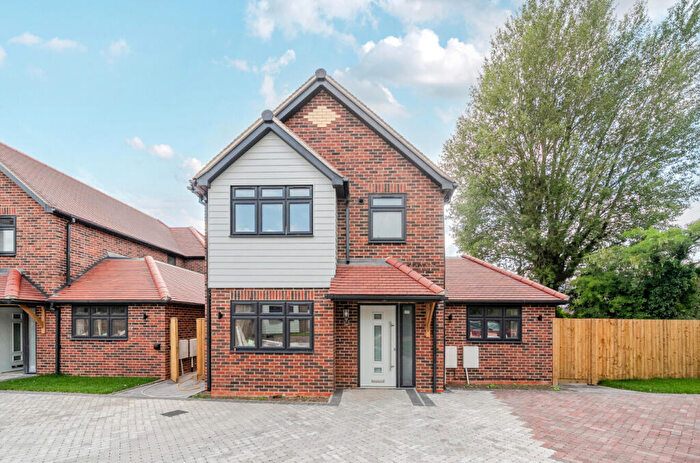
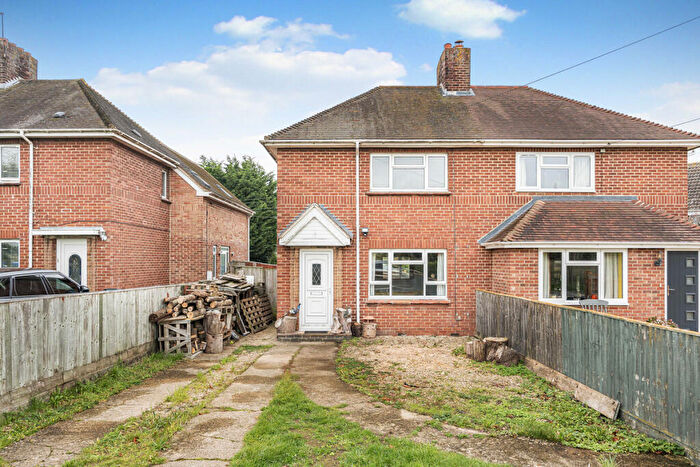
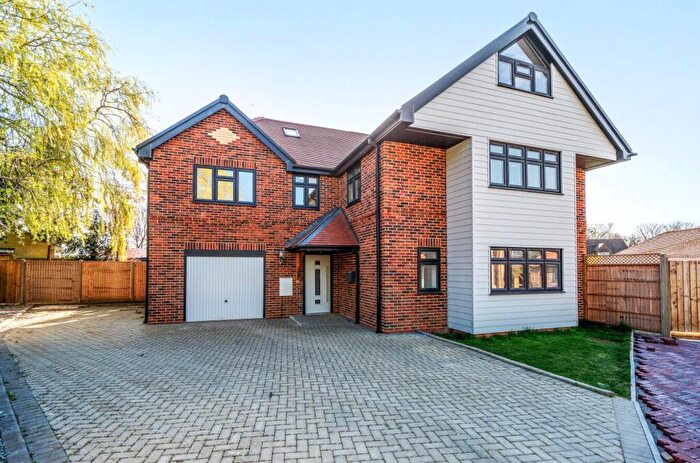
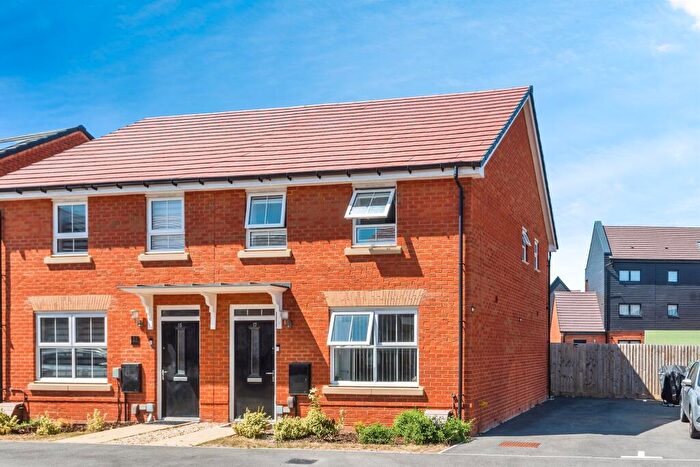
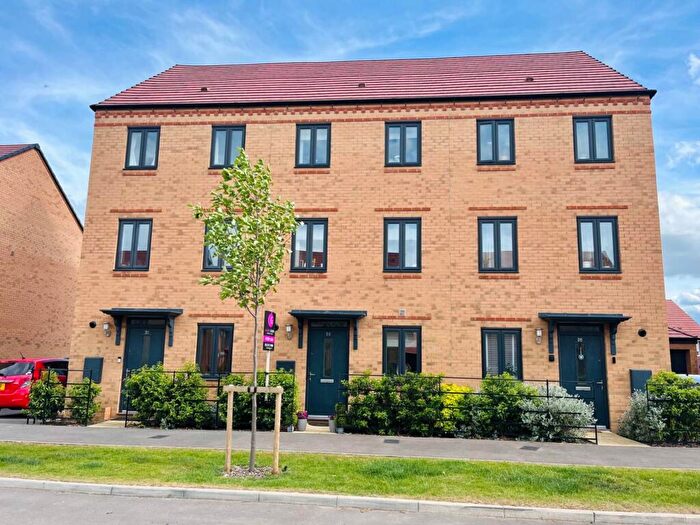
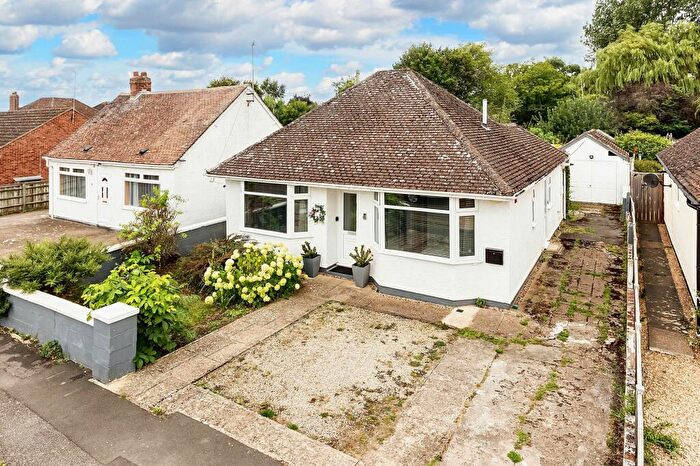
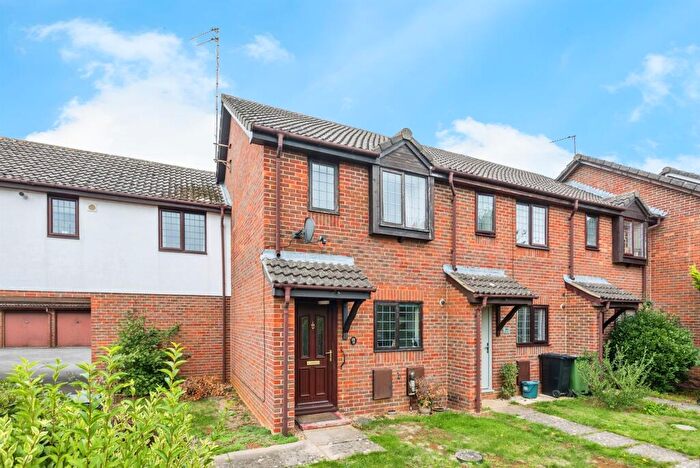
Properties for sale in Sunningwell And Wootton
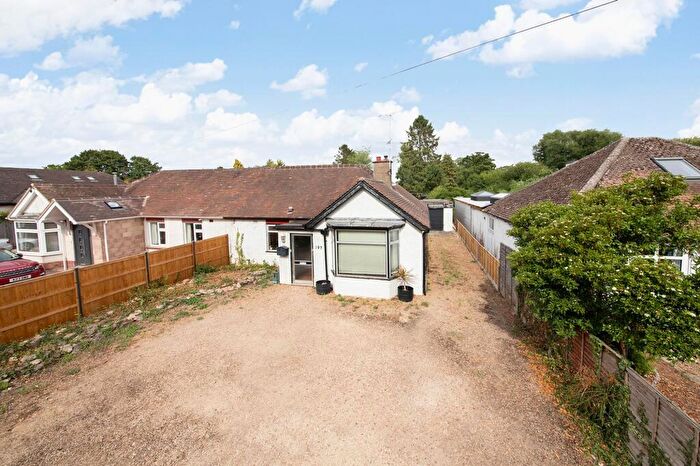
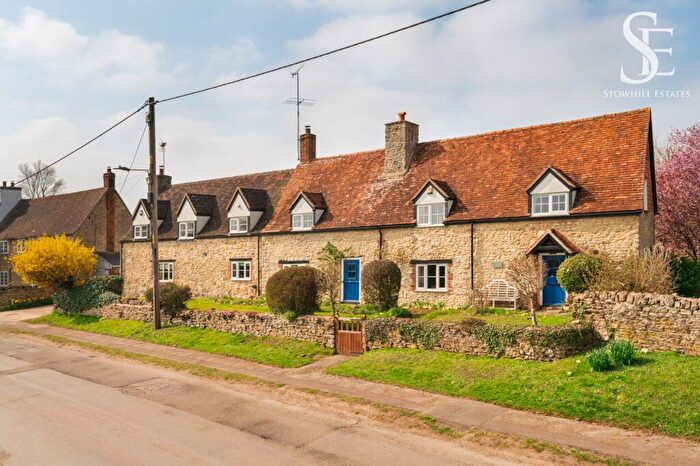
Previously listed properties in Sunningwell And Wootton
Roads and Postcodes in Sunningwell And Wootton
Navigate through our locations to find the location of your next house in Sunningwell And Wootton, Abingdon for sale or to rent.
| Streets | Postcodes |
|---|---|
| Arthur Evans Close | OX13 6LE |
| Beaulieu Court | OX13 6RQ |
| Beech Close | OX13 6DQ |
| Besselsleigh Road | OX13 6DN OX13 6DW OX13 6DX |
| Brumcombe Lane | OX13 6QT OX13 6QU |
| Bullsmead | OX13 6RL |
| Candy Way | OX13 6LF |
| Church Lane | OX13 6JP |
| Cothill Road | OX13 6JW |
| Coupland Road | OX13 6DU |
| Dark Lane | OX13 6RE |
| Fox Lane | OX13 6DE |
| Green Lane | OX13 6RG |
| Hawkins Way | OX13 6LA OX13 6LB |
| Home Close | OX13 6DB OX13 6DD |
| Honeybottom Lane | OX13 6BX |
| Huxley Close | OX13 6JZ |
| Lamborough Hill | OX13 6BY OX13 6BZ |
| Lansdowne Road | OX13 6EA |
| Lashford Lane | OX13 6DY OX13 6DZ OX13 6EB |
| Leigh Croft | OX13 6DL |
| Long Furlong Road | OX13 6BL |
| Manor Road | OX13 6DG |
| Mathews Way | OX13 6JU OX13 6JX |
| Mitchell Close | OX13 6DR |
| Parsons Close | OX13 6FE |
| Quarry Road | OX13 6QY |
| Sandleigh Road | OX13 6DP |
| St Peters Close | OX13 6LD |
| Sunningwell Road | OX13 6BJ |
| The Field | OX13 6ED |
| The Old Pound | OX13 6BQ |
| Watson Crescent | OX13 6DS |
| Whitecross | OX13 6BP OX13 6BS OX13 6BT OX13 6BU OX13 6BW |
| OX13 5PU OX13 5PX OX13 5PY OX13 6BN OX13 6RB OX13 6RD OX13 6RH |
Transport near Sunningwell And Wootton
- FAQ
- Price Paid By Year
- Property Type Price
Frequently asked questions about Sunningwell And Wootton
What is the average price for a property for sale in Sunningwell And Wootton?
The average price for a property for sale in Sunningwell And Wootton is £548,657. This amount is 23% higher than the average price in Abingdon. There are 630 property listings for sale in Sunningwell And Wootton.
What streets have the most expensive properties for sale in Sunningwell And Wootton?
The streets with the most expensive properties for sale in Sunningwell And Wootton are Brumcombe Lane at an average of £1,227,500, Church Lane at an average of £1,092,500 and Beech Close at an average of £670,000.
What streets have the most affordable properties for sale in Sunningwell And Wootton?
The streets with the most affordable properties for sale in Sunningwell And Wootton are Mitchell Close at an average of £303,333, Watson Crescent at an average of £331,250 and St Peters Close at an average of £355,000.
Which train stations are available in or near Sunningwell And Wootton?
Some of the train stations available in or near Sunningwell And Wootton are Radley, Oxford and Culham.
Property Price Paid in Sunningwell And Wootton by Year
The average sold property price by year was:
| Year | Average Sold Price | Price Change |
Sold Properties
|
|---|---|---|---|
| 2025 | £410,911 | -49% |
17 Properties |
| 2024 | £611,535 | 14% |
27 Properties |
| 2023 | £525,373 | -12% |
25 Properties |
| 2022 | £588,209 | 8% |
31 Properties |
| 2021 | £541,742 | -5% |
35 Properties |
| 2020 | £568,138 | 18% |
28 Properties |
| 2019 | £465,443 | 7% |
40 Properties |
| 2018 | £431,712 | -8% |
41 Properties |
| 2017 | £467,281 | 8% |
25 Properties |
| 2016 | £431,410 | -3% |
20 Properties |
| 2015 | £442,203 | 12% |
32 Properties |
| 2014 | £390,198 | -8% |
40 Properties |
| 2013 | £419,630 | 26% |
40 Properties |
| 2012 | £312,346 | -8% |
30 Properties |
| 2011 | £337,030 | -24% |
15 Properties |
| 2010 | £418,618 | 16% |
33 Properties |
| 2009 | £350,338 | 2% |
31 Properties |
| 2008 | £343,197 | -9% |
24 Properties |
| 2007 | £375,368 | 17% |
48 Properties |
| 2006 | £312,163 | 9% |
48 Properties |
| 2005 | £285,236 | -19% |
42 Properties |
| 2004 | £339,101 | 22% |
45 Properties |
| 2003 | £265,285 | 23% |
47 Properties |
| 2002 | £205,309 | -7% |
68 Properties |
| 2001 | £219,989 | 21% |
52 Properties |
| 2000 | £173,577 | 11% |
50 Properties |
| 1999 | £155,136 | 3% |
46 Properties |
| 1998 | £149,793 | 19% |
85 Properties |
| 1997 | £121,815 | 10% |
44 Properties |
| 1996 | £109,087 | 0,5% |
49 Properties |
| 1995 | £108,581 | - |
42 Properties |
Property Price per Property Type in Sunningwell And Wootton
Here you can find historic sold price data in order to help with your property search.
The average Property Paid Price for specific property types in the last three years are:
| Property Type | Average Sold Price | Sold Properties |
|---|---|---|
| Semi Detached House | £448,057.00 | 33 Semi Detached Houses |
| Detached House | £679,801.00 | 51 Detached Houses |
| Terraced House | £375,416.00 | 12 Terraced Houses |
| Flat | £226,250.00 | 4 Flats |

