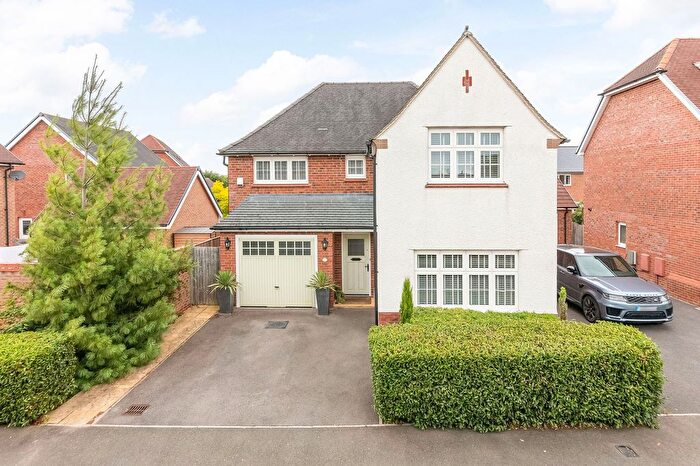
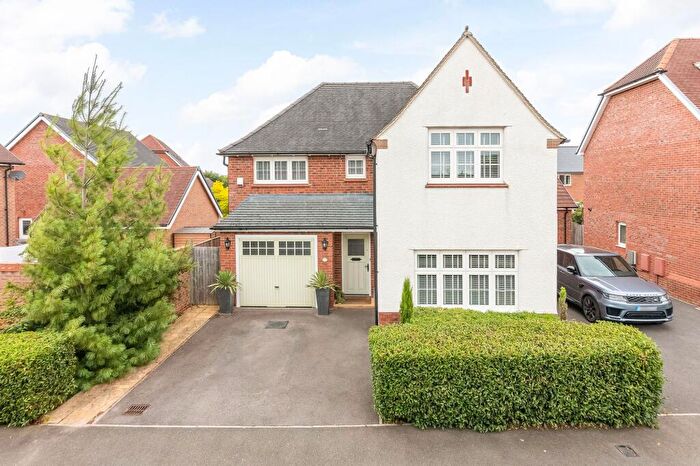
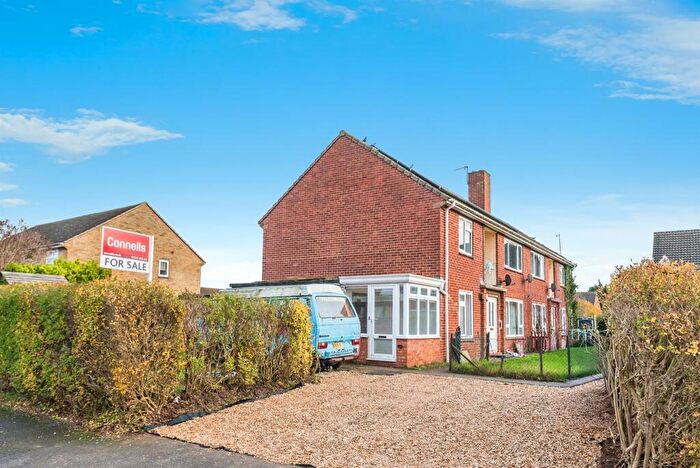
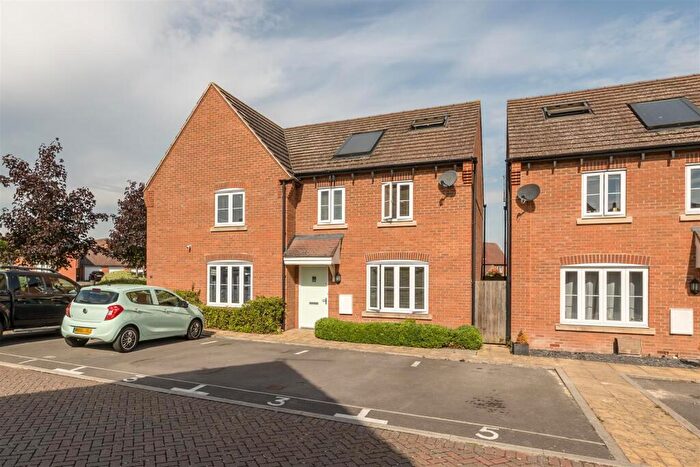
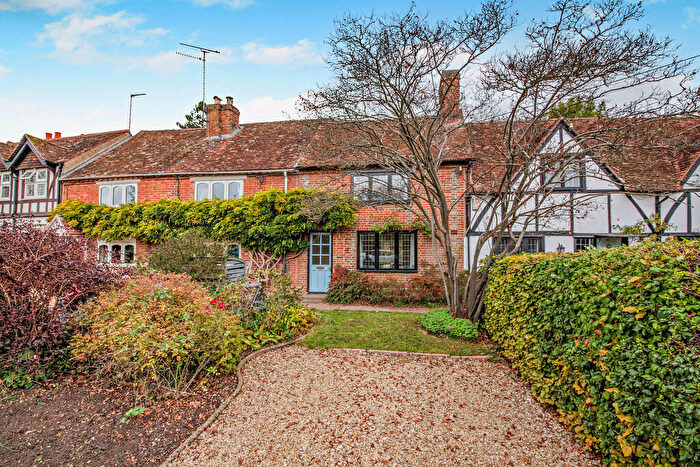
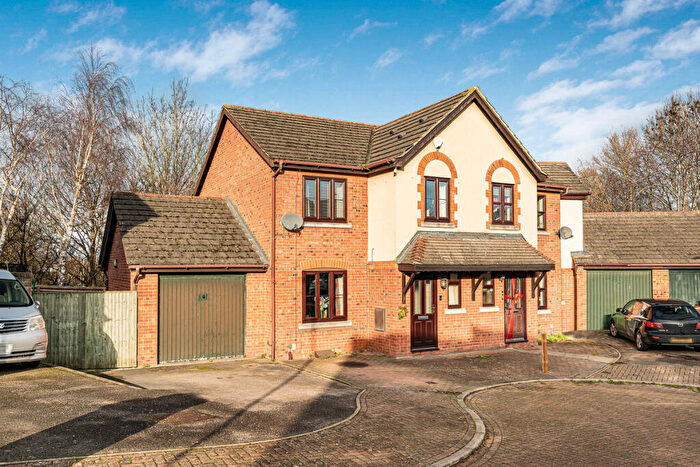
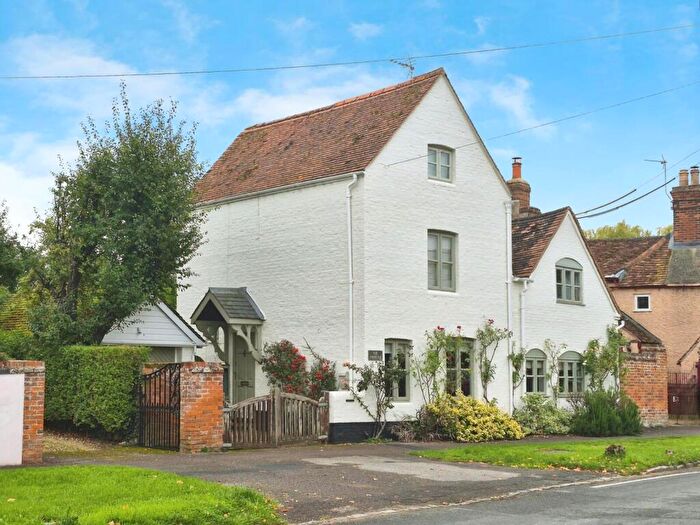
Houses for sale & to rent in Sutton Courtenay And Appleford, Abingdon
House Prices in Sutton Courtenay And Appleford
Properties in Sutton Courtenay And Appleford have an average house price of £622,102.00 and had 150 Property Transactions within the last 3 years¹.
Sutton Courtenay And Appleford is an area in Abingdon, Oxfordshire with 1,140 households², where the most expensive property was sold for £3,700,000.00.
Properties for sale in Sutton Courtenay And Appleford
Roads and Postcodes in Sutton Courtenay And Appleford
Navigate through our locations to find the location of your next house in Sutton Courtenay And Appleford, Abingdon for sale or to rent.
| Streets | Postcodes |
|---|---|
| Abingdon Road | OX14 4NF |
| Amey Close | OX14 4LW |
| Appleford Road | OX14 4NG OX14 4NH OX14 4NQ OX14 4NR |
| Barretts Way | OX14 4DD OX14 4DE |
| Bradstocks Way | OX14 4BY OX14 4BZ OX14 4DA OX14 4DB |
| Brook Street | OX14 4AH |
| Chambrai Close | OX14 4NT |
| Chapel Lane | OX14 4AN |
| Church Street | OX14 4AD OX14 4NJ OX14 4NX OX14 4PA |
| Churchmere Road | OX14 4AQ |
| Courtenay Close | OX14 4AU |
| Drayton Road | OX14 4AJ OX14 4HA OX14 4HB |
| Frilsham Street | OX14 4AZ |
| Ginge Brook | OX14 4AL |
| Harwell Road | OX14 4BN OX14 4BW |
| High Street | OX14 4AP OX14 4AS OX14 4AT OX14 4AW OX14 4AX OX14 4BJ OX14 4BQ |
| Hobbyhorse Lane | OX14 4BB |
| Katchside | OX14 4BH |
| Lady Place | OX14 4FB |
| Main Road | OX14 4NU OX14 4PD OX14 4PF OX14 4PG |
| Manor Close | OX14 4NZ |
| Mill Lane | OX14 4BE |
| Milton Road | OX14 4BP OX14 4BS OX14 4BT OX14 4BX |
| Old Wallingford Way | OX14 4AR |
| School Lane | OX14 4NY |
| Sinodun Row | OX14 4PE |
| Southfield Drive | OX14 4AY |
| St Peters Court | OX14 4YA |
| The Coal Yard | OX14 4AG |
| The Green | OX14 4AE |
| The Nursery | OX14 4UA |
| Town Close | OX14 4BA |
| Tullis Close | OX14 4BD |
| Tyrrells Way | OX14 4DF OX14 4DH |
| OX14 4NS OX14 4PH |
Transport near Sutton Courtenay And Appleford
- FAQ
- Price Paid By Year
- Property Type Price
Frequently asked questions about Sutton Courtenay And Appleford
What is the average price for a property for sale in Sutton Courtenay And Appleford?
The average price for a property for sale in Sutton Courtenay And Appleford is £622,102. This amount is 40% higher than the average price in Abingdon. There are 982 property listings for sale in Sutton Courtenay And Appleford.
What streets have the most expensive properties for sale in Sutton Courtenay And Appleford?
The streets with the most expensive properties for sale in Sutton Courtenay And Appleford are The Coal Yard at an average of £1,927,500, Brook Street at an average of £1,845,000 and Church Street at an average of £1,163,325.
What streets have the most affordable properties for sale in Sutton Courtenay And Appleford?
The streets with the most affordable properties for sale in Sutton Courtenay And Appleford are Abingdon Road at an average of £268,333, Bradstocks Way at an average of £315,607 and Tyrrells Way at an average of £325,562.
Which train stations are available in or near Sutton Courtenay And Appleford?
Some of the train stations available in or near Sutton Courtenay And Appleford are Appleford, Culham and Didcot Parkway.
Property Price Paid in Sutton Courtenay And Appleford by Year
The average sold property price by year was:
| Year | Average Sold Price | Price Change |
Sold Properties
|
|---|---|---|---|
| 2025 | £580,367 | -20% |
23 Properties |
| 2024 | £697,640 | 15% |
41 Properties |
| 2023 | £593,617 | -1% |
47 Properties |
| 2022 | £601,633 | 10% |
39 Properties |
| 2021 | £539,242 | -6% |
54 Properties |
| 2020 | £574,279 | 22% |
43 Properties |
| 2019 | £446,529 | 2% |
50 Properties |
| 2018 | £438,870 | -12% |
45 Properties |
| 2017 | £492,019 | 15% |
48 Properties |
| 2016 | £417,158 | 4% |
37 Properties |
| 2015 | £401,859 | 7% |
42 Properties |
| 2014 | £372,379 | -6% |
46 Properties |
| 2013 | £393,120 | -12% |
49 Properties |
| 2012 | £438,643 | 32% |
37 Properties |
| 2011 | £297,322 | -34% |
26 Properties |
| 2010 | £397,876 | -1% |
32 Properties |
| 2009 | £401,546 | -18% |
23 Properties |
| 2008 | £475,480 | 9% |
25 Properties |
| 2007 | £431,293 | 33% |
45 Properties |
| 2006 | £287,119 | -12% |
56 Properties |
| 2005 | £322,686 | 6% |
29 Properties |
| 2004 | £303,231 | 19% |
47 Properties |
| 2003 | £246,797 | 4% |
40 Properties |
| 2002 | £235,816 | 17% |
43 Properties |
| 2001 | £196,588 | -54% |
73 Properties |
| 2000 | £303,682 | 43% |
51 Properties |
| 1999 | £171,763 | 1% |
57 Properties |
| 1998 | £170,186 | 33% |
45 Properties |
| 1997 | £113,969 | 12% |
39 Properties |
| 1996 | £100,206 | -5% |
37 Properties |
| 1995 | £104,812 | - |
36 Properties |
Property Price per Property Type in Sutton Courtenay And Appleford
Here you can find historic sold price data in order to help with your property search.
The average Property Paid Price for specific property types in the last three years are:
| Property Type | Average Sold Price | Sold Properties |
|---|---|---|
| Semi Detached House | £457,294.00 | 39 Semi Detached Houses |
| Detached House | £842,742.00 | 76 Detached Houses |
| Terraced House | £371,269.00 | 26 Terraced Houses |
| Flat | £197,722.00 | 9 Flats |

