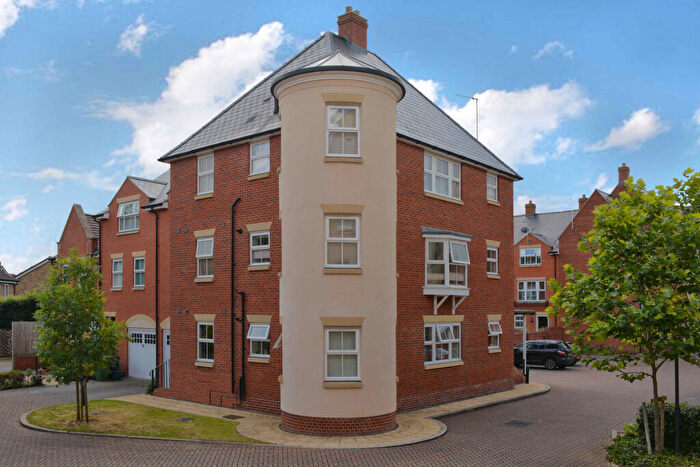
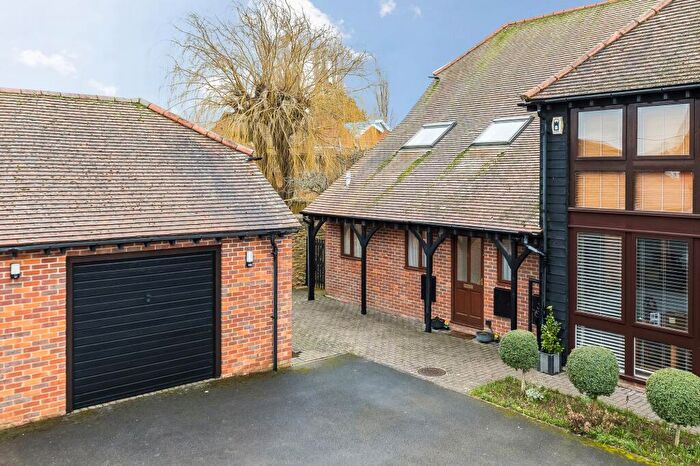
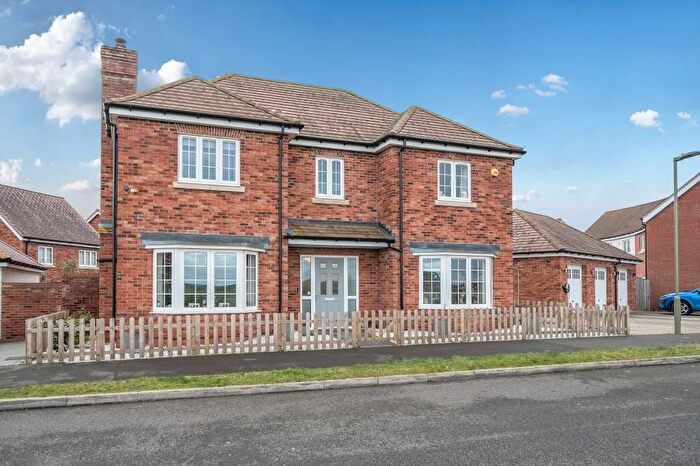
Houses for sale & to rent in Drayton, Abingdon
House Prices in Drayton
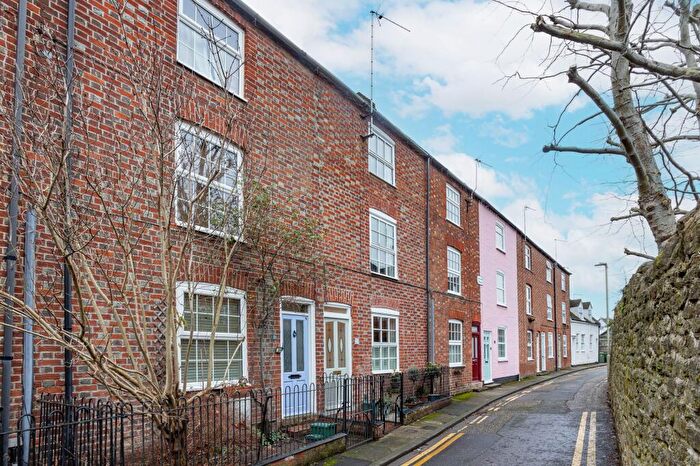
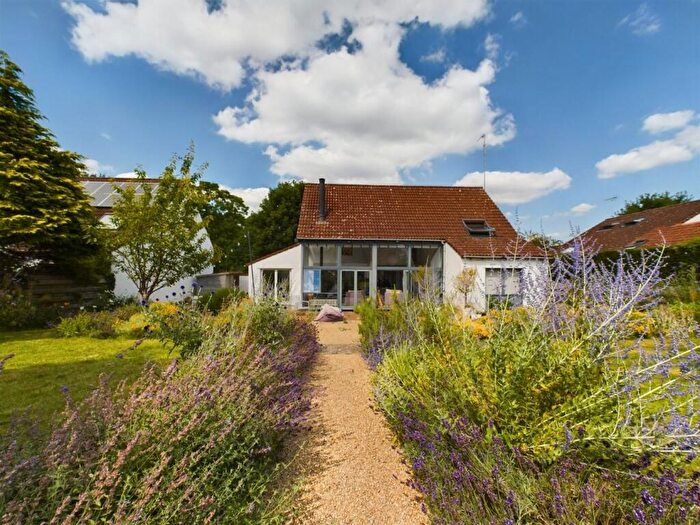
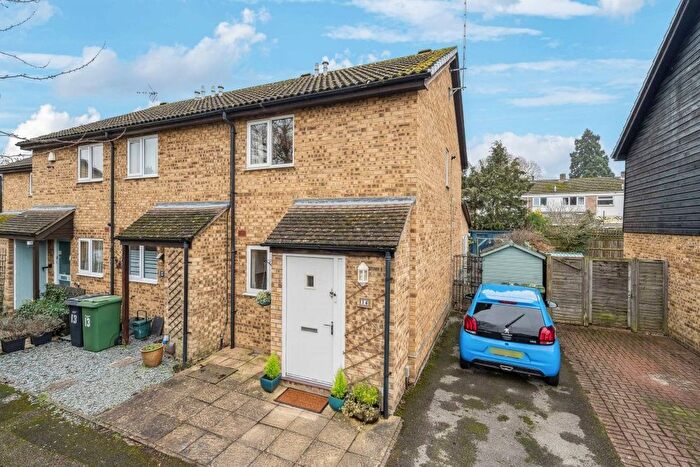
Properties in Drayton have an average house price of £482,112.00 and had 101 Property Transactions within the last 3 years¹.
Drayton is an area in Abingdon, Oxfordshire with 975 households², where the most expensive property was sold for £1,572,000.00.
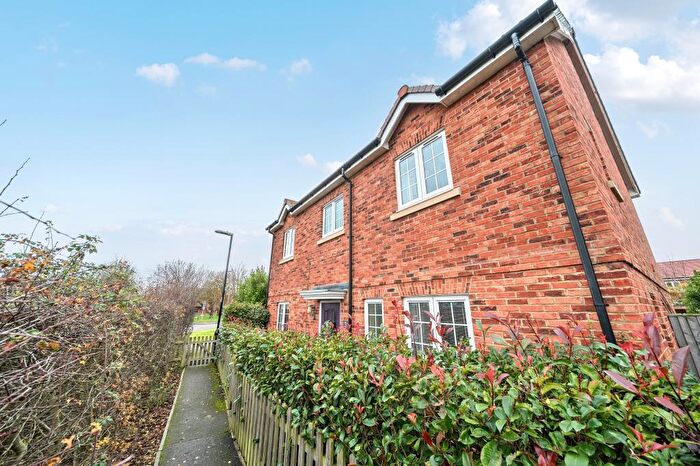
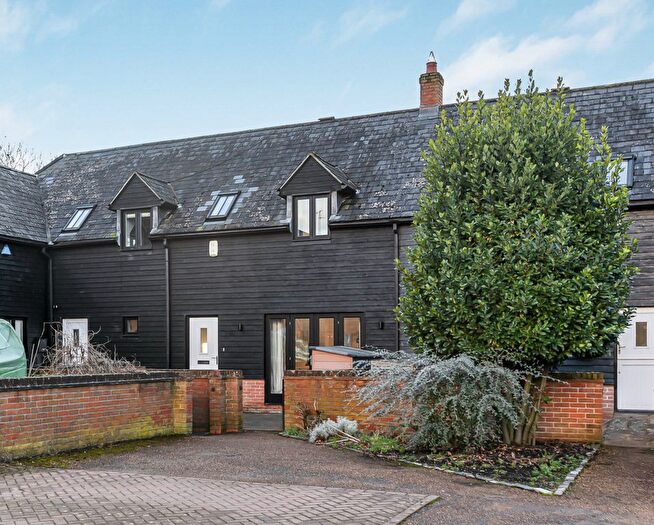
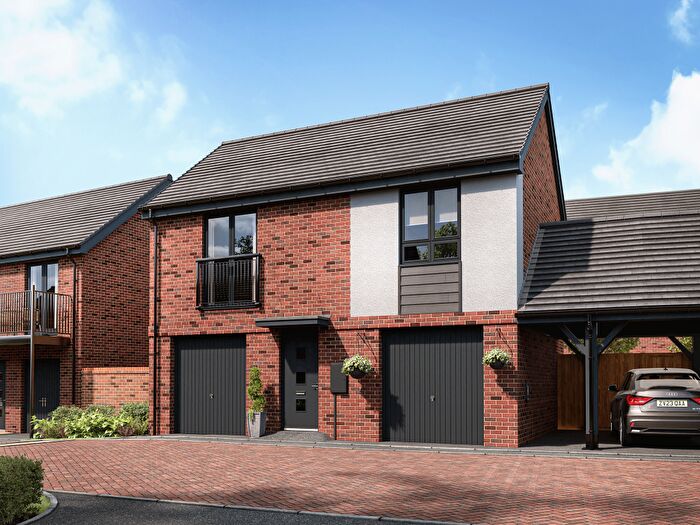
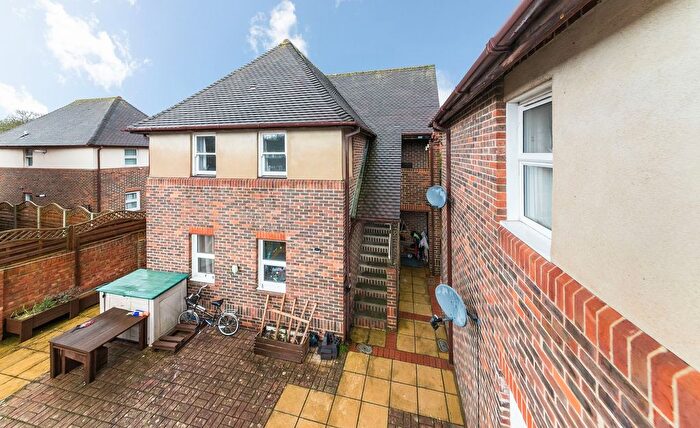
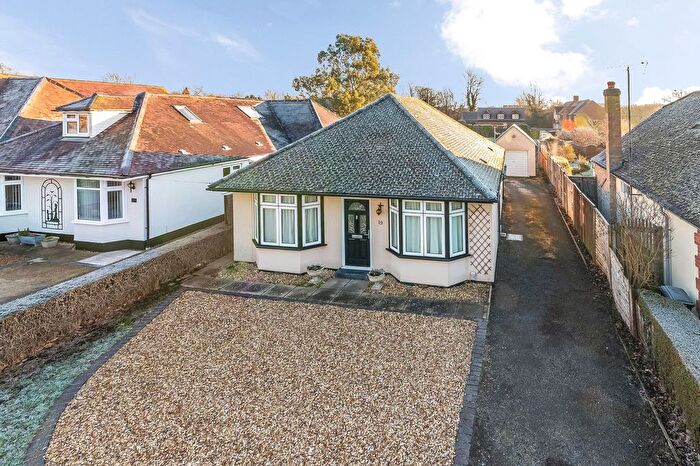
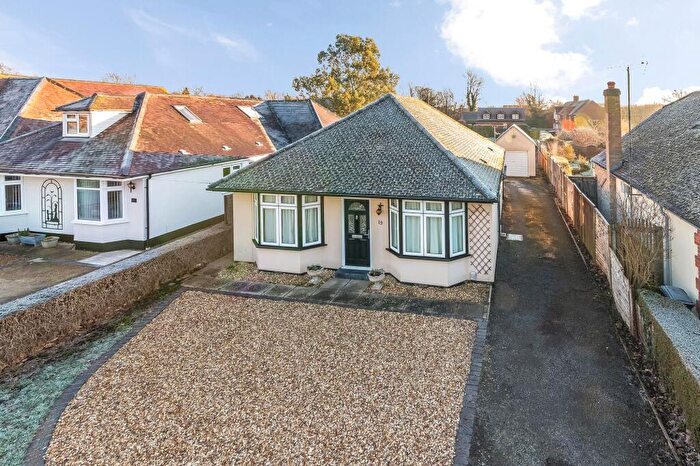
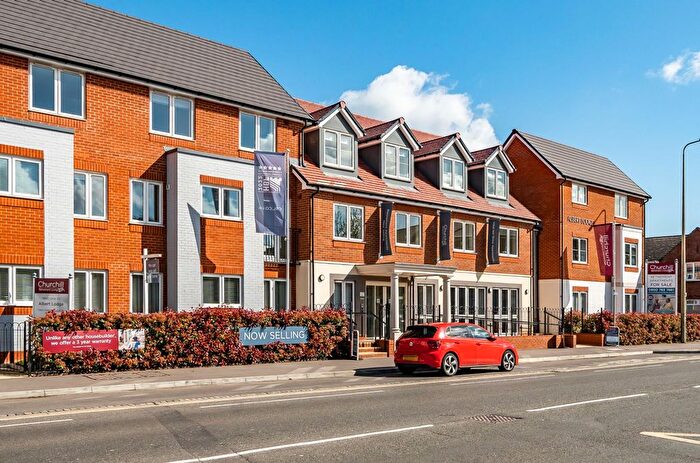
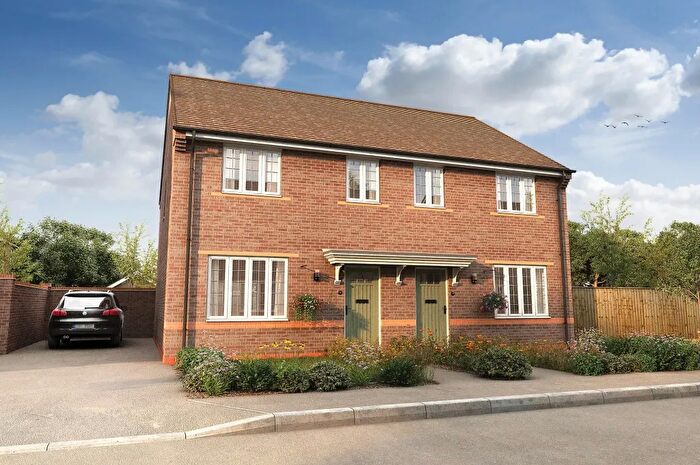
Properties for sale in Drayton
Roads and Postcodes in Drayton
Navigate through our locations to find the location of your next house in Drayton, Abingdon for sale or to rent.
| Streets | Postcodes |
|---|---|
| Abbot Crescent | OX14 4GY |
| Abingdon Road | OX14 4HL OX14 4HP OX14 4HT OX14 4HW OX14 4JB OX14 4JT OX14 4SU |
| Barton Court | OX14 4HF |
| Beaker Place | OX14 4FR |
| Binning Close | OX14 4LN |
| Caudwell Close | OX14 4HX |
| Chestnut Drive | OX14 4FU |
| Church Lane | OX14 4JS |
| Close End | OX14 4GQ |
| Corneville Road | OX14 4HN |
| Crabtree Lane | OX14 4HS |
| Croft Drive Park | OX14 4RP |
| Drayton Mill | OX14 4FD |
| Drayton Road | OX14 4EU |
| East Way | OX14 4JZ |
| East Way Mobile Home Park | OX14 4JY |
| Fallow Field Close | OX14 4GL |
| Fisher Close | OX14 4LT |
| Friars Mews | OX14 4GS |
| Furlongs | OX14 4GE |
| Furrows End | OX14 4GN |
| Gravel Lane | OX14 4HY |
| Greenacres | OX14 4JU |
| Halls Close | OX14 4LU |
| Hanney Road | OX13 6BE |
| Haywards Road | OX14 4LB |
| Henleys Lane | OX14 4HU |
| High Street | OX14 4JL OX14 4JR OX14 4JW OX14 4SX OX14 4DX OX14 4EL OX14 4EN OX14 4JP |
| Hilliat Fields | OX14 4JE OX14 4JF OX14 4JQ |
| Holly Lane | OX14 4FW |
| Innovation Drive Park | OX14 4RQ OX14 4RT OX14 4RZ |
| Jubilee Avenue Park | OX14 4RW OX14 4RX |
| Kiln Lane | OX14 4FE |
| Lammas Land | OX14 4GG |
| Lesparre Close | OX14 4FN |
| Lockway | OX14 4LF OX14 4LG |
| Lyford Close | OX14 4JG |
| Manor Close | OX14 4JD |
| Maple Gardens | OX14 4GP |
| Marcham Road | OX14 4FF OX14 4JH |
| Meads Close | OX14 4JN |
| Mill Road | OX14 5JZ |
| Milton Gate | OX14 4FP |
| Milton Park | OX14 4RS |
| Milton Road | OX14 4EF OX14 4EZ |
| Monk Close | OX14 4GW |
| Newman Lane | OX14 4LP |
| Oday Hill | OX14 4AB |
| Old Moor | OX14 4EB |
| Olympic Avenue Park | OX14 4SA |
| Park Drive Park | OX14 4RY |
| Park Square | OX14 4RN |
| Park Square Park | OX14 4RR |
| Plough Lane | OX14 4GJ |
| Prior Drive | OX14 4GR |
| Steventon Road | OX13 6RN OX14 4JX OX14 4LA OX14 4LD OX14 4LE |
| Stonehill | OX14 4AA |
| Sutton Wick Lane | OX14 4HH OX14 4HJ |
| The Green | OX14 4HZ OX14 4JA OX14 4JJ |
| Virgate | OX14 4GH |
| Walnut Way | OX14 4FY |
| Western Avenue Park | OX14 4RU OX14 4SH OX14 4TH |
| Whitehorns Way | OX14 4LH OX14 4LJ OX14 4LL OX14 4LQ |
| Willow Way | OX14 4FX |
| OX14 4HD OX14 4TX OX14 4SZ |
Transport near Drayton
- FAQ
- Price Paid By Year
- Property Type Price
Frequently asked questions about Drayton
What is the average price for a property for sale in Drayton?
The average price for a property for sale in Drayton is £482,112. This amount is 9% higher than the average price in Abingdon. There are 2,944 property listings for sale in Drayton.
What streets have the most expensive properties for sale in Drayton?
The streets with the most expensive properties for sale in Drayton are Abbot Crescent at an average of £940,000, Maple Gardens at an average of £890,000 and Halls Close at an average of £795,000.
What streets have the most affordable properties for sale in Drayton?
The streets with the most affordable properties for sale in Drayton are Lyford Close at an average of £222,900, Barton Court at an average of £306,500 and Henleys Lane at an average of £336,262.
Which train stations are available in or near Drayton?
Some of the train stations available in or near Drayton are Appleford, Culham and Didcot Parkway.
Property Price Paid in Drayton by Year
The average sold property price by year was:
| Year | Average Sold Price | Price Change |
Sold Properties
|
|---|---|---|---|
| 2025 | £511,472 | 7% |
35 Properties |
| 2024 | £473,464 | 3% |
36 Properties |
| 2023 | £458,236 | -15% |
30 Properties |
| 2022 | £525,990 | 7% |
33 Properties |
| 2021 | £490,089 | 13% |
63 Properties |
| 2020 | £426,766 | -14% |
62 Properties |
| 2019 | £485,004 | 4% |
104 Properties |
| 2018 | £464,861 | 12% |
84 Properties |
| 2017 | £408,230 | -1% |
63 Properties |
| 2016 | £412,464 | 11% |
71 Properties |
| 2015 | £365,626 | -1% |
41 Properties |
| 2014 | £370,926 | 13% |
42 Properties |
| 2013 | £322,200 | 10% |
35 Properties |
| 2012 | £290,748 | -25% |
31 Properties |
| 2011 | £362,670 | 13% |
32 Properties |
| 2010 | £314,305 | -4% |
26 Properties |
| 2009 | £327,458 | -12% |
25 Properties |
| 2008 | £366,749 | 26% |
16 Properties |
| 2007 | £269,734 | -8% |
39 Properties |
| 2006 | £290,656 | 11% |
39 Properties |
| 2005 | £259,692 | -1% |
28 Properties |
| 2004 | £262,778 | 10% |
49 Properties |
| 2003 | £237,383 | 2% |
36 Properties |
| 2002 | £231,485 | 21% |
60 Properties |
| 2001 | £181,728 | 5% |
58 Properties |
| 2000 | £171,769 | 5% |
36 Properties |
| 1999 | £162,641 | 15% |
42 Properties |
| 1998 | £137,518 | 20% |
36 Properties |
| 1997 | £109,988 | -1% |
39 Properties |
| 1996 | £110,747 | 25% |
73 Properties |
| 1995 | £83,518 | - |
24 Properties |
Property Price per Property Type in Drayton
Here you can find historic sold price data in order to help with your property search.
The average Property Paid Price for specific property types in the last three years are:
| Property Type | Average Sold Price | Sold Properties |
|---|---|---|
| Semi Detached House | £380,218.00 | 31 Semi Detached Houses |
| Detached House | £638,904.00 | 45 Detached Houses |
| Terraced House | £338,139.00 | 23 Terraced Houses |
| Flat | £189,350.00 | 2 Flats |

