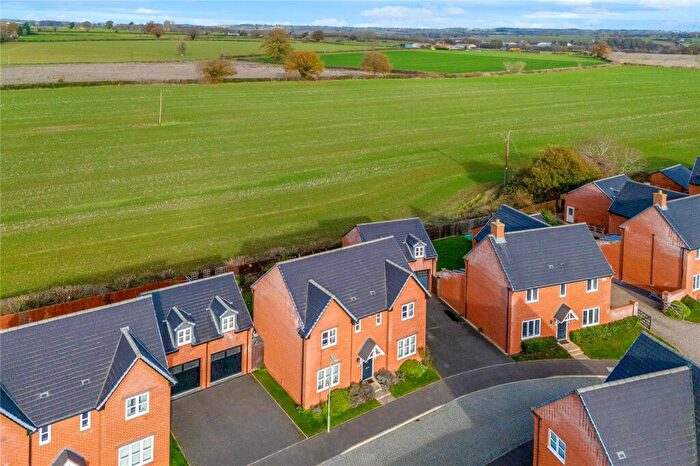
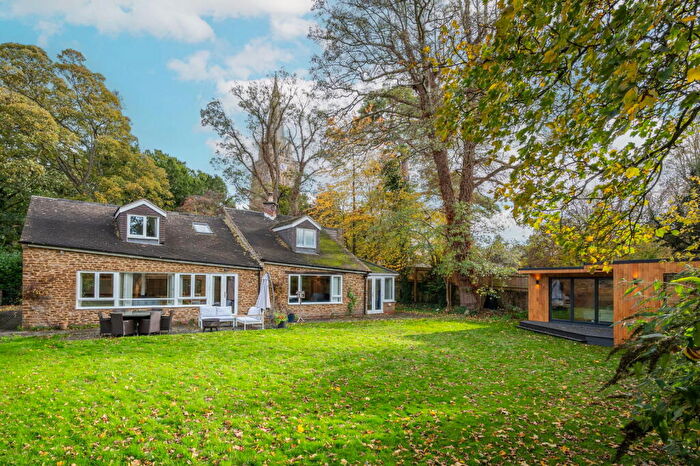
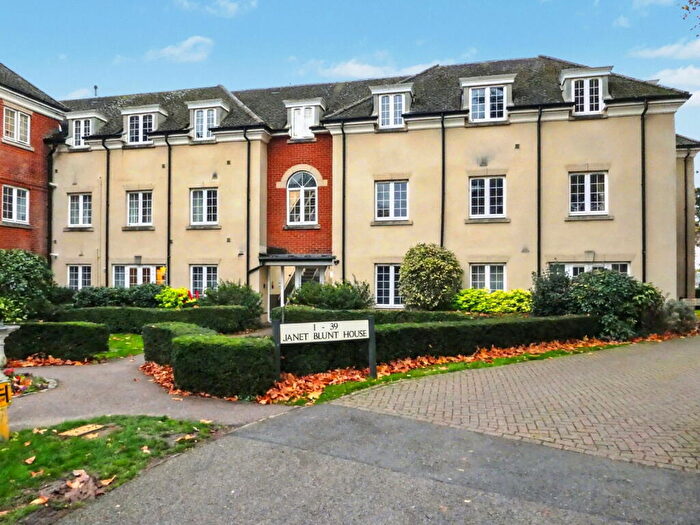
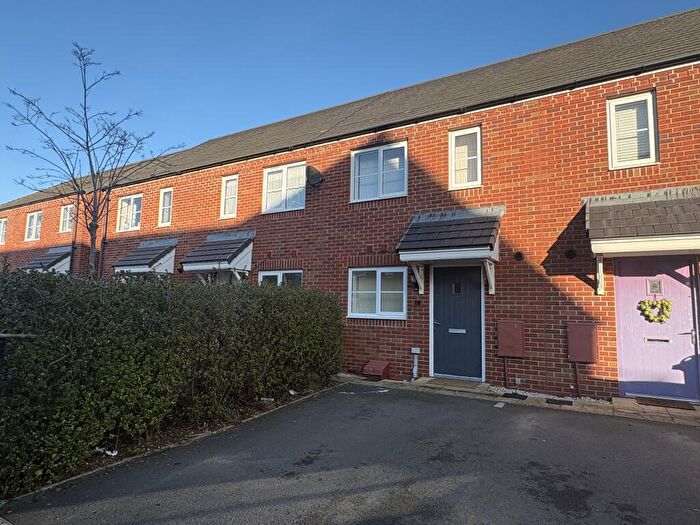
Houses for sale & to rent in Adderbury, Banbury
House Prices in Adderbury
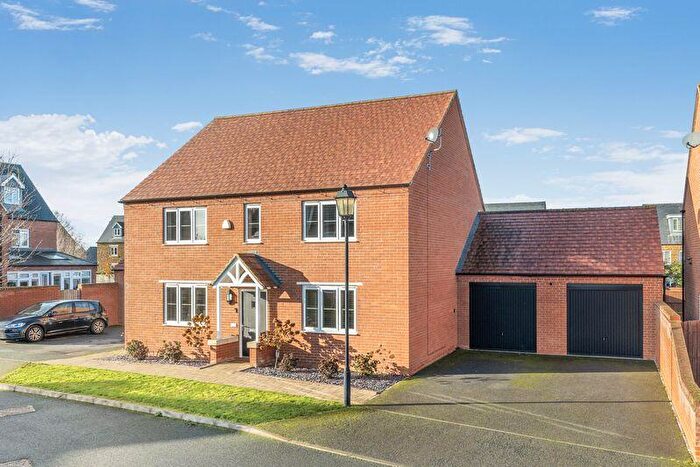
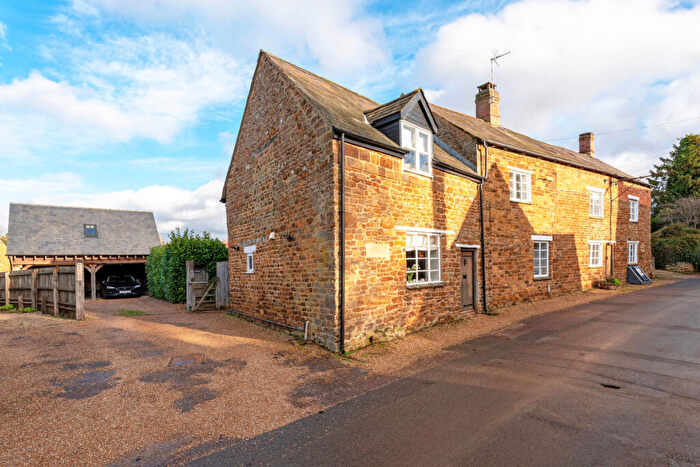
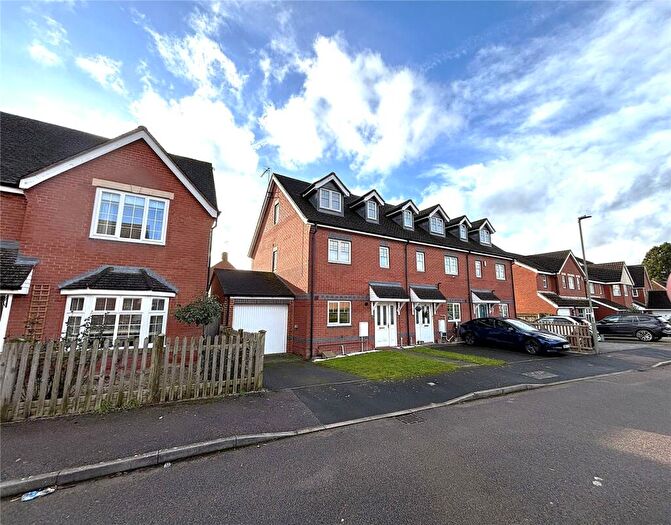
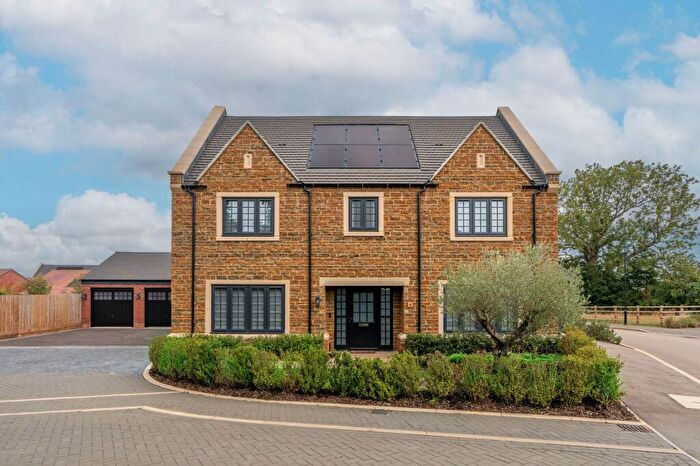
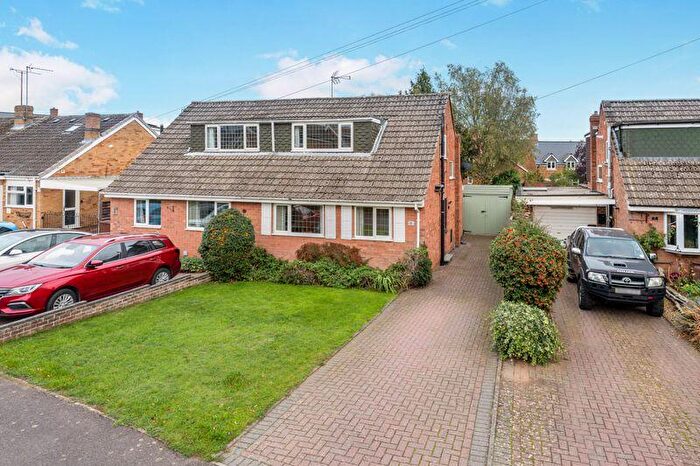
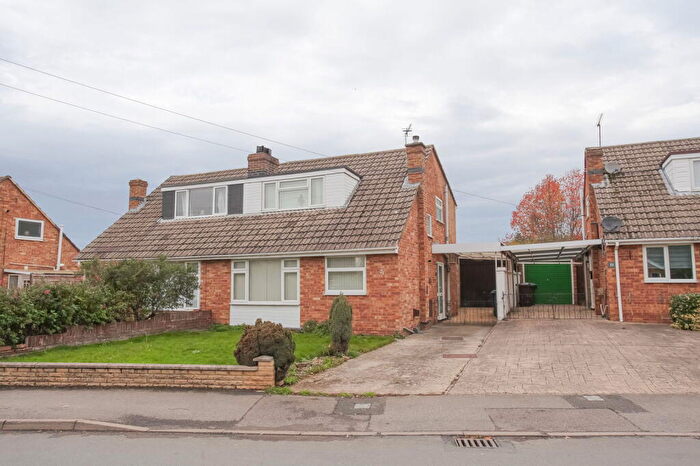
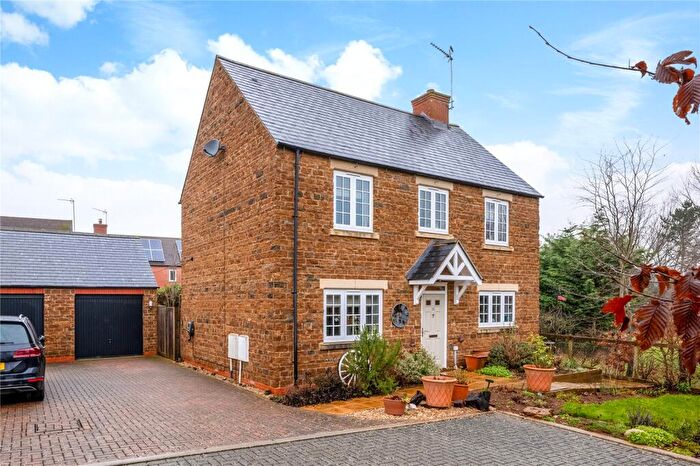
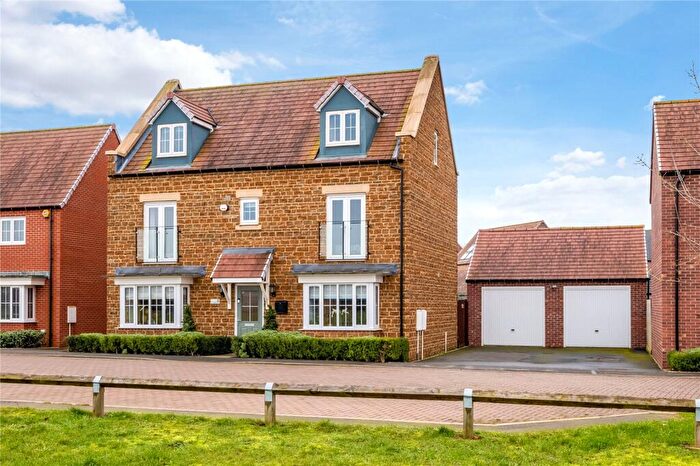
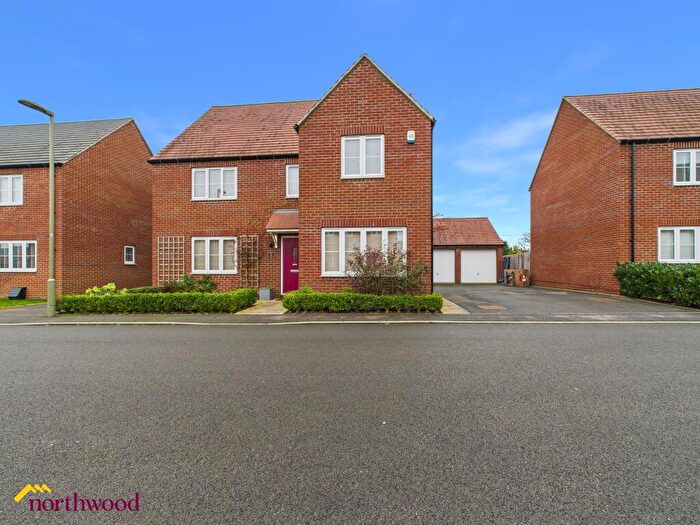
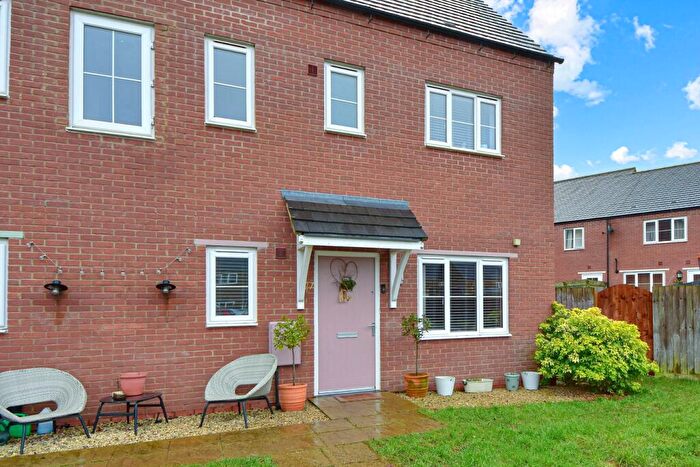
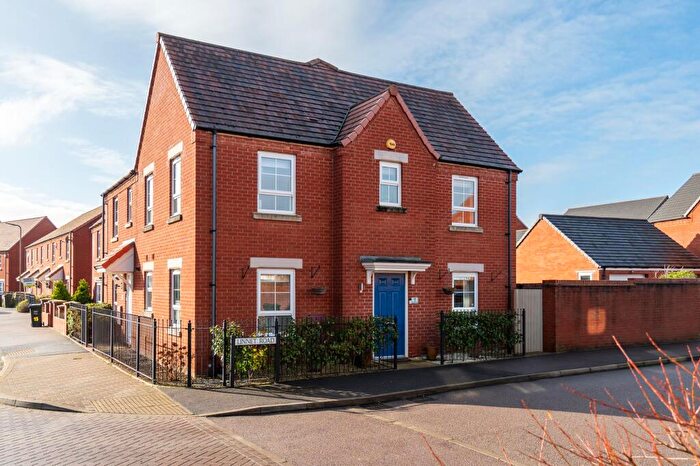
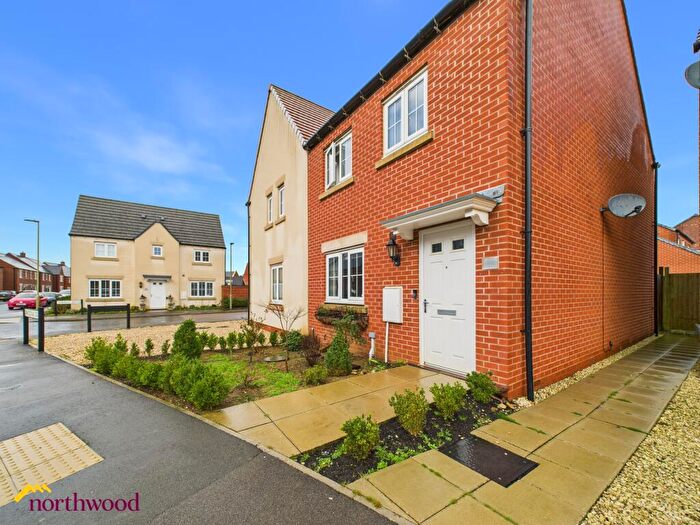
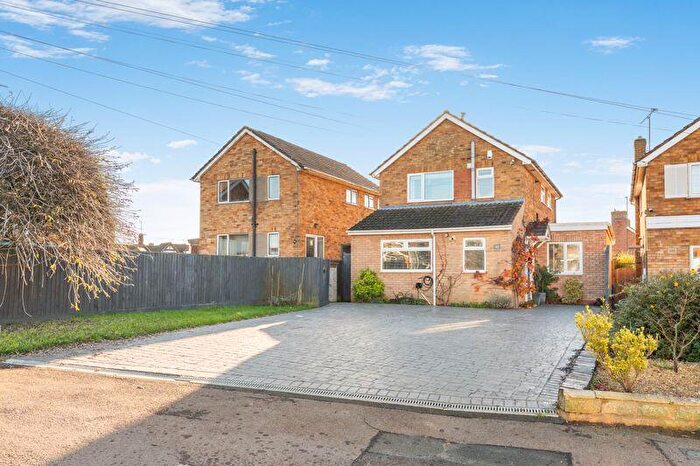
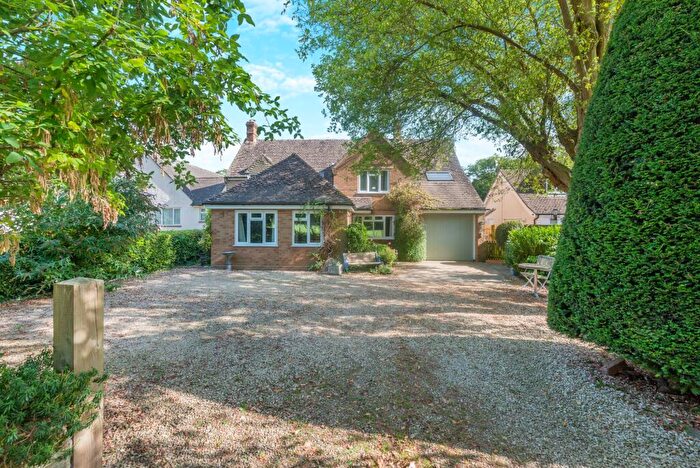
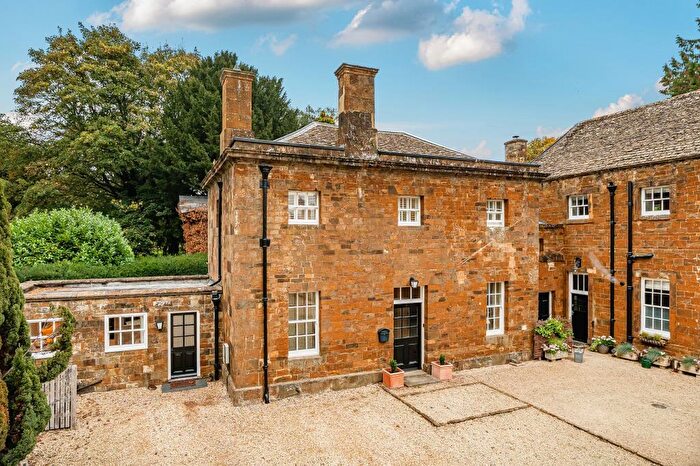
Properties in Adderbury have an average house price of £490,257.00 and had 99 Property Transactions within the last 3 years¹.
Adderbury is an area in Banbury, Oxfordshire with 1,193 households², where the most expensive property was sold for £1,220,000.00.
Properties for sale in Adderbury
Roads and Postcodes in Adderbury
Navigate through our locations to find the location of your next house in Adderbury, Banbury for sale or to rent.
| Streets | Postcodes |
|---|---|
| Adderbury Court | OX17 3NN |
| Adderbury Park | OX17 3EN |
| Aynho Road | OX17 3NL OX17 3NT OX17 3NU OX17 3NY |
| Berry Hill Road | OX17 3HF |
| Cawley Road | OX17 3JT |
| Chapel Lane | OX17 3LY |
| Church Close | OX17 3LN |
| Church Lane | OX17 3LR |
| Council Houses | OX15 4HG |
| Croft Lane | OX17 3NB |
| Cross Hill Road | OX17 3EG OX17 3EQ |
| Deene Close | OX17 3LD |
| Dog Close | OX17 3EF OX17 3LJ |
| East End | OX17 3NJ |
| East End Lane | OX17 3NW |
| Falkners Close | OX17 3SH |
| Greenhill | OX17 3FH OX17 3FJ OX17 3FL OX17 3JB |
| Griffin Close | OX17 3HR |
| Henry Gepp Close | OX17 3FE |
| High Street | OX17 3LS OX17 3LU OX17 3NA |
| Horn Hill Road | OX17 3EU OX17 3EW |
| Kemps Road | OX17 3JS |
| Keytes Close | OX17 3PB |
| Lake Walk | OX17 3PF |
| Lambourne Way | OX17 3PN OX17 3PW |
| Lester Close | OX17 3LH |
| Little Ground | OX15 4HQ |
| Long Wall | OX17 3FD |
| Long Wall Close | OX17 3FF |
| Manor Road | OX17 3EJ OX17 3EL |
| Margaret Road | OX17 3JE |
| Meadow View | OX17 3LZ |
| Mill Lane | OX17 3LP OX17 3LW |
| Milton Road | OX17 3HN |
| Norris Close | OX17 3HD |
| Oxford Road | OX17 3HG OX17 3HJ OX17 3NF OX17 3NQ |
| Parsons Street | OX17 3LX |
| Rawlins Close | OX17 3HS |
| Rochester Way | OX17 3JU OX17 3JX |
| Round Close Road | OX17 3EE OX17 3EP |
| Sir Georges Lane | OX17 3PA |
| St Marys Road | OX17 3EZ OX17 3HA OX17 3HB OX17 3HE |
| Sydenham Close | OX17 3FB |
| Tanners Lane | OX17 3ER OX17 3ET |
| The Bank | OX15 4HF |
| The Courtyard | OX15 4SX |
| The Crescent | OX17 3HZ |
| The Green | OX17 3ND OX17 3NE OX17 3NG |
| The Leys | OX17 3ES |
| The Rise | OX17 3HU OX17 3HX |
| Twyford Avenue | OX17 3JF |
| Twyford Fields | OX17 3LE |
| Twyford Gardens | OX17 3HT OX17 3HY OX17 3JA OX17 3JJ |
| Twyford Grove | OX17 3JD |
| Twyford Road | OX17 3JG OX17 3JL OX17 3JQ |
| Twyford Wharf | OX17 3JN |
| Walton Avenue | OX17 3JY OX17 3LA OX17 3LB |
| Water Lane | OX17 3LT |
| OX15 4HH OX17 3JP OX17 3PD |
Transport near Adderbury
- FAQ
- Price Paid By Year
- Property Type Price
Frequently asked questions about Adderbury
What is the average price for a property for sale in Adderbury?
The average price for a property for sale in Adderbury is £490,257. This amount is 42% higher than the average price in Banbury. There are 800 property listings for sale in Adderbury.
What streets have the most expensive properties for sale in Adderbury?
The streets with the most expensive properties for sale in Adderbury are Church Lane at an average of £1,120,000, The Green at an average of £920,000 and Manor Road at an average of £875,333.
What streets have the most affordable properties for sale in Adderbury?
The streets with the most affordable properties for sale in Adderbury are Round Close Road at an average of £223,000, Mill Lane at an average of £226,000 and Water Lane at an average of £253,500.
Which train stations are available in or near Adderbury?
Some of the train stations available in or near Adderbury are King's Sutton, Banbury and Heyford.
Property Price Paid in Adderbury by Year
The average sold property price by year was:
| Year | Average Sold Price | Price Change |
Sold Properties
|
|---|---|---|---|
| 2025 | £499,816 | 6% |
29 Properties |
| 2024 | £467,491 | -7% |
31 Properties |
| 2023 | £501,246 | -15% |
39 Properties |
| 2022 | £578,581 | 6% |
43 Properties |
| 2021 | £541,075 | 0,3% |
59 Properties |
| 2020 | £539,527 | 13% |
36 Properties |
| 2019 | £468,211 | 12% |
45 Properties |
| 2018 | £412,022 | 3% |
44 Properties |
| 2017 | £400,430 | 4% |
40 Properties |
| 2016 | £384,926 | 4% |
42 Properties |
| 2015 | £368,111 | 1% |
45 Properties |
| 2014 | £362,927 | 14% |
43 Properties |
| 2013 | £310,946 | -29% |
44 Properties |
| 2012 | £400,870 | 4% |
37 Properties |
| 2011 | £383,456 | 18% |
62 Properties |
| 2010 | £313,944 | 11% |
55 Properties |
| 2009 | £280,912 | -27% |
63 Properties |
| 2008 | £356,446 | 7% |
39 Properties |
| 2007 | £331,347 | 2% |
72 Properties |
| 2006 | £326,049 | 9% |
68 Properties |
| 2005 | £296,749 | 11% |
55 Properties |
| 2004 | £264,989 | 1% |
60 Properties |
| 2003 | £263,386 | 10% |
80 Properties |
| 2002 | £238,189 | 28% |
66 Properties |
| 2001 | £172,560 | -2% |
66 Properties |
| 2000 | £175,855 | 10% |
60 Properties |
| 1999 | £157,760 | -18% |
65 Properties |
| 1998 | £186,039 | 13% |
50 Properties |
| 1997 | £161,208 | 25% |
60 Properties |
| 1996 | £121,319 | 8% |
57 Properties |
| 1995 | £111,274 | - |
37 Properties |
Property Price per Property Type in Adderbury
Here you can find historic sold price data in order to help with your property search.
The average Property Paid Price for specific property types in the last three years are:
| Property Type | Average Sold Price | Sold Properties |
|---|---|---|
| Semi Detached House | £432,654.00 | 28 Semi Detached Houses |
| Detached House | £624,645.00 | 46 Detached Houses |
| Terraced House | £329,595.00 | 21 Terraced Houses |
| Flat | £191,500.00 | 4 Flats |

