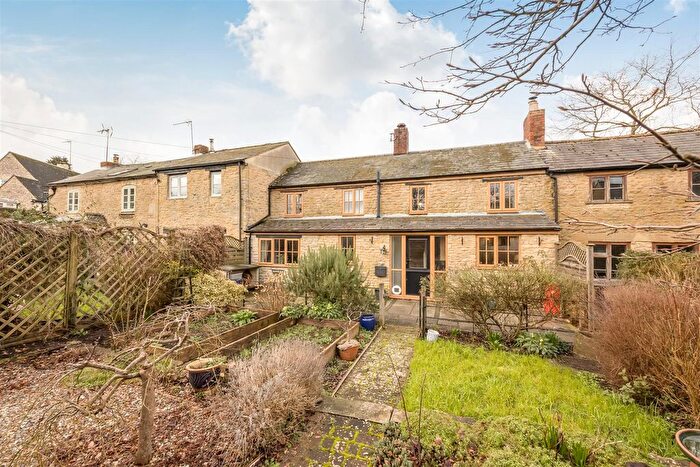
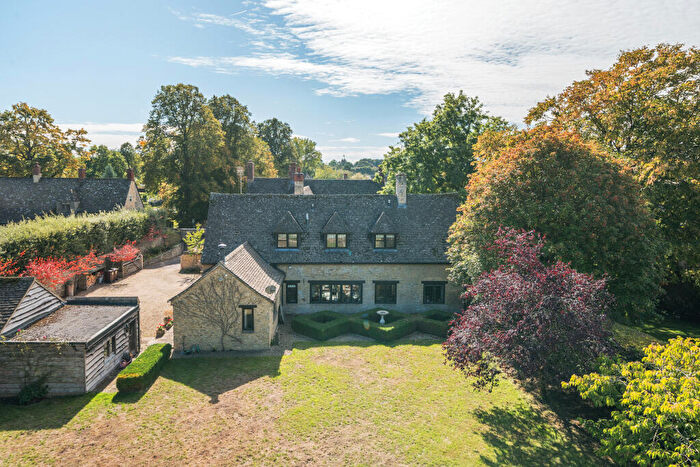
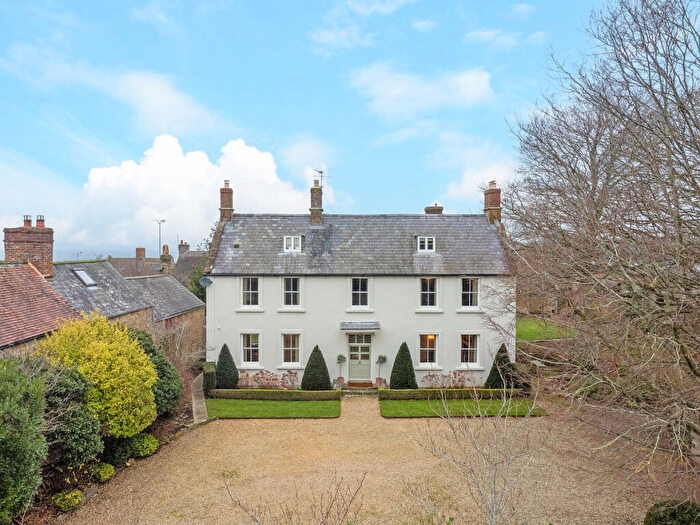
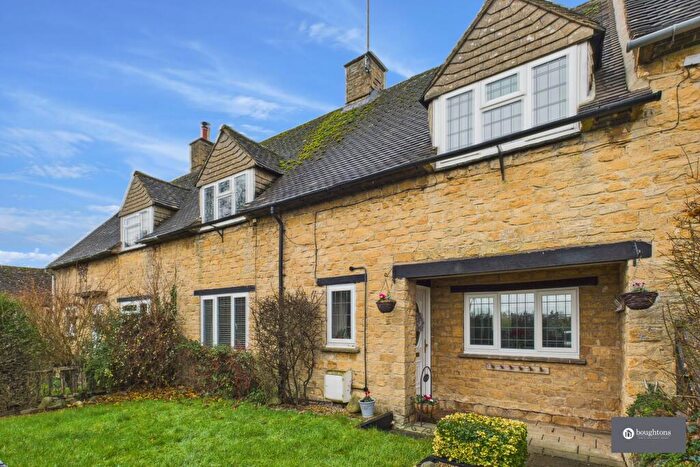
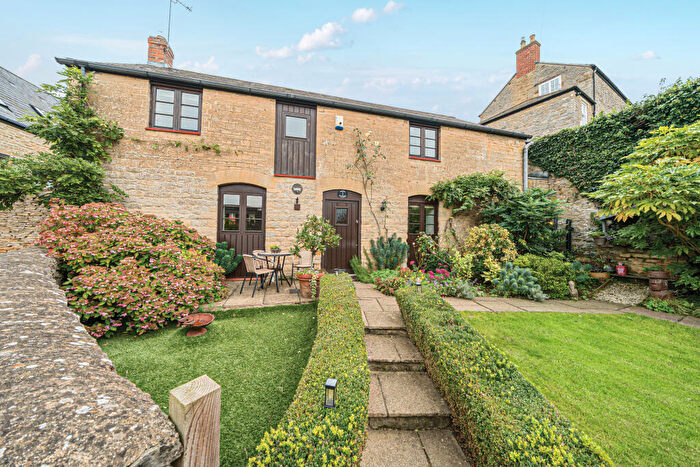
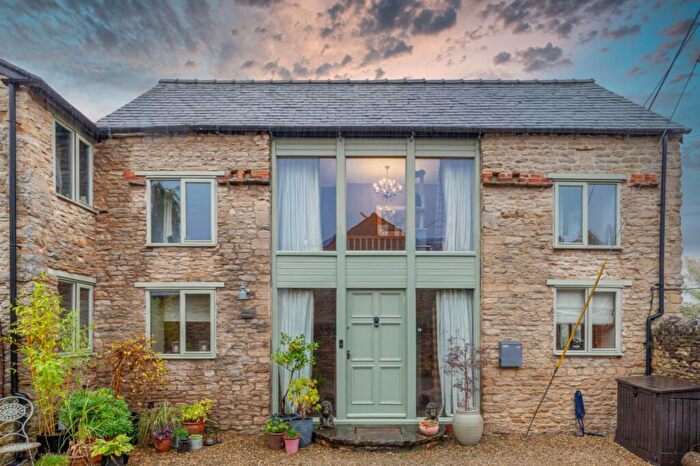
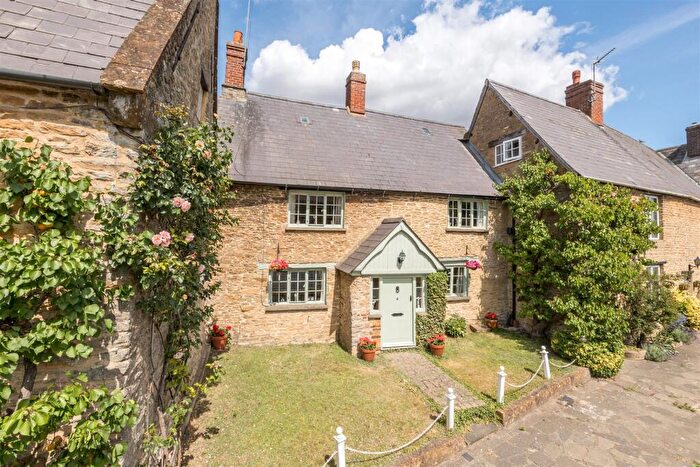
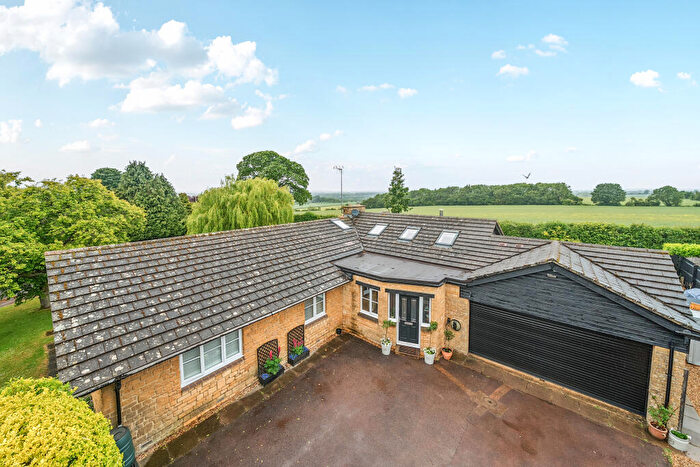
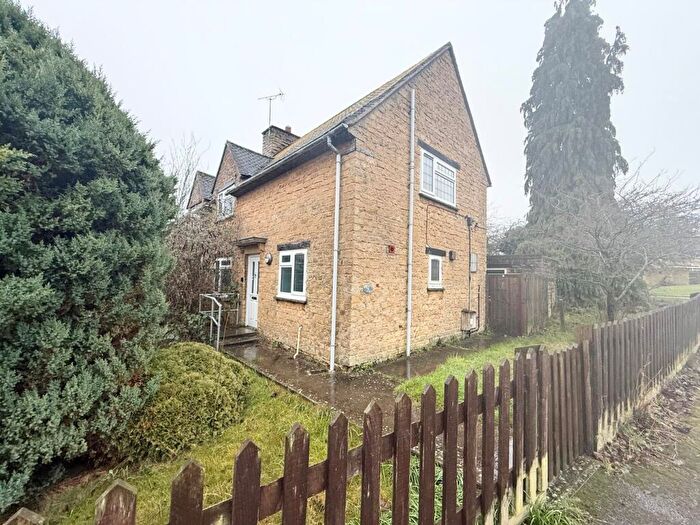
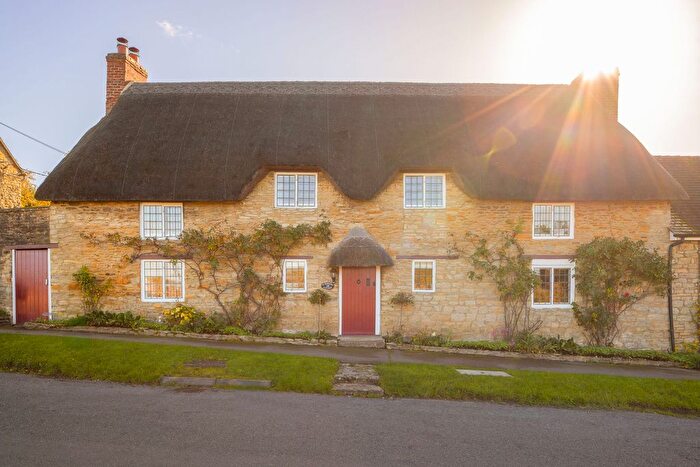
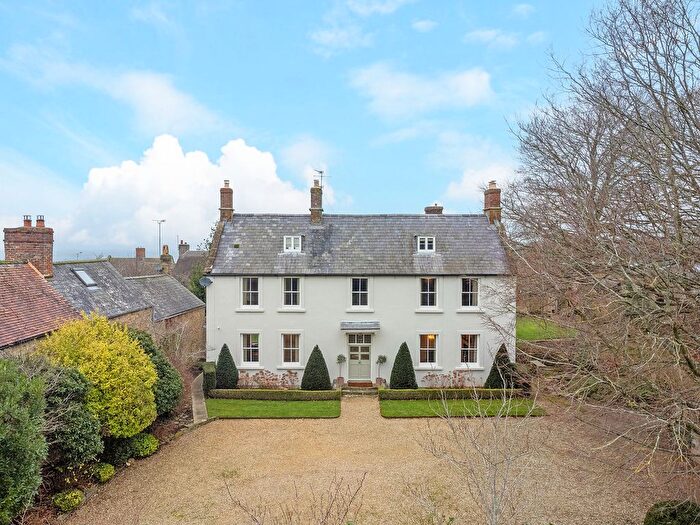
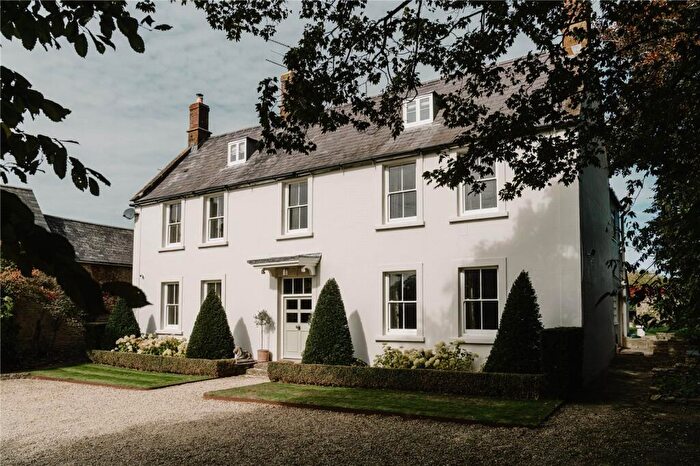
Houses for sale & to rent in Little Brook, Banbury
House Prices in Little Brook
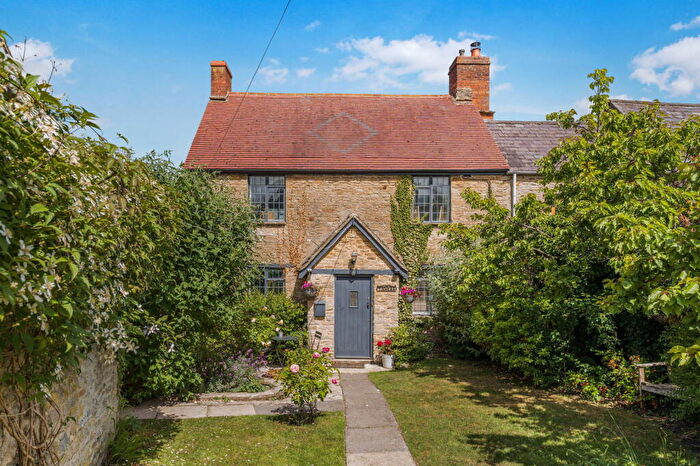
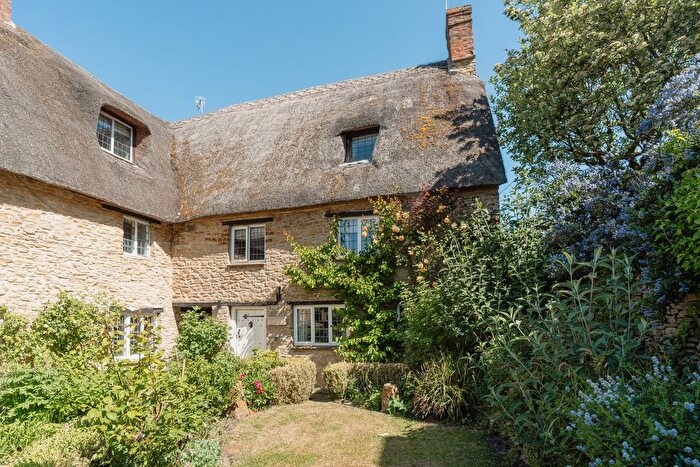
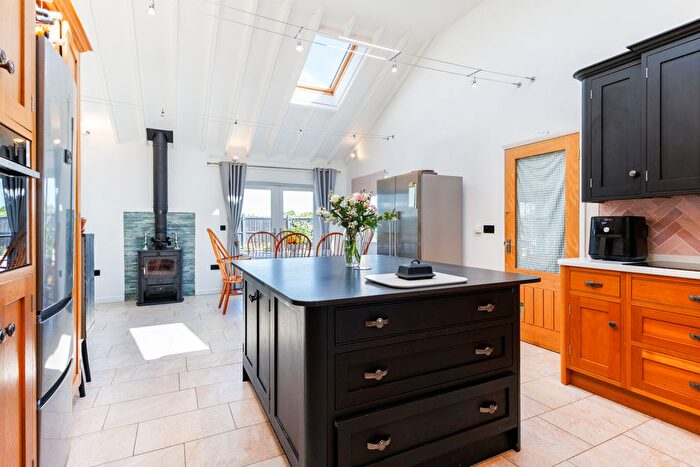
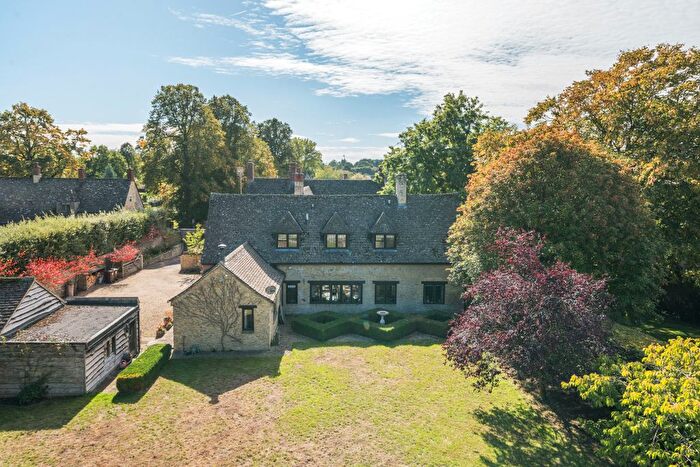
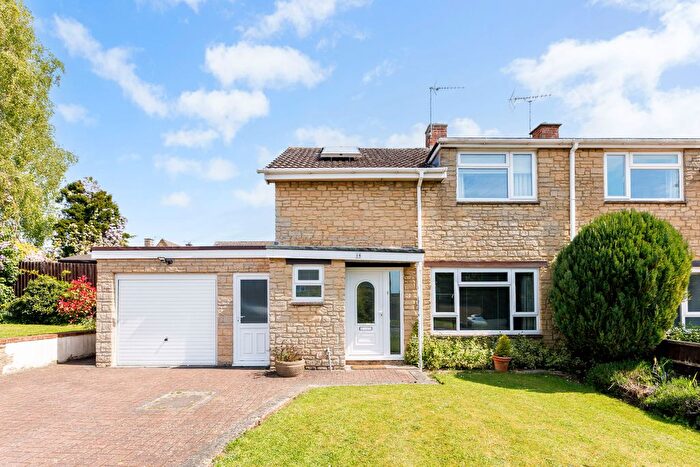
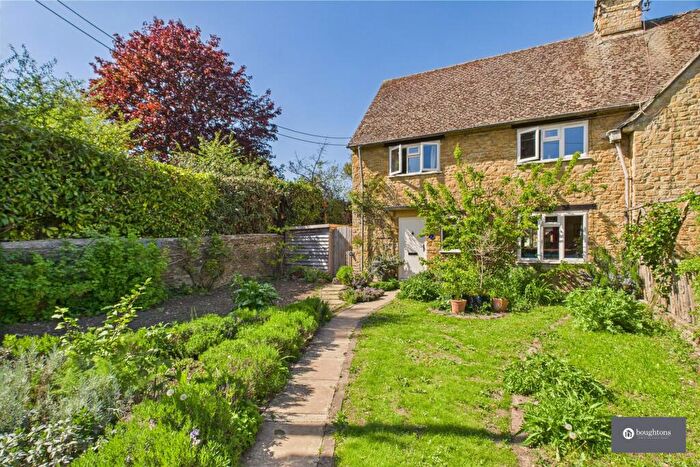
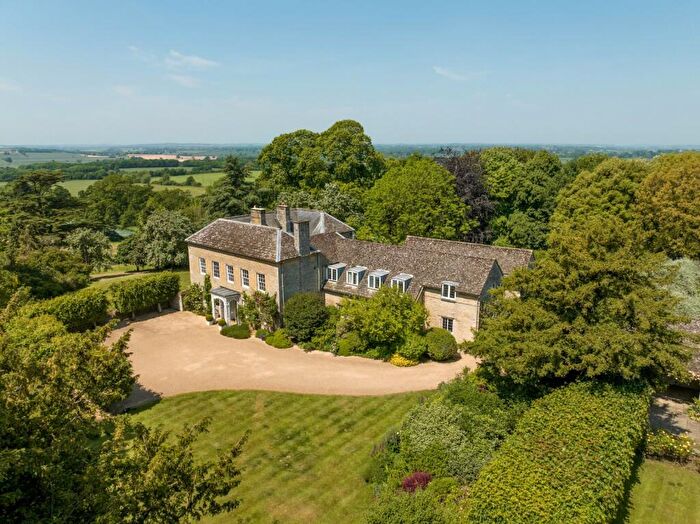
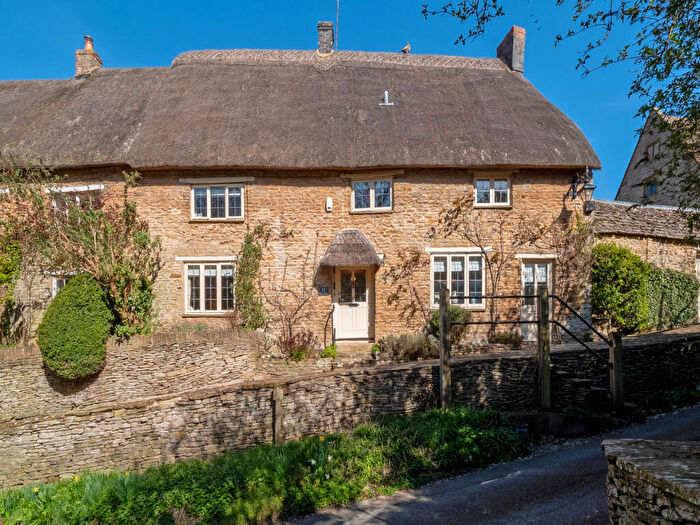
Properties in Little Brook have an average house price of £487,677.00 and had 31 Property Transactions within the last 3 years¹.
Little Brook is an area in Banbury, Northamptonshire with 289 households², where the most expensive property was sold for £1,487,500.00.
Properties for sale in Little Brook
Previously listed properties in Little Brook
Roads and Postcodes in Little Brook
Navigate through our locations to find the location of your next house in Little Brook, Banbury for sale or to rent.
| Streets | Postcodes |
|---|---|
| Aynhoe Park | OX17 3BQ |
| Banbury Road | OX17 3AB |
| Blacksmiths Hill | OX17 3AH |
| Bowmens Lea | OX17 3AG OX17 3AQ |
| Butts Close | OX17 3AE |
| Cartwright Gardens | OX17 3BB |
| Charlton Road | OX17 3AD OX17 3AL OX17 3AW |
| College Fields | OX17 3BZ |
| Croughton Road | OX17 3AU OX17 3BD OX17 3BE OX17 3AT |
| Little Lane | OX17 3BJ |
| Portway | OX17 3AP |
| Portway Gardens | OX17 3AR |
| Raincliffe Close | OX17 3SB |
| Roundtown | OX17 3BG OX17 3BH |
| School End | OX17 3BS |
| Skittle Alley | OX17 3AJ |
| Station Road | OX17 3FZ |
| The Bothy | OX17 3BA |
| The Butts | OX17 3AN |
| The Glebe | OX17 3AZ |
| The Hill | OX17 3BN |
| The Square | OX17 3BL |
| OX17 3AY OX17 3BP OX17 3AF OX17 3AX OX17 3BW |
Transport near Little Brook
-
King's Sutton Station
-
Banbury Station
-
Heyford Station
-
Bicester North Station
-
Tackley Station
-
Bicester Village Station
- FAQ
- Price Paid By Year
- Property Type Price
Frequently asked questions about Little Brook
What is the average price for a property for sale in Little Brook?
The average price for a property for sale in Little Brook is £487,677. This amount is 9% higher than the average price in Banbury. There are 103 property listings for sale in Little Brook.
What streets have the most expensive properties for sale in Little Brook?
The streets with the most expensive properties for sale in Little Brook are The Square at an average of £928,750, College Fields at an average of £767,500 and Cartwright Gardens at an average of £708,333.
What streets have the most affordable properties for sale in Little Brook?
The streets with the most affordable properties for sale in Little Brook are Croughton Road at an average of £206,500, School End at an average of £262,500 and Bowmens Lea at an average of £315,000.
Which train stations are available in or near Little Brook?
Some of the train stations available in or near Little Brook are King's Sutton, Banbury and Heyford.
Property Price Paid in Little Brook by Year
The average sold property price by year was:
| Year | Average Sold Price | Price Change |
Sold Properties
|
|---|---|---|---|
| 2025 | £390,937 | -26% |
8 Properties |
| 2024 | £492,083 | -12% |
12 Properties |
| 2023 | £553,227 | -22% |
11 Properties |
| 2022 | £674,500 | 30% |
16 Properties |
| 2021 | £473,826 | -13% |
15 Properties |
| 2020 | £534,340 | 28% |
22 Properties |
| 2019 | £386,944 | -25% |
19 Properties |
| 2018 | £483,750 | 6% |
4 Properties |
| 2017 | £454,391 | 36% |
12 Properties |
| 2016 | £288,857 | -71% |
7 Properties |
| 2015 | £494,981 | 13% |
13 Properties |
| 2014 | £429,419 | 22% |
13 Properties |
| 2013 | £336,029 | 14% |
17 Properties |
| 2012 | £287,493 | -19% |
8 Properties |
| 2011 | £342,964 | -6% |
14 Properties |
| 2010 | £363,250 | 19% |
6 Properties |
| 2009 | £292,785 | -10% |
7 Properties |
| 2008 | £322,438 | -7% |
9 Properties |
| 2007 | £343,473 | -2% |
19 Properties |
| 2006 | £348,718 | 15% |
16 Properties |
| 2005 | £296,000 | -2% |
11 Properties |
| 2004 | £301,333 | -3% |
15 Properties |
| 2003 | £309,411 | 8% |
17 Properties |
| 2002 | £284,181 | 38% |
22 Properties |
| 2001 | £176,791 | 4% |
29 Properties |
| 2000 | £169,884 | 21% |
13 Properties |
| 1999 | £134,830 | -6% |
21 Properties |
| 1998 | £142,794 | 14% |
17 Properties |
| 1997 | £123,130 | 13% |
13 Properties |
| 1996 | £106,802 | -36% |
23 Properties |
| 1995 | £144,966 | - |
15 Properties |
Property Price per Property Type in Little Brook
Here you can find historic sold price data in order to help with your property search.
The average Property Paid Price for specific property types in the last three years are:
| Property Type | Average Sold Price | Sold Properties |
|---|---|---|
| Semi Detached House | £420,777.00 | 9 Semi Detached Houses |
| Terraced House | £444,642.00 | 7 Terraced Houses |
| Flat | £206,500.00 | 4 Flats |
| Detached House | £672,045.00 | 11 Detached Houses |

