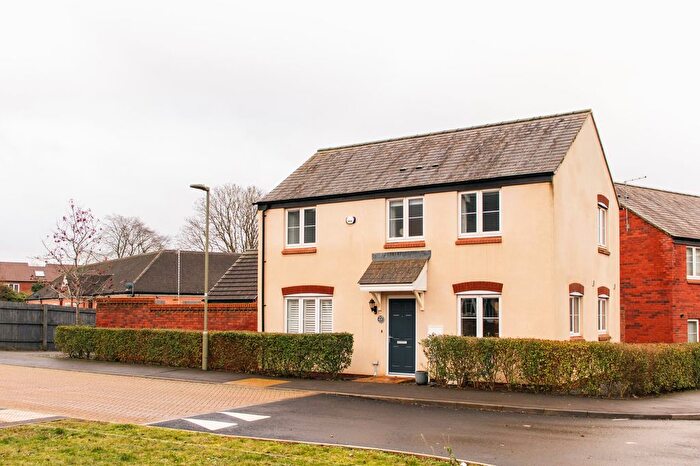
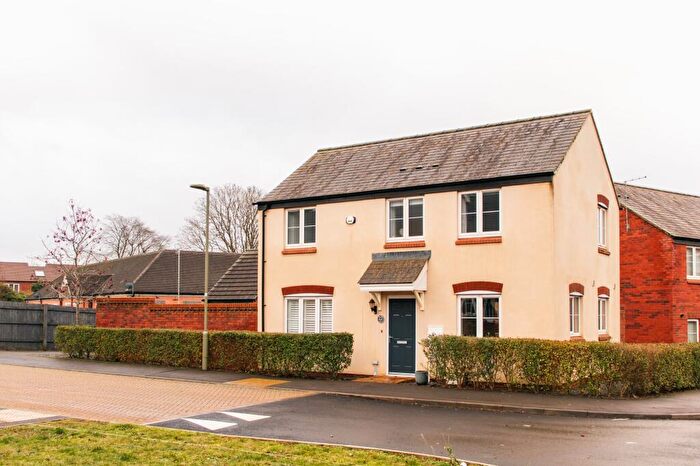
Houses for sale & to rent in Cropredy, Banbury
House Prices in Cropredy
Properties in Cropredy have an average house price of £482,745.00 and had 134 Property Transactions within the last 3 years¹.
Cropredy is an area in Banbury, Oxfordshire with 1,050 households², where the most expensive property was sold for £1,650,000.00.
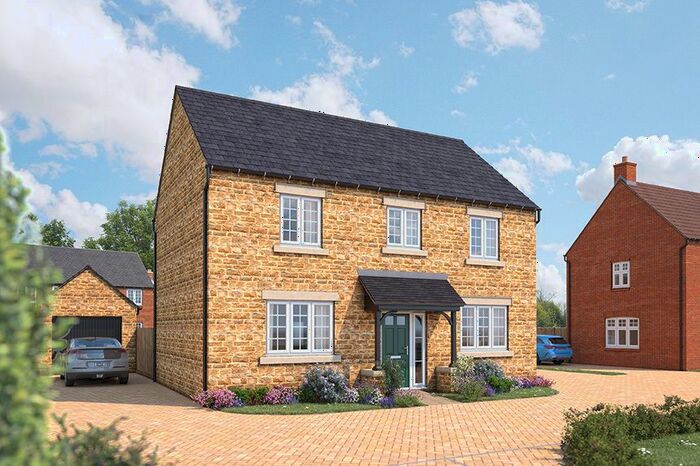
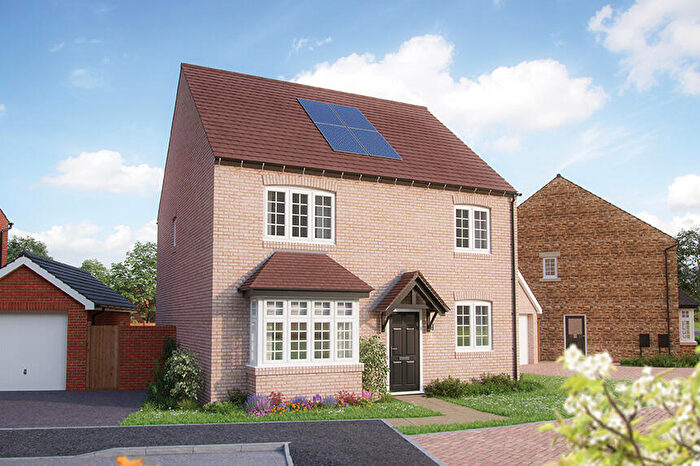
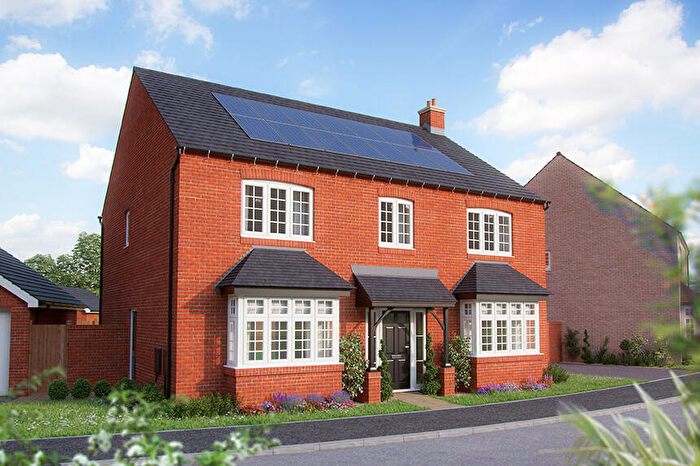
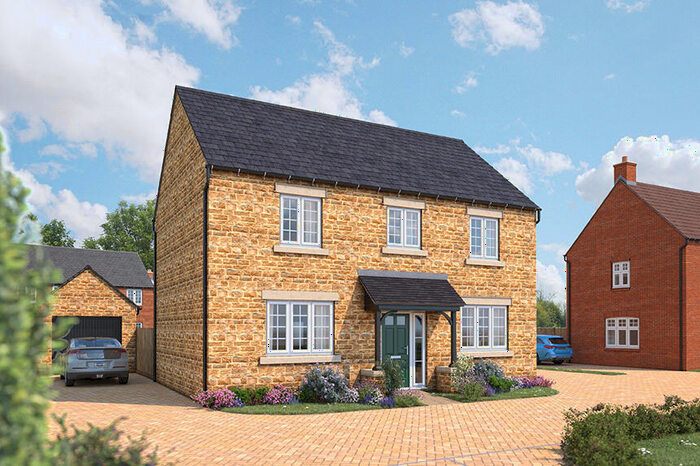
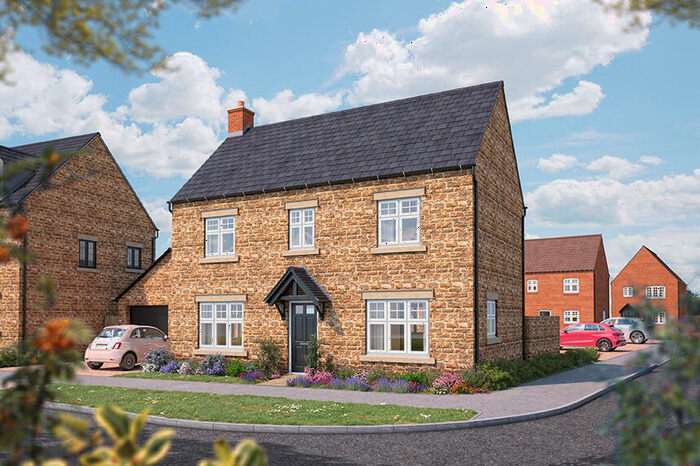
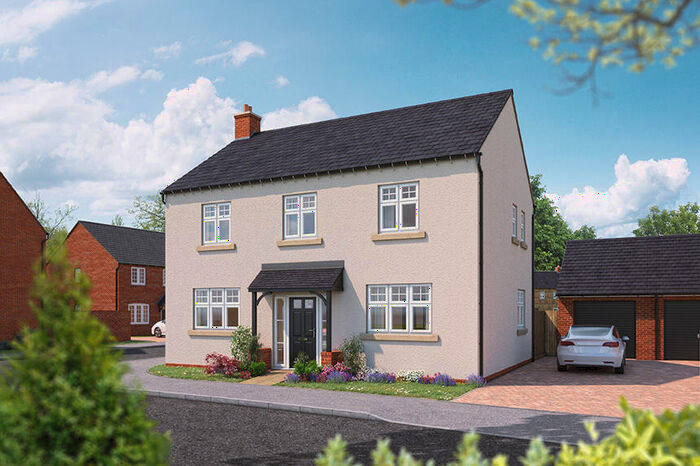
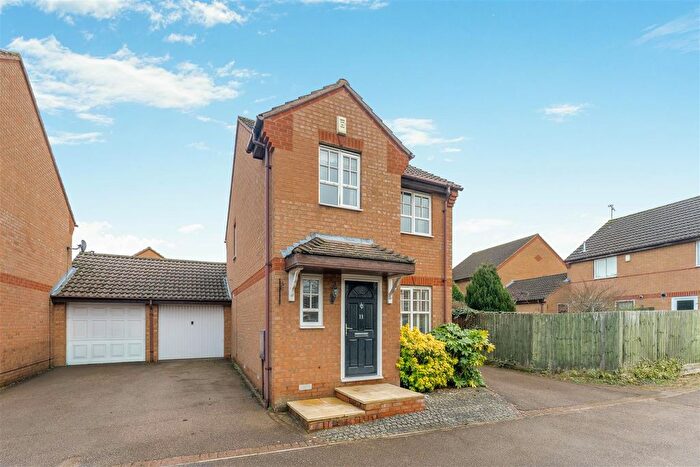
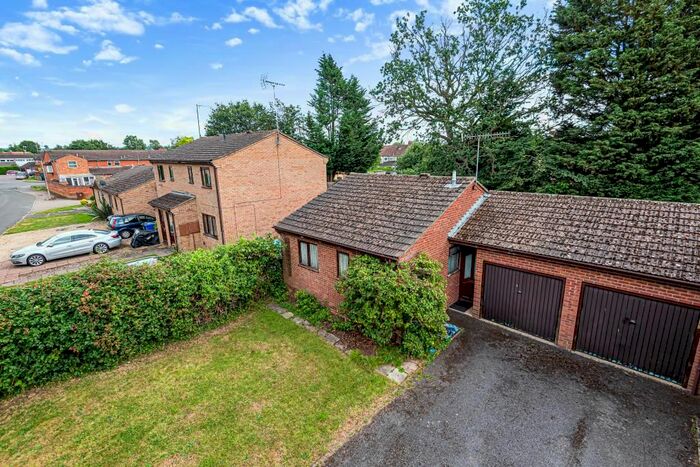
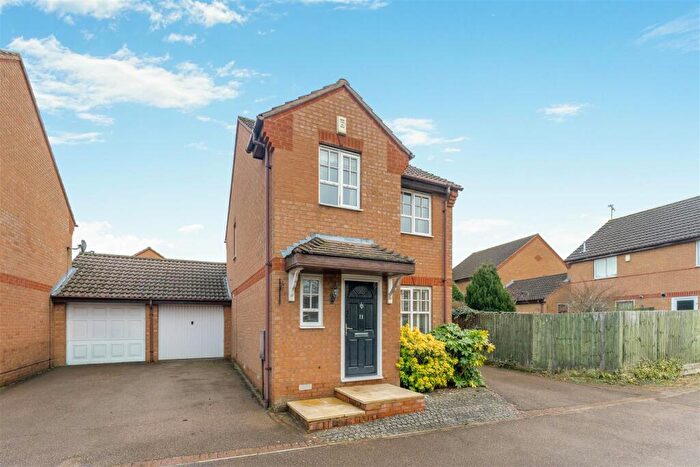
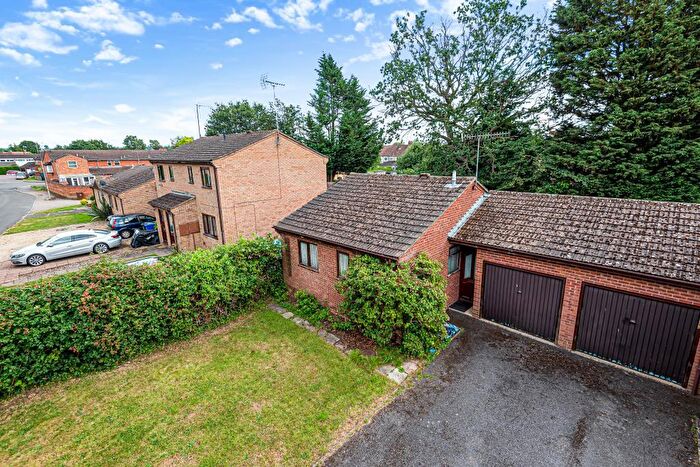
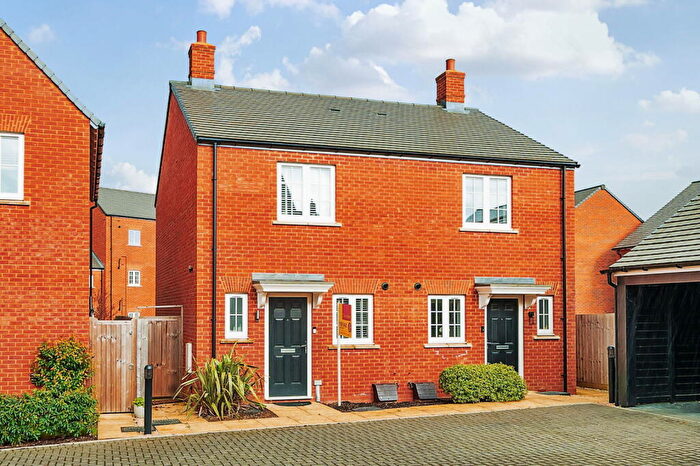
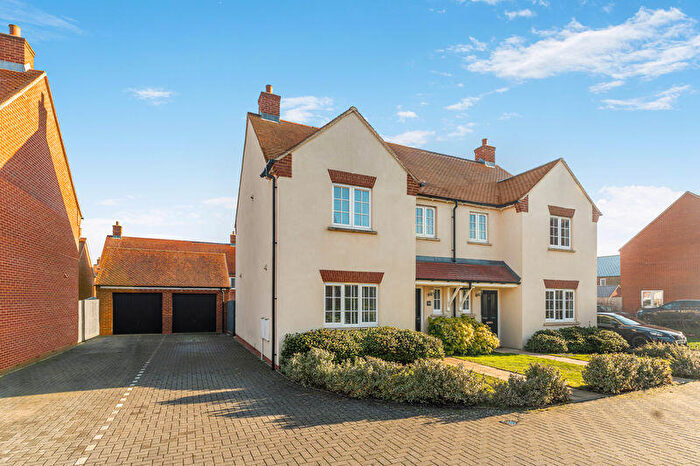
Properties for sale in Cropredy
Roads and Postcodes in Cropredy
Navigate through our locations to find the location of your next house in Cropredy, Banbury for sale or to rent.
| Streets | Postcodes |
|---|---|
| Bignolds Close | OX17 1ER |
| Boddington Road | OX17 1HB |
| Buzzards Close | OX17 1RN |
| Chapel Lane | OX17 1PA OX17 1RD OX17 1RQ |
| Chapel Row | OX17 1NS |
| Chelmscote Row | OX17 1SS |
| Cherry Fields | OX17 1PH |
| Chestnut Road | OX17 1BG |
| Chestnut Vale | OX17 1AW |
| Church Close | OX17 1RS OX17 1RW |
| Church Lane | OX17 1AX OX17 1EW OX17 1NQ |
| Church Lea | OX17 1BA |
| Clattercote Cottages | OX17 1QB |
| Claydon Road | OX17 1JP OX17 1NW |
| Creampot Close | OX17 1NX |
| Creampot Crescent | OX17 1NU |
| Creampot Lane | OX17 1NT |
| Cropredy Lane | OX17 1AD |
| Crossing Lane | OX17 1EX |
| Crow Lane | OX17 1RL |
| Cup & Saucer | OX17 1NN |
| Fenny Compton Road | OX17 1HA |
| High Street | OX17 1NG |
| Kyetts Corner | OX17 1JW |
| Lower Farm Lane | OX17 1BJ |
| Main Street | OX17 1BB OX17 1BN OX17 1BQ OX17 1EU OX17 1QL OX17 1QN OX17 1QU OX17 1QW |
| Manor Close | OX17 1RA |
| Manor Park | OX17 1HH |
| Manor Road | OX17 1QP OX17 1QT |
| March Lane | OX17 1BP |
| Mill Cottages | OX17 1AT |
| Mollington Road | OX17 1EN |
| Mount Pleasant | OX17 1SL |
| New Place | OX17 1NY |
| New Place Corner | OX17 1NZ |
| Orchard Piece | OX17 1DP |
| Orchard View | OX17 1NR |
| Pinson Close | OX17 1FG |
| Red Lion Street | OX17 1PB OX17 1PD |
| School Lane | OX17 1QY |
| South View | OX17 1QX |
| Spring Lane | OX17 1NF OX17 1RB OX17 1RJ |
| Stanwell Lane | OX17 1QS |
| Station Road | OX17 1PP OX17 1PS OX17 1PT OX17 1PW |
| Stud Farm Close | OX17 1RX |
| Swan Lane | OX17 1QR |
| The Green | OX17 1NH OX17 1NJ OX17 1NL OX17 1QH |
| The Greensward | OX17 1RT |
| The Holt | OX17 1BE |
| The Mead | OX17 1DN |
| The Paddocks | OX17 1BW |
| The Plantation | OX17 1PN |
| The Row | OX17 1BH |
| Thorpe Road | OX17 1SR OX17 1ST |
| Uplands Rise | OX17 1RG |
| Valley View | OX17 1QJ |
| Vicarage Gardens | OX17 1PJ |
| Walnut Gardens | OX17 1NA |
| Wardington Road | OX17 2JU |
| Whiteway | OX17 1BL OX17 1DW |
| OX17 1AB OX17 1AE OX17 1AR OX17 1AY OX17 1AZ OX17 1BD OX17 1ES OX17 1EZ OX17 1PG OX17 1RE OX17 1RU OX17 1SA OX17 1SE OX17 1SH OX17 1SN OX17 1SP OX17 1SQ OX17 1SU OX17 1TD |
Transport near Cropredy
- FAQ
- Price Paid By Year
- Property Type Price
Frequently asked questions about Cropredy
What is the average price for a property for sale in Cropredy?
The average price for a property for sale in Cropredy is £482,745. This amount is 38% higher than the average price in Banbury. There are 1,928 property listings for sale in Cropredy.
What streets have the most expensive properties for sale in Cropredy?
The streets with the most expensive properties for sale in Cropredy are Station Road at an average of £748,273, Church Lane at an average of £742,500 and Church Close at an average of £617,500.
What streets have the most affordable properties for sale in Cropredy?
The streets with the most affordable properties for sale in Cropredy are Swan Lane at an average of £210,000, Cup & Saucer at an average of £229,500 and Manor Road at an average of £240,000.
Which train stations are available in or near Cropredy?
Some of the train stations available in or near Cropredy are Banbury, King's Sutton and Heyford.
Property Price Paid in Cropredy by Year
The average sold property price by year was:
| Year | Average Sold Price | Price Change |
Sold Properties
|
|---|---|---|---|
| 2025 | £427,685 | 3% |
28 Properties |
| 2024 | £414,713 | -36% |
36 Properties |
| 2023 | £563,296 | 8% |
32 Properties |
| 2022 | £519,932 | 13% |
38 Properties |
| 2021 | £450,371 | 17% |
62 Properties |
| 2020 | £374,315 | 3% |
33 Properties |
| 2019 | £363,303 | 6% |
33 Properties |
| 2018 | £341,027 | -13% |
36 Properties |
| 2017 | £385,325 | -1% |
45 Properties |
| 2016 | £391,000 | 6% |
40 Properties |
| 2015 | £365,778 | 10% |
42 Properties |
| 2014 | £330,601 | -17% |
49 Properties |
| 2013 | £386,424 | 18% |
41 Properties |
| 2012 | £316,127 | 17% |
38 Properties |
| 2011 | £263,711 | -31% |
40 Properties |
| 2010 | £344,464 | 20% |
28 Properties |
| 2009 | £276,882 | -34% |
35 Properties |
| 2008 | £370,902 | 8% |
23 Properties |
| 2007 | £340,854 | 12% |
45 Properties |
| 2006 | £298,598 | 0,2% |
65 Properties |
| 2005 | £298,016 | -6% |
36 Properties |
| 2004 | £315,662 | 22% |
61 Properties |
| 2003 | £247,077 | 17% |
49 Properties |
| 2002 | £204,703 | 17% |
61 Properties |
| 2001 | £169,224 | -12% |
61 Properties |
| 2000 | £190,363 | 16% |
49 Properties |
| 1999 | £159,086 | 6% |
67 Properties |
| 1998 | £149,411 | 16% |
57 Properties |
| 1997 | £125,786 | 26% |
67 Properties |
| 1996 | £92,986 | -8% |
68 Properties |
| 1995 | £100,003 | - |
53 Properties |
Property Price per Property Type in Cropredy
Here you can find historic sold price data in order to help with your property search.
The average Property Paid Price for specific property types in the last three years are:
| Property Type | Average Sold Price | Sold Properties |
|---|---|---|
| Semi Detached House | £393,464.00 | 29 Semi Detached Houses |
| Detached House | £562,660.00 | 82 Detached Houses |
| Terraced House | £316,259.00 | 22 Terraced Houses |
| Flat | £181,500.00 | 1 Flat |

