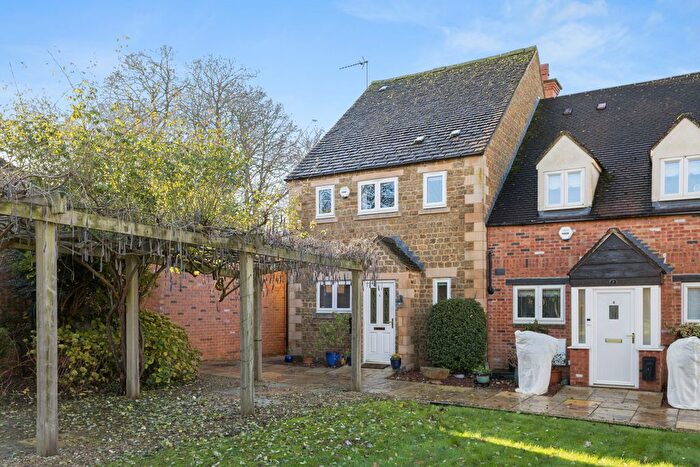
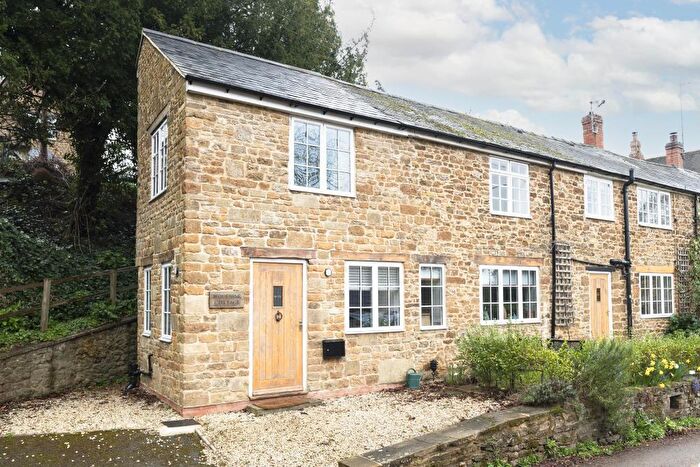
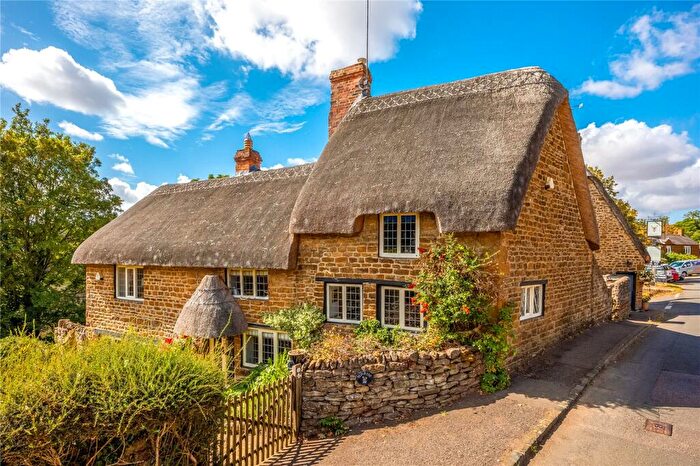
Houses for sale & to rent in Sibford, Banbury
House Prices in Sibford
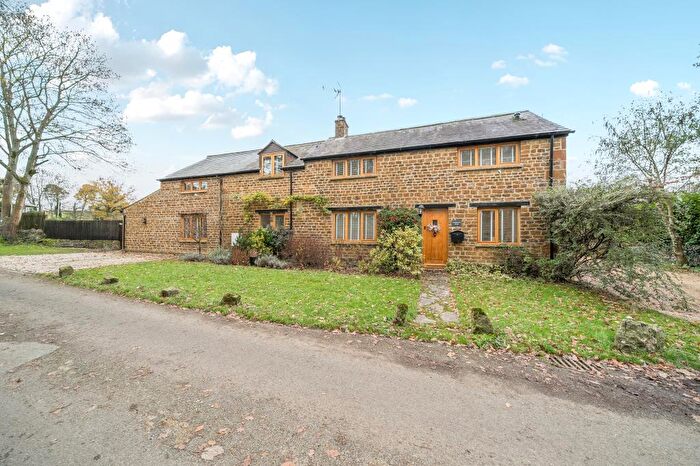
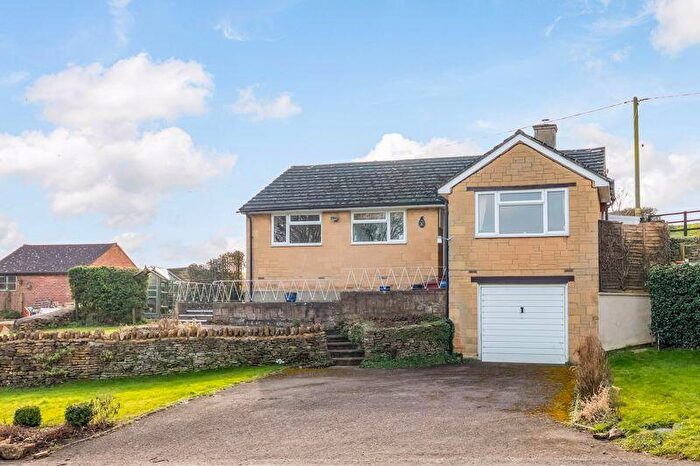
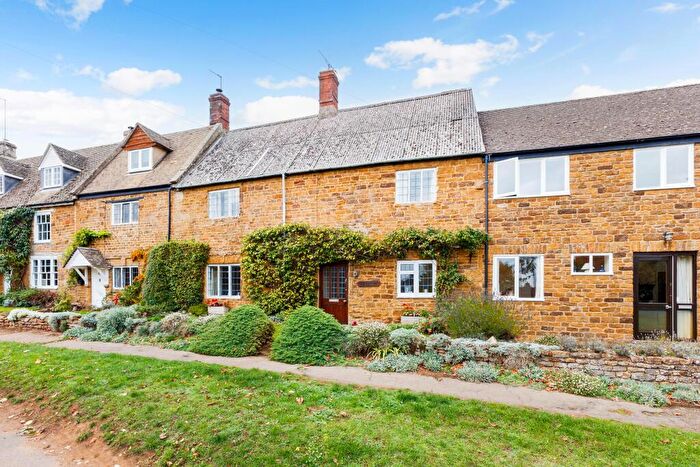
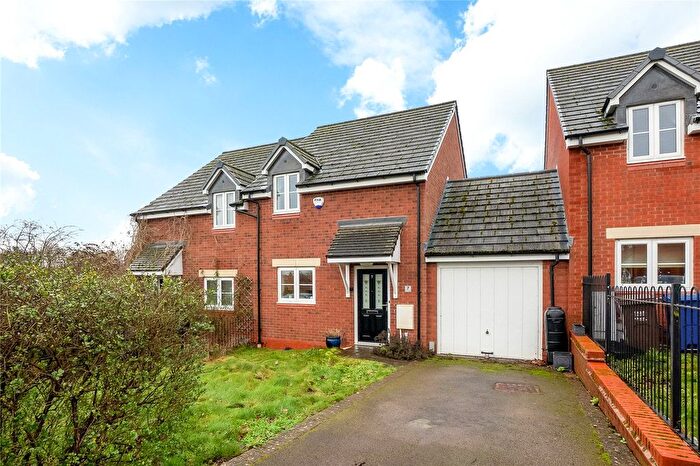
Properties in Sibford have an average house price of £602,953.00 and had 76 Property Transactions within the last 3 years¹.
Sibford is an area in Banbury, Oxfordshire with 1,004 households², where the most expensive property was sold for £1,785,000.00.
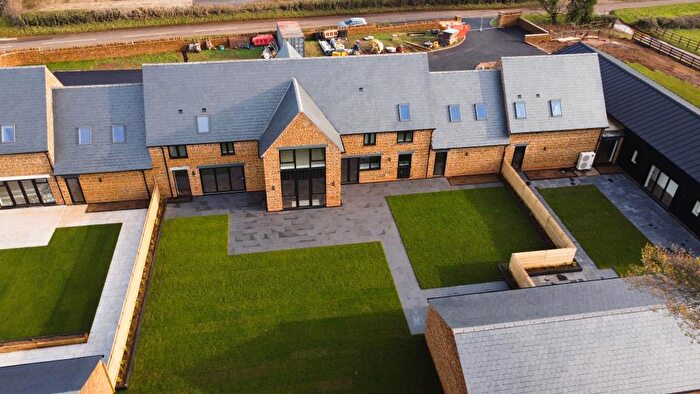
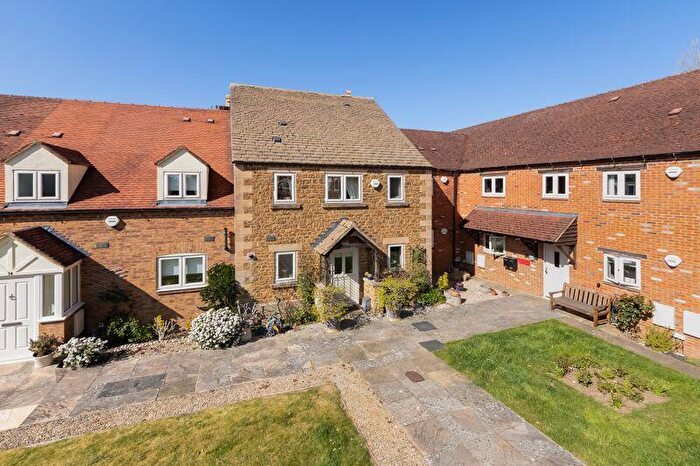
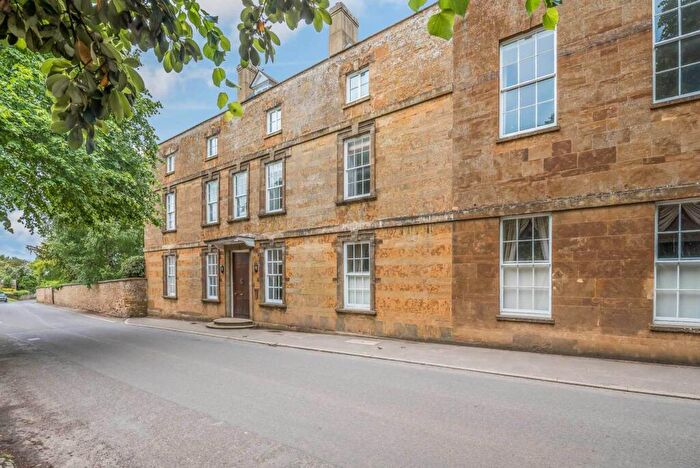
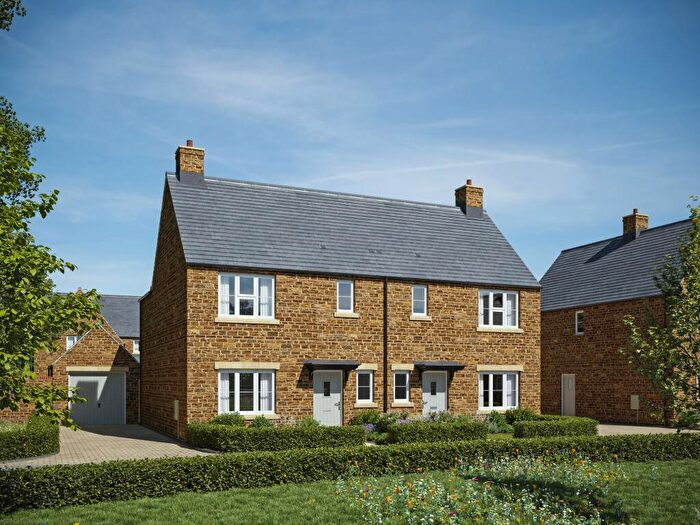
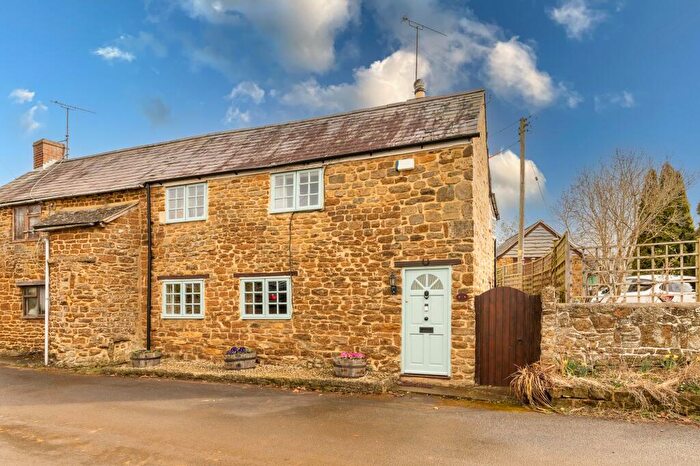
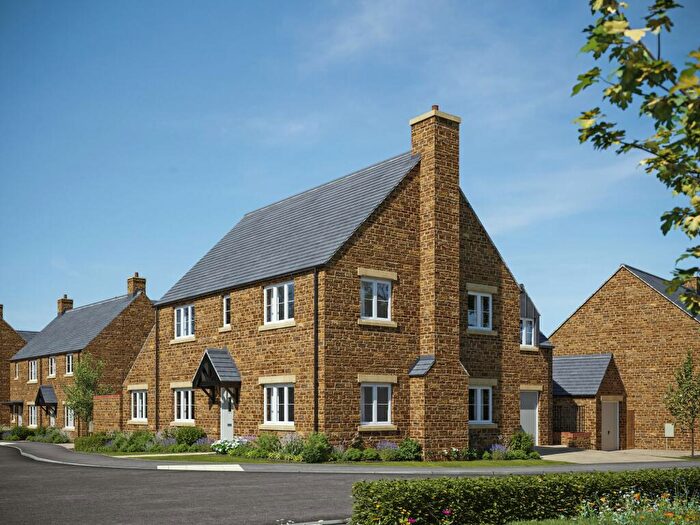
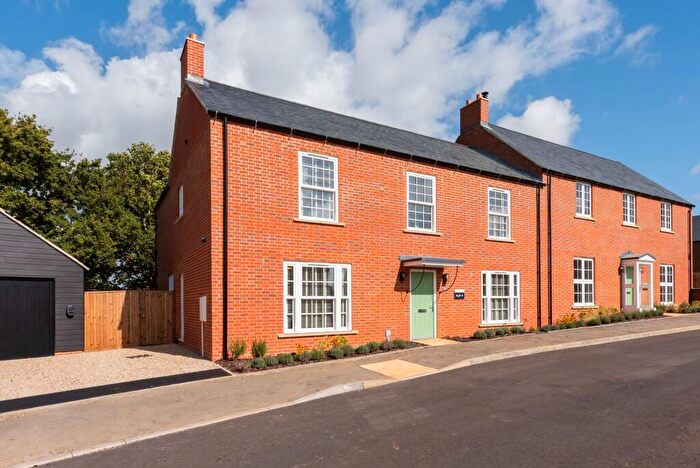
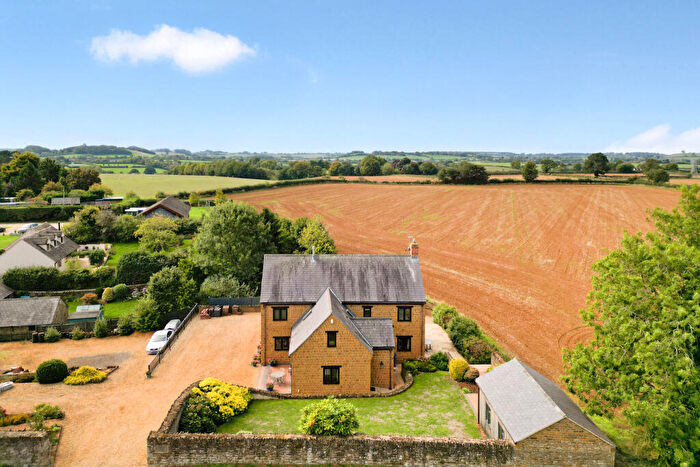
Properties for sale in Sibford
Roads and Postcodes in Sibford
Navigate through our locations to find the location of your next house in Sibford, Banbury for sale or to rent.
| Streets | Postcodes |
|---|---|
| Back Lane | OX15 6LF |
| Backside Lane | OX15 5RS |
| Bakers Lane | OX15 5EN |
| Banbury Road | OX15 6AB |
| Barley Close | OX15 5RZ |
| Birds Lane | OX15 6LQ |
| Bonds End Lane | OX15 5RP OX15 5RT |
| Brick Row | OX15 5ER |
| Church Lane | OX15 6LB OX15 6LD |
| Cotswold Close | OX15 5QP |
| Danvers Close | OX15 5DX |
| Danvers Road | OX15 5DU |
| Folly Court | OX15 5RH |
| Grange Lane | OX15 5EY |
| Green Lane | OX15 5EQ |
| Hawks Lane | OX15 5RL |
| High Meadow | OX15 5SA |
| Highlands | OX15 5SR OX15 5TJ |
| Hollow Road | OX15 5SS |
| Home Farm Court | OX15 5QT |
| Hook Norton Road | OX15 5QR OX15 5QX |
| Main Road | OX15 5DR OX15 5DY OX15 5DZ OX15 5ED OX15 5HB OX15 5SH OX15 5SJ OX15 5SL OX15 5SQ |
| Main Street | OX15 5BP OX15 6AE OX15 6AF OX15 6AJ |
| Meadow Crest Cottages | OX15 5RQ |
| North Newington Road | OX15 6AA |
| Old Forge Yard | OX15 5EH |
| Old Glebe | OX15 5TH |
| Park Cottages | OX15 5ET |
| Park Lane | OX15 5ES OX15 5EU OX15 6AD |
| Pound Lane | OX15 5RR |
| School Lane | OX15 6AQ |
| Shutford Road | OX15 6AL OX15 6AN |
| Sibford Road | OX15 6LH |
| Swalcliffe Lea | OX15 6ET |
| Swalcliffe Road | OX15 5TE |
| Sycamore Close | OX15 5SB |
| Temple Mill Road | OX15 5RX |
| Thatchers Close | OX15 6LJ |
| The Colony | OX15 5RY |
| The Green | OX15 5EJ |
| The Pound | OX15 6AG |
| The Square | OX15 5EL OX15 6LA |
| Ushercombe View | OX15 5TF |
| Walford Road | OX15 5BL |
| Woodway Road | OX15 5RF |
| Wykham Lane | OX15 5DS OX15 5DT |
| OX15 5AD OX15 5DA OX15 5QN OX15 5RA OX15 5RE OX15 5RG OX15 5RJ OX15 5RN OX15 5RW OX15 5SG OX15 5SU OX15 5SW OX15 5SY OX15 5TA OX15 5TB OX15 6AP |
Transport near Sibford
-
Banbury Station
-
King's Sutton Station
-
Heyford Station
-
Moreton-In-Marsh Station
-
Charlbury Station
-
Kingham Station
-
Tackley Station
-
Ascott-Under-Wychwood Station
-
Finstock Station
-
Shipton Station
- FAQ
- Price Paid By Year
- Property Type Price
Frequently asked questions about Sibford
What is the average price for a property for sale in Sibford?
The average price for a property for sale in Sibford is £602,953. This amount is 74% higher than the average price in Banbury. There are 416 property listings for sale in Sibford.
What streets have the most expensive properties for sale in Sibford?
The streets with the most expensive properties for sale in Sibford are School Lane at an average of £1,164,166, The Square at an average of £1,111,500 and Sibford Road at an average of £1,015,000.
What streets have the most affordable properties for sale in Sibford?
The streets with the most affordable properties for sale in Sibford are Main Road at an average of £352,650, Bakers Lane at an average of £362,000 and Danvers Close at an average of £388,833.
Which train stations are available in or near Sibford?
Some of the train stations available in or near Sibford are Banbury, King's Sutton and Heyford.
Property Price Paid in Sibford by Year
The average sold property price by year was:
| Year | Average Sold Price | Price Change |
Sold Properties
|
|---|---|---|---|
| 2025 | £544,183 | -15% |
27 Properties |
| 2024 | £625,295 | -3% |
22 Properties |
| 2023 | £643,518 | -4% |
27 Properties |
| 2022 | £669,547 | -10% |
26 Properties |
| 2021 | £734,160 | 20% |
49 Properties |
| 2020 | £587,629 | 23% |
27 Properties |
| 2019 | £453,903 | 3% |
26 Properties |
| 2018 | £440,974 | 5% |
39 Properties |
| 2017 | £420,119 | 8% |
44 Properties |
| 2016 | £387,593 | -56% |
36 Properties |
| 2015 | £606,218 | 36% |
29 Properties |
| 2014 | £387,950 | 24% |
46 Properties |
| 2013 | £296,708 | -11% |
34 Properties |
| 2012 | £328,955 | -20% |
25 Properties |
| 2011 | £394,348 | 17% |
33 Properties |
| 2010 | £329,116 | -7% |
31 Properties |
| 2009 | £351,955 | -6% |
35 Properties |
| 2008 | £372,154 | -3% |
31 Properties |
| 2007 | £383,987 | -0,2% |
43 Properties |
| 2006 | £384,748 | 8% |
62 Properties |
| 2005 | £352,128 | 4% |
44 Properties |
| 2004 | £339,766 | 20% |
52 Properties |
| 2003 | £273,119 | 9% |
53 Properties |
| 2002 | £247,253 | 10% |
74 Properties |
| 2001 | £223,710 | 11% |
70 Properties |
| 2000 | £199,106 | 6% |
46 Properties |
| 1999 | £186,337 | 3% |
56 Properties |
| 1998 | £180,192 | 31% |
42 Properties |
| 1997 | £123,640 | -8% |
53 Properties |
| 1996 | £133,375 | 11% |
46 Properties |
| 1995 | £119,368 | - |
40 Properties |
Property Price per Property Type in Sibford
Here you can find historic sold price data in order to help with your property search.
The average Property Paid Price for specific property types in the last three years are:
| Property Type | Average Sold Price | Sold Properties |
|---|---|---|
| Semi Detached House | £517,778.00 | 16 Semi Detached Houses |
| Detached House | £730,950.00 | 40 Detached Houses |
| Terraced House | £409,315.00 | 19 Terraced Houses |
| Flat | £525,000.00 | 1 Flat |

