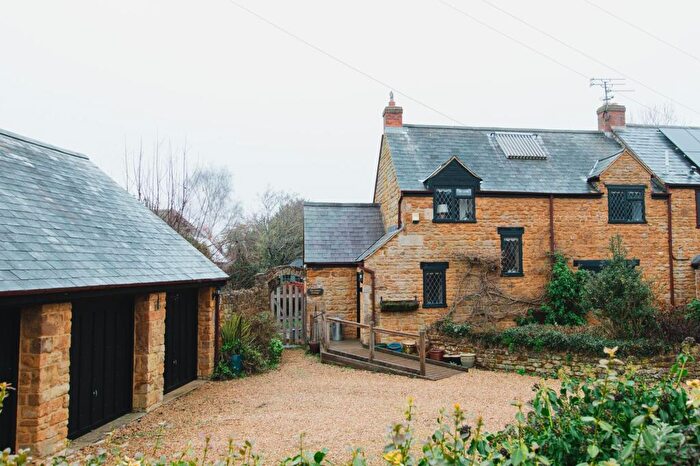
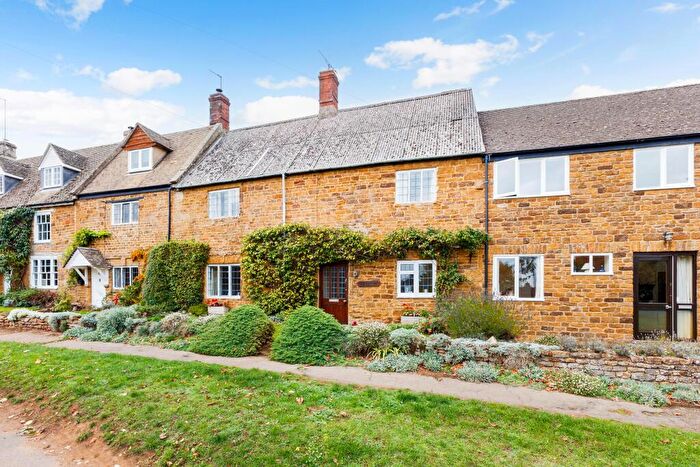
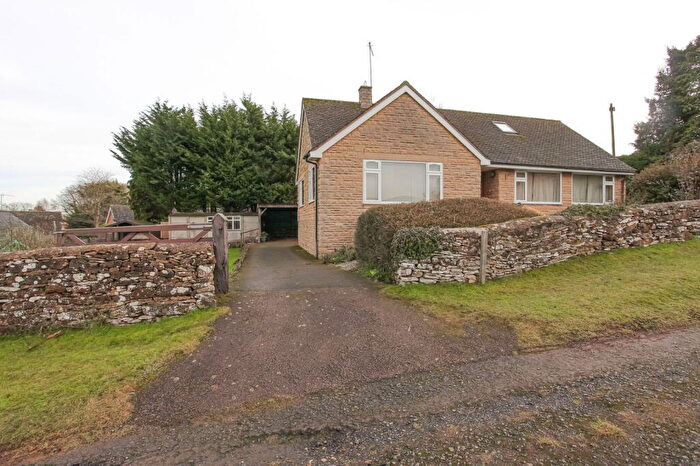
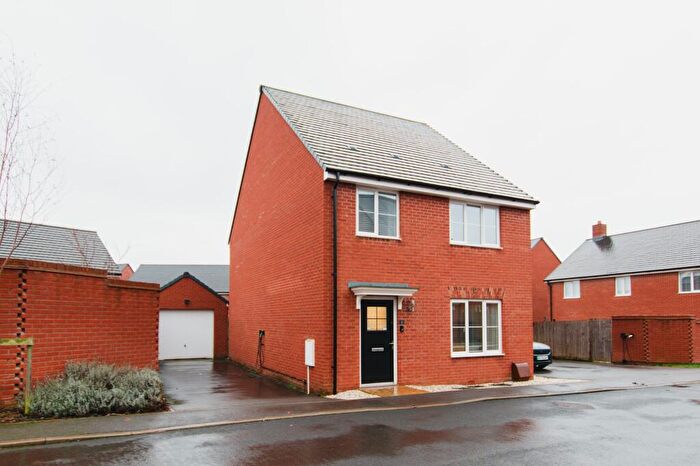
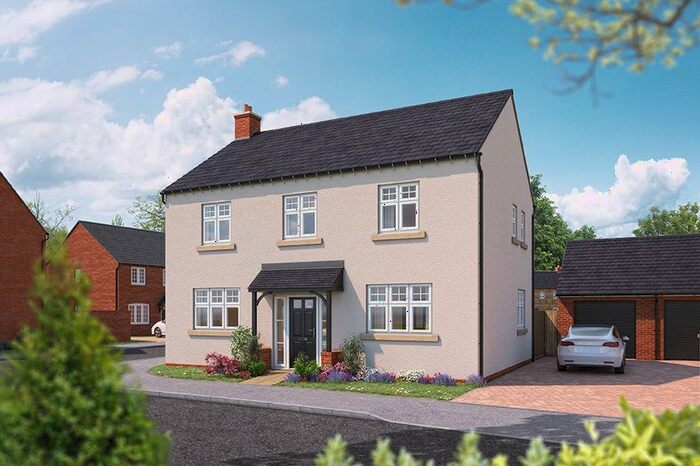
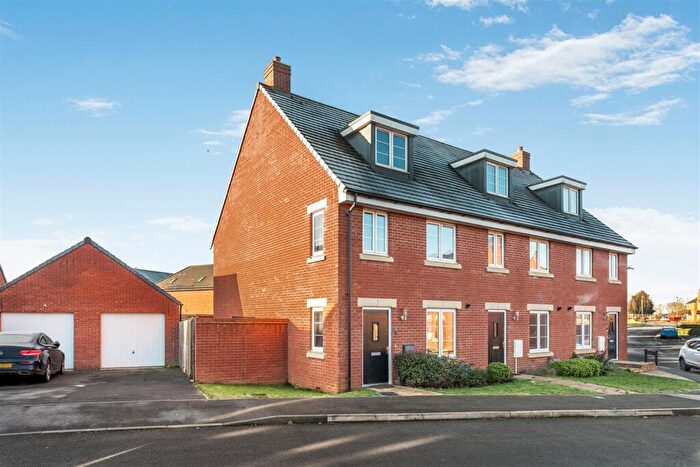
Houses for sale & to rent in Wroxton, Banbury
House Prices in Wroxton
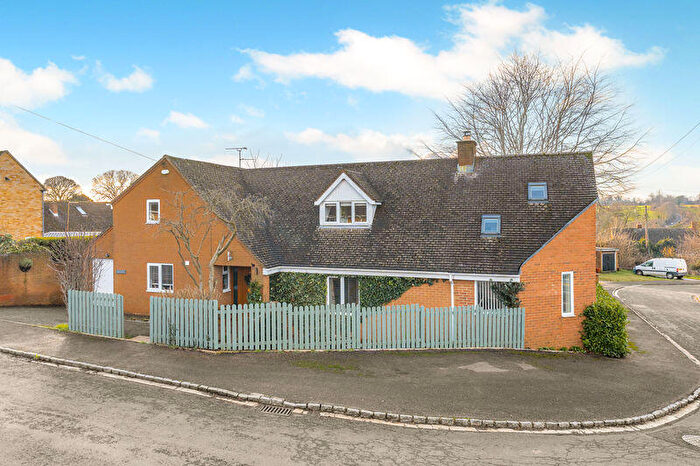
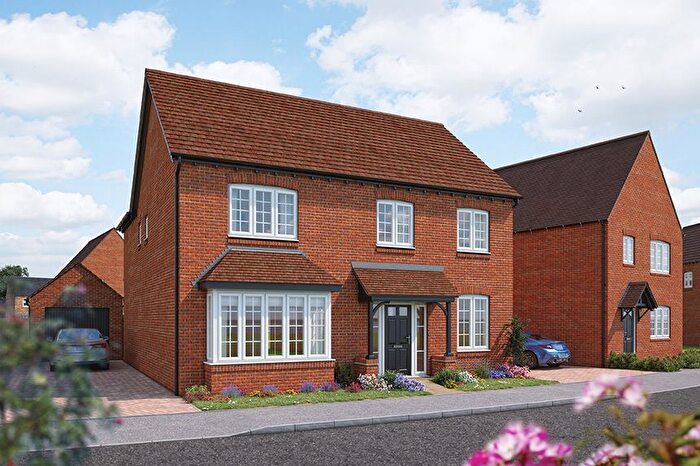
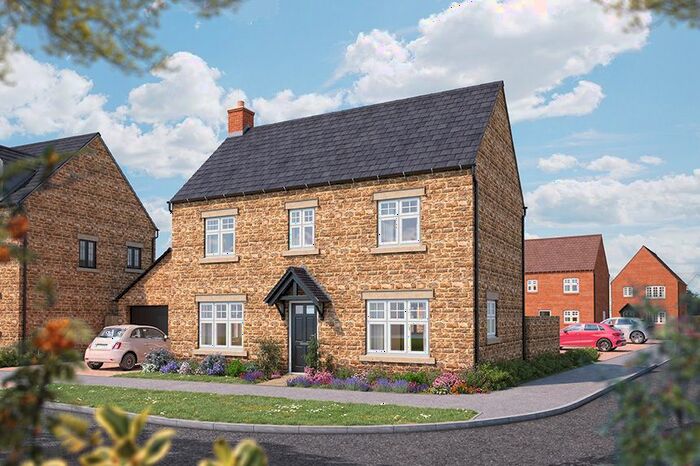
Properties in Wroxton have an average house price of £603,120.00 and had 82 Property Transactions within the last 3 years¹.
Wroxton is an area in Banbury, Oxfordshire with 1,006 households², where the most expensive property was sold for £1,750,000.00.
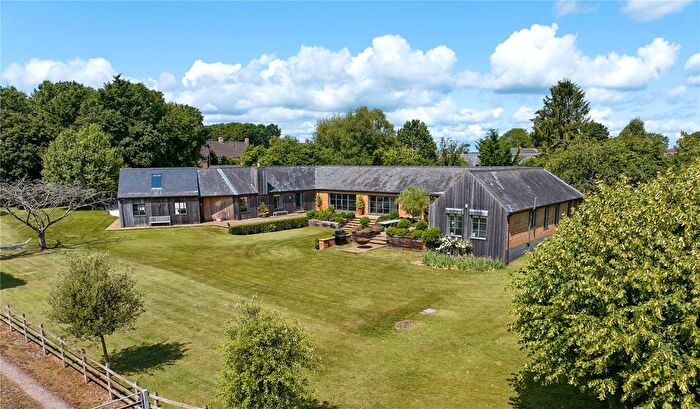
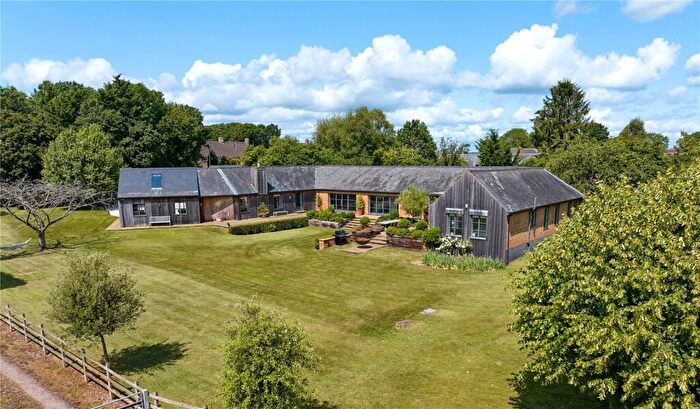
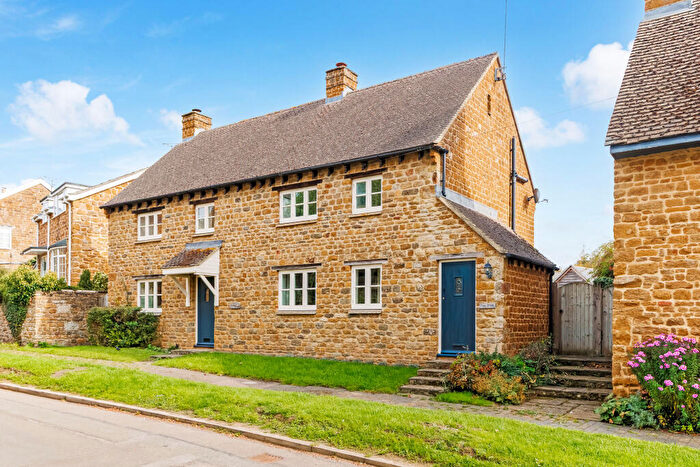
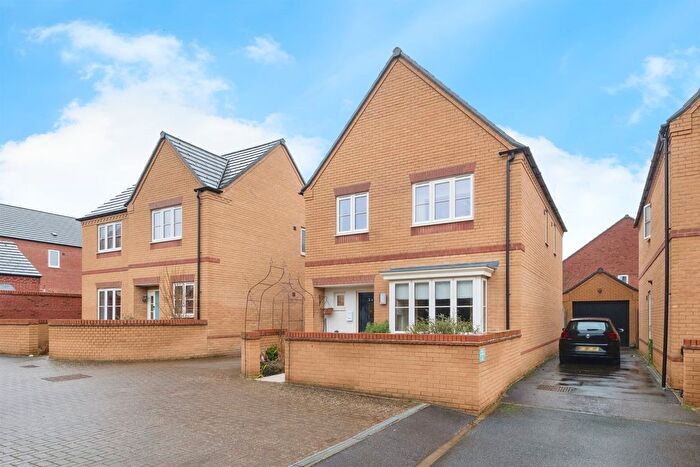
Properties for sale in Wroxton
Roads and Postcodes in Wroxton
Navigate through our locations to find the location of your next house in Wroxton, Banbury for sale or to rent.
| Streets | Postcodes |
|---|---|
| Arden Close | OX15 6EQ |
| Banbury Hill | OX15 6PE |
| Banbury Lane | OX15 6BG |
| Bell Street | OX15 6DD |
| Chapel Lane | OX15 6JN |
| Church Lane | OX15 6BY OX15 6PG |
| Church Street | OX15 6QE OX15 6QF |
| Cooks Hill | OX15 6PL |
| Dark Lane | OX15 6QQ |
| Eastgate | OX15 6BT |
| Epwell Road | OX15 6HE |
| Gullicote Lane | OX17 1HL OX17 1HQ |
| Gullivers Close | OX15 6DY |
| Hanwell Court | OX17 1HF |
| High Street | OX15 6PQ |
| Horley Path Road | OX15 6QA |
| Hornton Lane | OX15 6BL |
| Ivy Lane | OX15 6PD |
| Lampitts Green | OX15 6QH |
| Lane Close | OX15 6BH |
| Lower End | OX15 6PA |
| Main Street | OX15 6PT OX15 6QL |
| Malthouse Lane | OX15 6PB |
| Manor Farm Lane | OX15 6JJ |
| Manor Orchard | OX15 6DZ |
| Marshalls Close | OX15 6ND |
| Metcalfe Close | OX15 6EL |
| Middle Lane | OX15 6JP |
| Mill Lane | OX15 6NB |
| Millers Lane | OX15 6BS |
| Mills Lane | OX15 6PY |
| Old Council Houses | OX15 6BB |
| Pages Lane | OX15 6BX |
| Perkins Close | OX15 6BP |
| Prospect Terrace | OX15 6DB |
| Quarry Road | OX15 6DF |
| Queens Crescent | OX15 6EJ |
| Rose Cottage | OX17 1HW |
| Shutford Road | OX15 6JH OX15 6JQ OX15 6JW |
| Springfields | OX17 1HG |
| Stocking Lane | OX15 6NF |
| Stratford Road | OX15 6EE OX15 6EF OX15 6EG OX15 6EN OX15 6EU OX15 6PZ OX15 6QN OX15 6QR OX15 6QS |
| The Dairyground | OX15 6PN |
| The Green | OX15 6BZ OX15 6NE OX15 6NG OX15 6PJ |
| The Hedges | OX15 6JU |
| The Level | OX15 6NA |
| The Leys | OX15 6QW |
| The Rickyard | OX15 6PR |
| Warwick Road | OX17 1HJ |
| West End | OX15 6DA |
| West Street | OX15 6PH |
| Wroxton Court | OX15 6QT |
| Wroxton Lane | OX15 6BD |
| OX15 6BA OX15 6BE OX15 6BJ OX15 6BQ OX15 6BW OX15 6DE OX15 6EH OX15 6JD OX15 6JL OX15 6LZ OX15 6NH OX15 6NJ OX15 6NL OX15 6NP OX15 6NQ OX15 6QG OX17 1HN OX17 1HP OX17 1HR |
Transport near Wroxton
-
Banbury Station
-
King's Sutton Station
-
Heyford Station
-
Moreton-In-Marsh Station
-
Tackley Station
-
Charlbury Station
- FAQ
- Price Paid By Year
- Property Type Price
Frequently asked questions about Wroxton
What is the average price for a property for sale in Wroxton?
The average price for a property for sale in Wroxton is £603,120. This amount is 74% higher than the average price in Banbury. There are 1,133 property listings for sale in Wroxton.
What streets have the most expensive properties for sale in Wroxton?
The streets with the most expensive properties for sale in Wroxton are Quarry Road at an average of £1,263,333, Main Street at an average of £907,500 and Eastgate at an average of £900,000.
What streets have the most affordable properties for sale in Wroxton?
The streets with the most affordable properties for sale in Wroxton are Lower End at an average of £277,125, West Street at an average of £312,916 and Metcalfe Close at an average of £358,500.
Which train stations are available in or near Wroxton?
Some of the train stations available in or near Wroxton are Banbury, King's Sutton and Heyford.
Property Price Paid in Wroxton by Year
The average sold property price by year was:
| Year | Average Sold Price | Price Change |
Sold Properties
|
|---|---|---|---|
| 2025 | £588,500 | -8% |
27 Properties |
| 2024 | £633,769 | 8% |
28 Properties |
| 2023 | £585,956 | -11% |
27 Properties |
| 2022 | £650,361 | 14% |
28 Properties |
| 2021 | £557,729 | -3% |
48 Properties |
| 2020 | £572,498 | 26% |
25 Properties |
| 2019 | £425,038 | -9% |
26 Properties |
| 2018 | £464,291 | 4% |
36 Properties |
| 2017 | £444,689 | -4% |
37 Properties |
| 2016 | £462,252 | 19% |
46 Properties |
| 2015 | £376,579 | 2% |
39 Properties |
| 2014 | £368,845 | -22% |
48 Properties |
| 2013 | £448,305 | -5% |
34 Properties |
| 2012 | £470,588 | 14% |
31 Properties |
| 2011 | £404,376 | -9% |
31 Properties |
| 2010 | £440,466 | 7% |
43 Properties |
| 2009 | £410,022 | 15% |
23 Properties |
| 2008 | £350,143 | 3% |
25 Properties |
| 2007 | £339,476 | -8% |
38 Properties |
| 2006 | £366,888 | 5% |
70 Properties |
| 2005 | £347,451 | 6% |
41 Properties |
| 2004 | £328,231 | 14% |
52 Properties |
| 2003 | £282,669 | 12% |
51 Properties |
| 2002 | £249,197 | 8% |
47 Properties |
| 2001 | £228,364 | 17% |
59 Properties |
| 2000 | £188,472 | - |
53 Properties |
| 1999 | £188,395 | 23% |
55 Properties |
| 1998 | £144,125 | -4% |
47 Properties |
| 1997 | £149,228 | 23% |
63 Properties |
| 1996 | £114,720 | 2% |
60 Properties |
| 1995 | £112,804 | - |
49 Properties |
Property Price per Property Type in Wroxton
Here you can find historic sold price data in order to help with your property search.
The average Property Paid Price for specific property types in the last three years are:
| Property Type | Average Sold Price | Sold Properties |
|---|---|---|
| Semi Detached House | £429,732.00 | 13 Semi Detached Houses |
| Detached House | £735,718.00 | 52 Detached Houses |
| Terraced House | £362,833.00 | 15 Terraced Houses |
| Flat | £84,750.00 | 2 Flats |

