
Houses for sale & to rent in Bicester East, Bicester
House Prices in Bicester East
Properties in Bicester East have an average house price of £334k and had 220 Property Transactions within the last 3 years¹.
Bicester East is an area in Bicester, Oxfordshire with 2,385 households², where the most expensive property was sold for £700k.
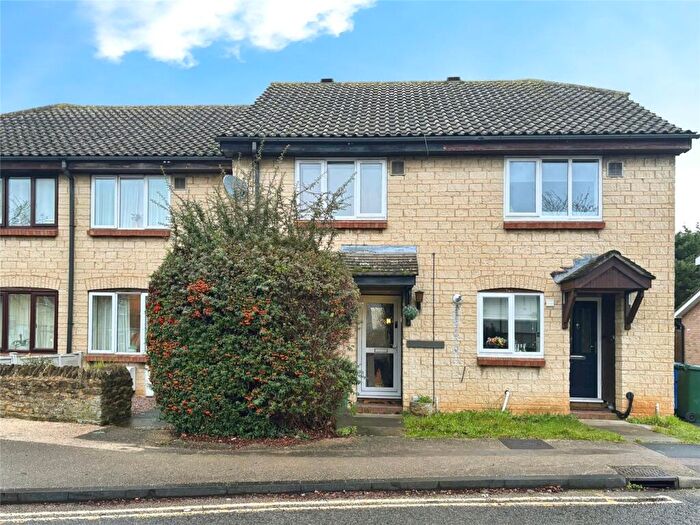
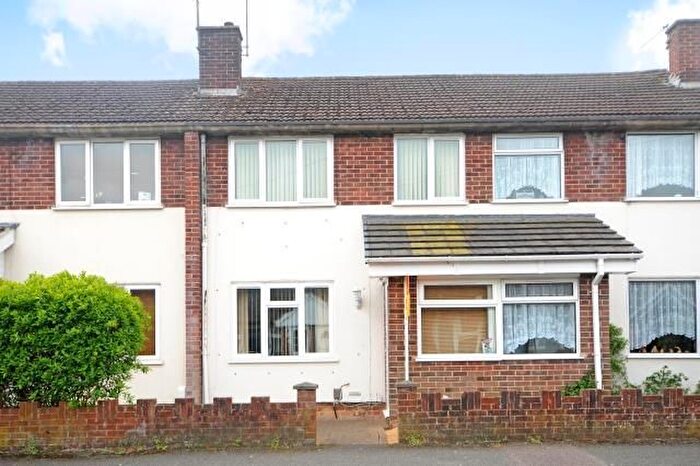
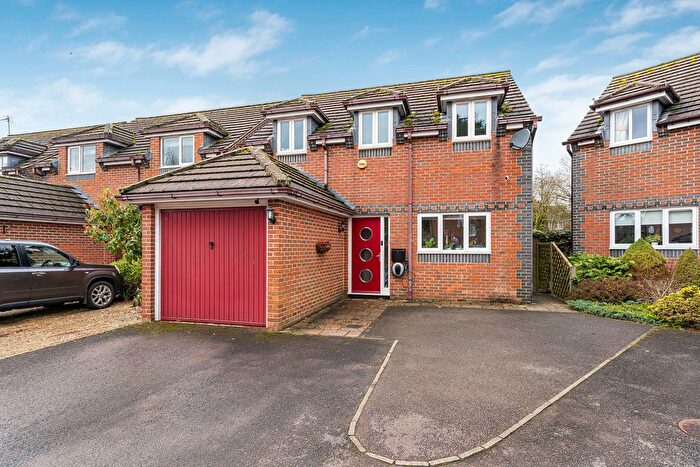
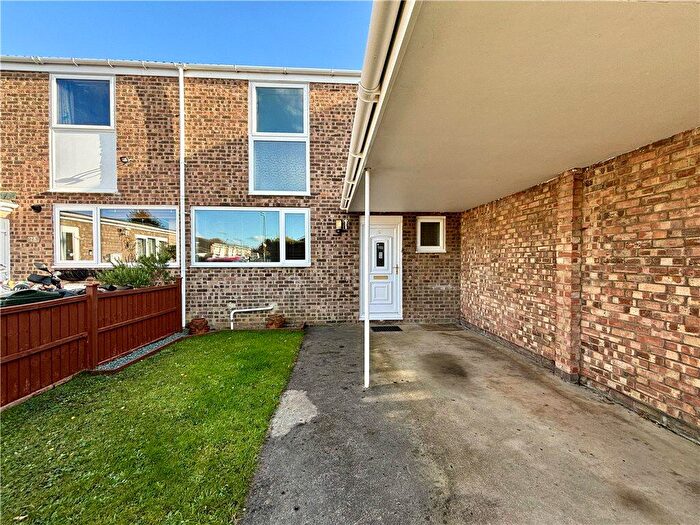
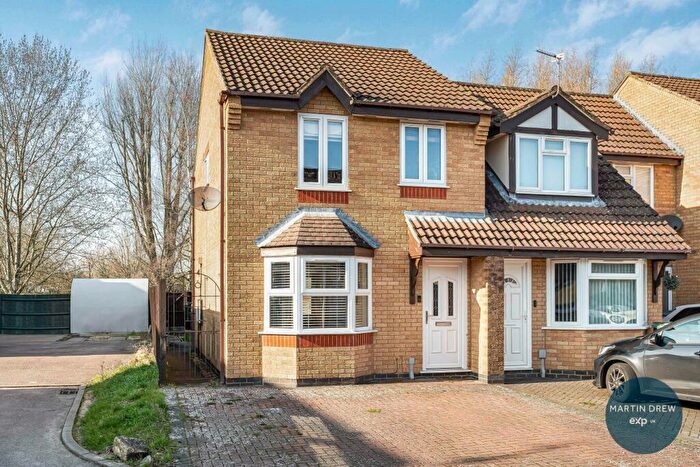
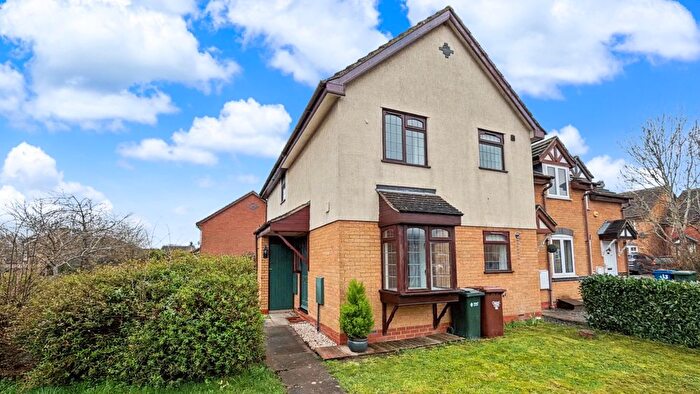
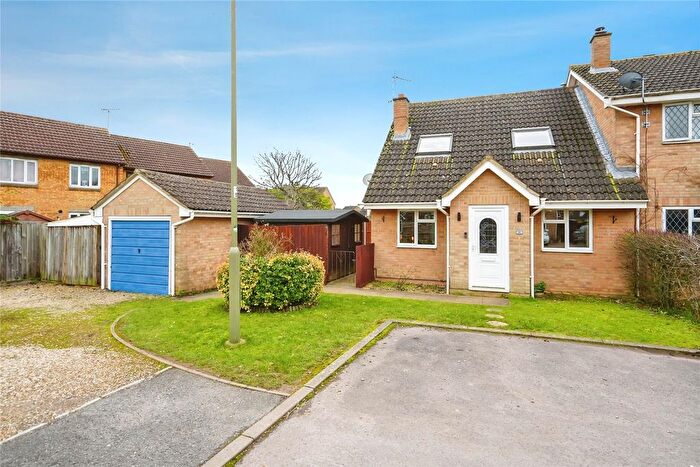
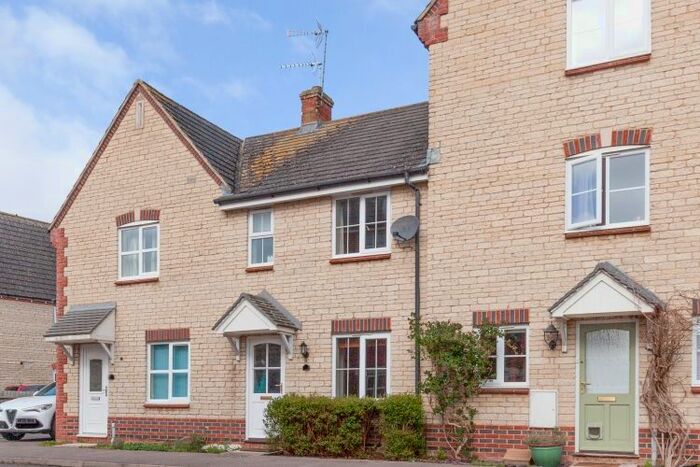
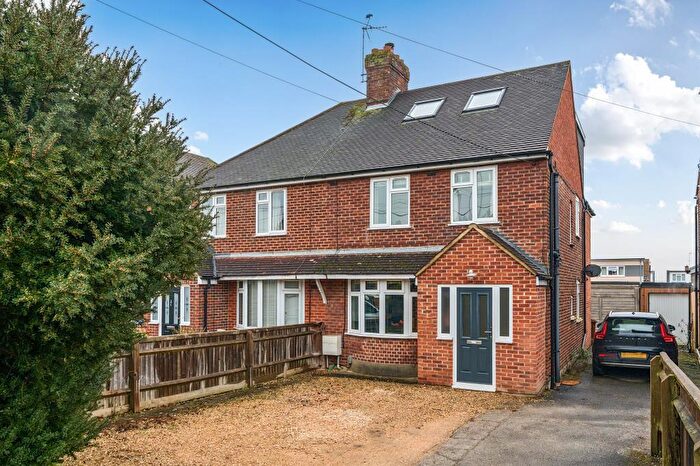
Properties for sale in Bicester East
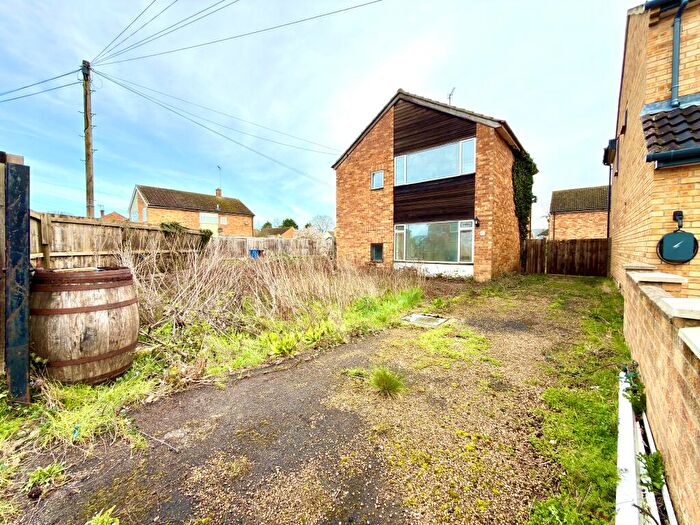
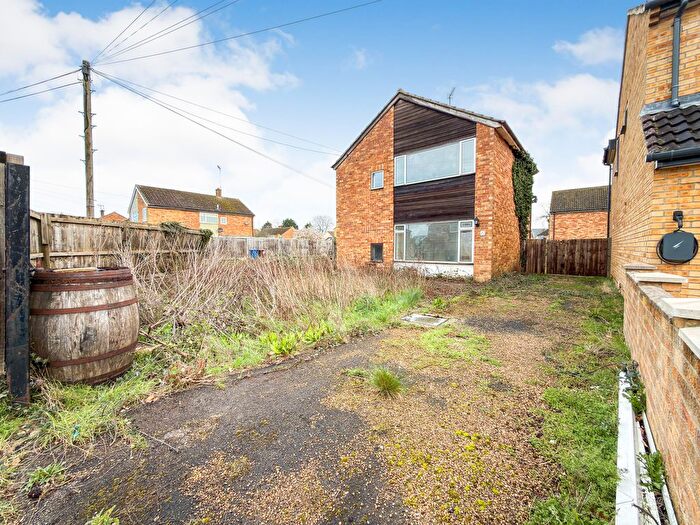
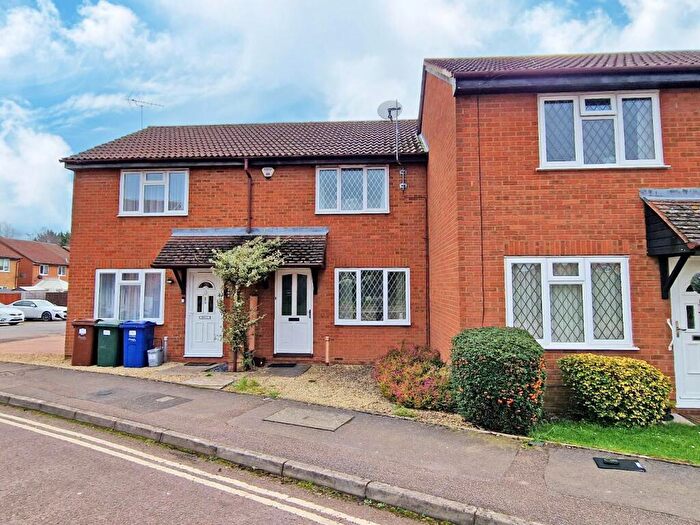
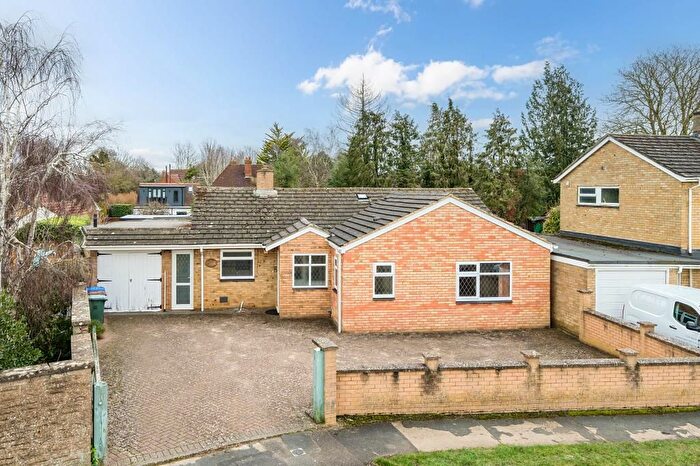

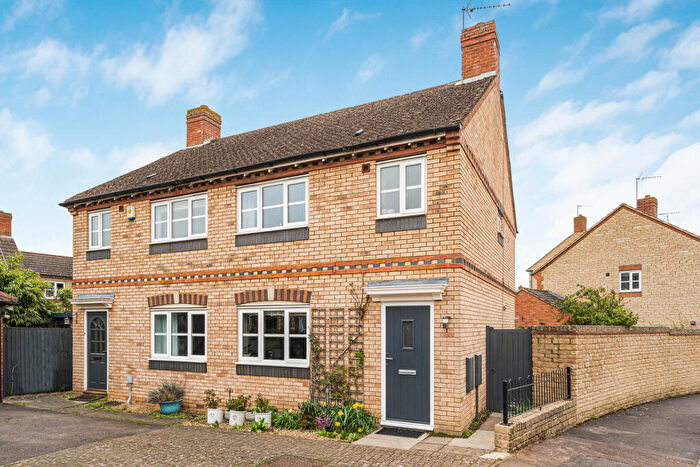
![]()
If you are looking to sell your house, let it out, or receive a property valuation, an expert can help you.
Click the button below to get started.
Roads and Postcodes in Bicester East
Navigate through our locations to find the location of your next house in Bicester East, Bicester for sale or to rent.
Transport near Bicester East
-
 Bicester North Station
 -
Bicester Village Station
-
Islip Station
-
Heyford Station
-
Tackley Station
-
Oxford Parkway Station
- FAQ
- Price Paid By Year
- Property Type Price
Frequently asked questions about Bicester East
What is the average price for a property for sale in Bicester East?
The average price for a property for sale in Bicester East is £333,707. This amount is 17% lower than the average price in Bicester. There are 1,614 property listings for sale in Bicester East.
What streets have the most expensive properties for sale in Bicester East?
The streets with the most expensive properties for sale in Bicester East are Deans Court at an average of £535,000, Buckingham Road at an average of £509,400 and Vulcan View at an average of £450,000.
What streets have the most affordable properties for sale in Bicester East?
The streets with the most affordable properties for sale in Bicester East are North Street at an average of £180,000, Linden Road at an average of £216,666 and Warwick Court at an average of £221,000.
Which train stations are available in or near Bicester East?
Some of the train stations available in or near Bicester East are Bicester North, Bicester Village and Islip.
Property Price Paid in Bicester East by Year
The average sold property price by year was:
| Year | Average Sold Price | Price Change |
Sold Properties
|
|---|---|---|---|
| 2025 | £337,226 | 2% |
64 Properties |
| 2024 | £329,882 | -1% |
80 Properties |
| 2023 | £334,771 | -2% |
76 Properties |
| 2022 | £341,063 | 11% |
94 Properties |
| 2021 | £302,129 | 1% |
126 Properties |
| 2020 | £299,023 | -2% |
82 Properties |
| 2019 | £306,263 | 2% |
117 Properties |
| 2018 | £300,269 | 7% |
104 Properties |
| 2017 | £278,986 | -1% |
126 Properties |
| 2016 | £280,473 | 10% |
90 Properties |
| 2015 | £251,161 | 6% |
90 Properties |
| 2014 | £237,336 | 9% |
107 Properties |
| 2013 | £215,479 | 12% |
115 Properties |
| 2012 | £190,166 | -0,4% |
81 Properties |
| 2011 | £190,881 | -2% |
53 Properties |
| 2010 | £195,487 | 5% |
63 Properties |
| 2009 | £185,557 | -9% |
73 Properties |
| 2008 | £202,072 | 0,5% |
54 Properties |
| 2007 | £201,076 | 9% |
120 Properties |
| 2006 | £182,721 | 6% |
147 Properties |
| 2005 | £172,115 | 2% |
117 Properties |
| 2004 | £167,978 | 10% |
178 Properties |
| 2003 | £150,468 | 13% |
155 Properties |
| 2002 | £130,592 | 12% |
195 Properties |
| 2001 | £115,426 | 13% |
176 Properties |
| 2000 | £100,734 | 8% |
142 Properties |
| 1999 | £93,018 | 17% |
184 Properties |
| 1998 | £77,001 | 12% |
178 Properties |
| 1997 | £67,804 | 9% |
181 Properties |
| 1996 | £62,032 | -6% |
160 Properties |
| 1995 | £65,535 | - |
197 Properties |
Property Price per Property Type in Bicester East
Here you can find historic sold price data in order to help with your property search.
The average Property Paid Price for specific property types in the last three years are:
| Property Type | Average Sold Price | Sold Properties |
|---|---|---|
| Flat | £205,821.00 | 14 Flats |
| Semi Detached House | £337,791.00 | 74 Semi Detached Houses |
| Detached House | £448,153.00 | 41 Detached Houses |
| Terraced House | £298,498.00 | 91 Terraced Houses |