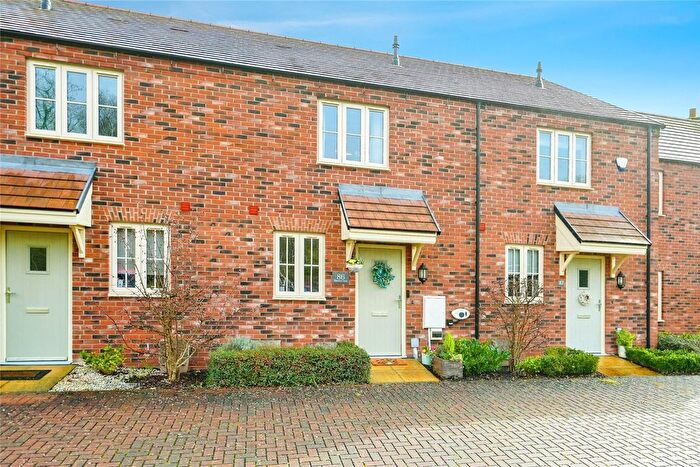
Houses for sale & to rent in Bicester South, Bicester
House Prices in Bicester South
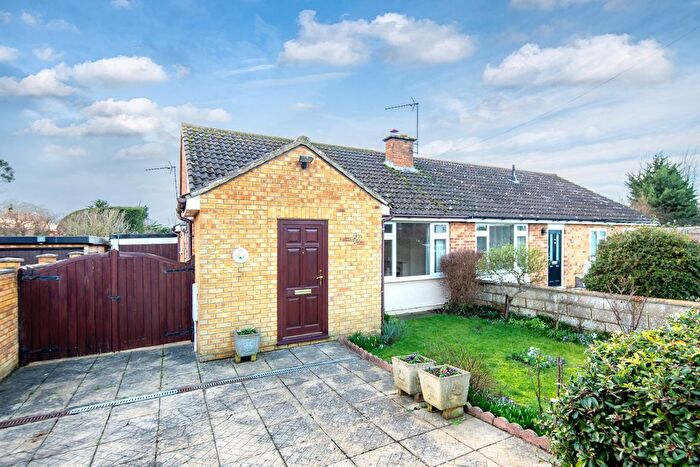
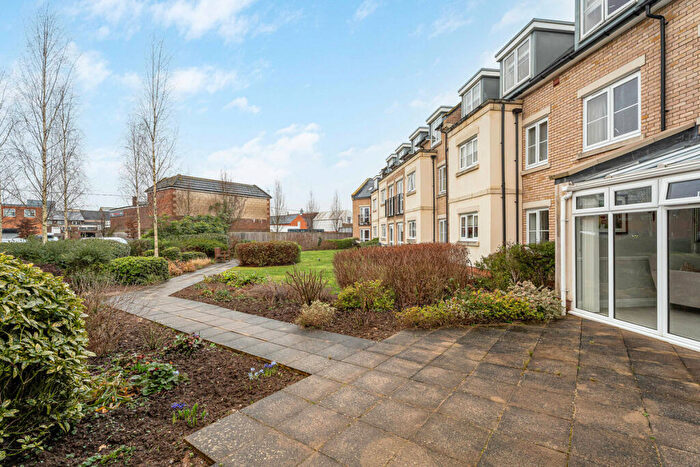
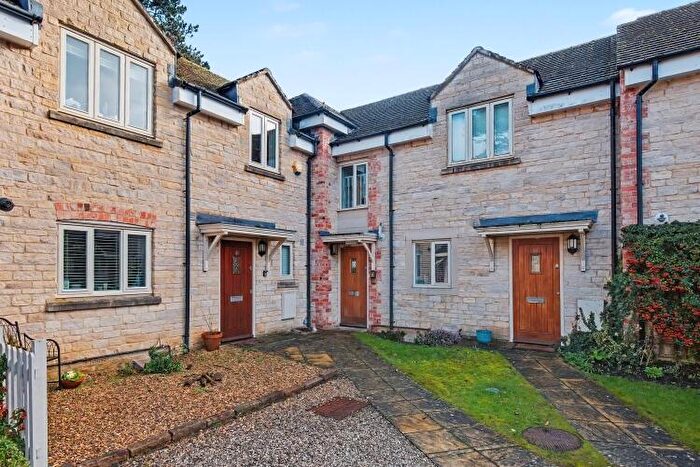
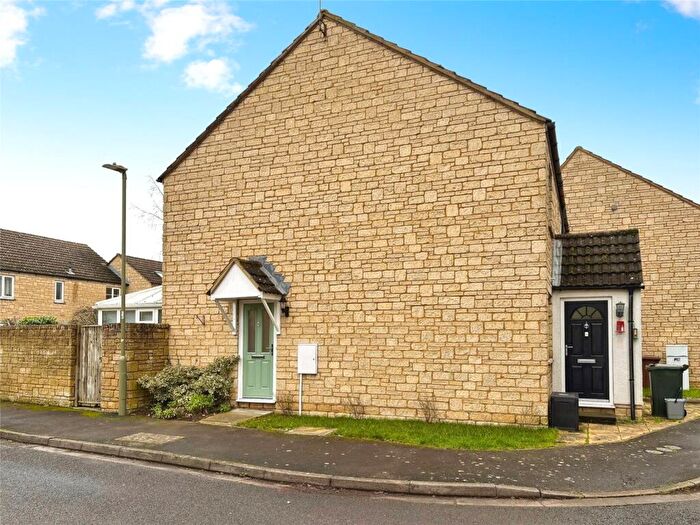
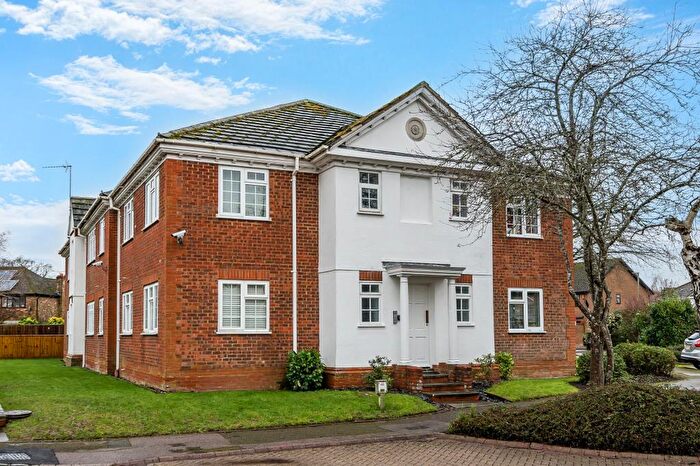
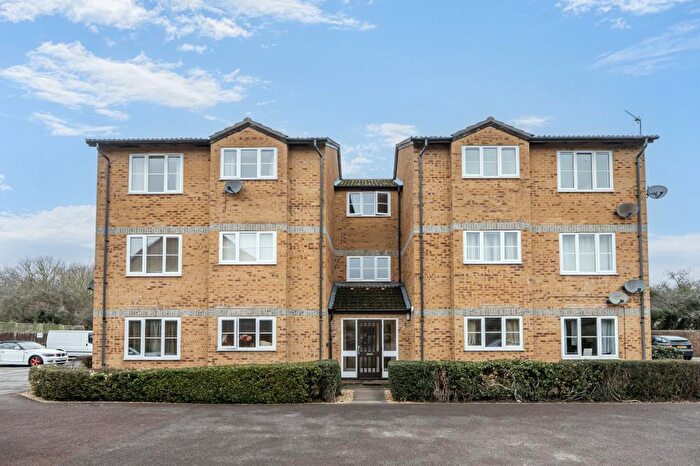
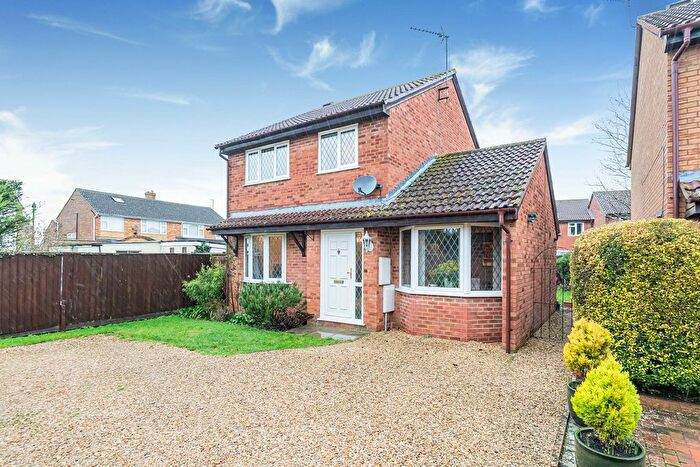
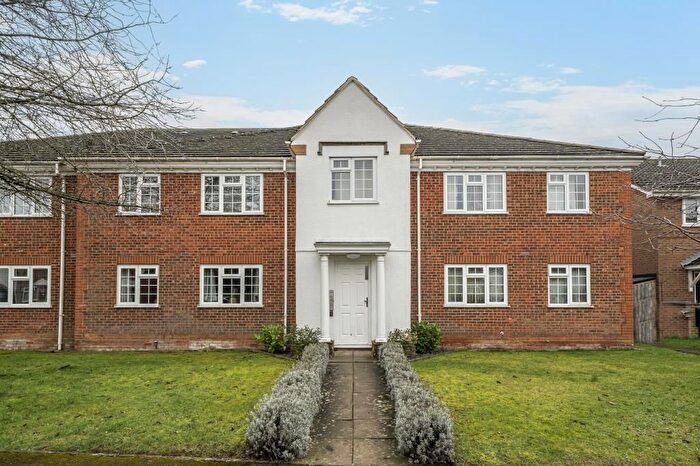
Properties in Bicester South have an average house price of £348,200.00 and had 245 Property Transactions within the last 3 years¹.
Bicester South is an area in Bicester, Oxfordshire with 2,099 households², where the most expensive property was sold for £740,000.00.
Properties for sale in Bicester South
Roads and Postcodes in Bicester South
Navigate through our locations to find the location of your next house in Bicester South, Bicester for sale or to rent.
| Streets | Postcodes |
|---|---|
| Avocet Way | OX26 6YN OX26 6YP OX26 6YW |
| Coach House Mews | OX26 6EW OX26 6HJ |
| Corncrake Way | OX26 6UE OX26 6UF |
| Dunlin Court | OX26 6WQ |
| Dunnock Close | OX26 6WZ |
| Falcon Mead | OX26 6XE OX26 6YU |
| Fieldfare Close | OX26 6EP |
| Goldcrest Way | OX26 6XD OX26 6XL OX26 6XS |
| Goldfinch Close | OX26 6EN OX26 6TZ |
| Grebe Road | OX26 6EL OX26 6TY OX26 6WG |
| Hawksmead | OX26 6ST |
| Heron Court | OX26 6XU |
| Heron Drive | OX26 6YJ OX26 6YY OX26 6YZ |
| Jay Close | OX26 6XN |
| Kestrel Way | OX26 6XZ OX26 6YA |
| Kingfisher Way | OX26 6YB OX26 6YD |
| Lapwing Close | OX26 6XR |
| London Road | OX26 6HB OX26 6HD |
| Mallards Way | OX26 6UA OX26 6WT OX26 6WU |
| Martin Close | OX26 6XA |
| Merganser Drive | OX26 6UG OX26 6UQ OX26 6XT |
| Merlin Way | OX26 6SS OX26 6YG |
| Nuthatch Way | OX26 6EQ |
| Osprey Close | OX26 6YH |
| Parkland Place | OX26 6UH |
| Partridge Chase | OX26 6XF |
| Peregrine Way | OX26 6XB |
| Pipits Croft | OX26 6XW |
| Ravencroft | OX26 6YE OX26 6YF OX26 6YQ |
| Redwing Close | OX26 6SR |
| Robins Way | OX26 6XJ |
| Sanderling Close | OX26 6WF |
| Sandpiper Close | OX26 6UX |
| Shearwater Drive | OX26 6YR OX26 6YS |
| Siskin Road | OX26 6UD OX26 6WX |
| Swallow Close | OX26 6YL |
| Swansfield | OX26 6YX |
| The Bramblings | OX26 6SU OX26 6UB |
| The Buntings | OX26 6WE |
| Turnstone Green | OX26 6TT |
| Whimbrel Close | OX26 6XP |
| Woodpecker Close | OX26 6WY |
| Wren Way | OX26 6UJ |
Transport near Bicester South
-
Bicester Village Station
-
Bicester North Station
-
Islip Station
-
Tackley Station
-
Heyford Station
-
Oxford Parkway Station
- FAQ
- Price Paid By Year
- Property Type Price
Frequently asked questions about Bicester South
What is the average price for a property for sale in Bicester South?
The average price for a property for sale in Bicester South is £348,200. This amount is 13% lower than the average price in Bicester. There are 1,114 property listings for sale in Bicester South.
What streets have the most expensive properties for sale in Bicester South?
The streets with the most expensive properties for sale in Bicester South are Turnstone Green at an average of £705,625, Jay Close at an average of £584,250 and The Buntings at an average of £537,500.
What streets have the most affordable properties for sale in Bicester South?
The streets with the most affordable properties for sale in Bicester South are Coach House Mews at an average of £193,166, London Road at an average of £210,000 and Heron Drive at an average of £244,739.
Which train stations are available in or near Bicester South?
Some of the train stations available in or near Bicester South are Bicester Village, Bicester North and Islip.
Property Price Paid in Bicester South by Year
The average sold property price by year was:
| Year | Average Sold Price | Price Change |
Sold Properties
|
|---|---|---|---|
| 2025 | £369,739 | 12% |
97 Properties |
| 2024 | £327,168 | -5% |
85 Properties |
| 2023 | £343,412 | 3% |
63 Properties |
| 2022 | £334,291 | -0,3% |
83 Properties |
| 2021 | £335,371 | 7% |
135 Properties |
| 2020 | £310,346 | 8% |
74 Properties |
| 2019 | £286,362 | -0,1% |
75 Properties |
| 2018 | £286,556 | -4% |
101 Properties |
| 2017 | £297,023 | 1% |
106 Properties |
| 2016 | £294,203 | 6% |
97 Properties |
| 2015 | £275,206 | 13% |
115 Properties |
| 2014 | £240,746 | 7% |
122 Properties |
| 2013 | £224,056 | 2% |
124 Properties |
| 2012 | £220,493 | -2% |
104 Properties |
| 2011 | £224,325 | 6% |
102 Properties |
| 2010 | £210,642 | 5% |
83 Properties |
| 2009 | £200,304 | -17% |
109 Properties |
| 2008 | £234,505 | 5% |
92 Properties |
| 2007 | £223,257 | 12% |
210 Properties |
| 2006 | £196,994 | 3% |
262 Properties |
| 2005 | £191,034 | 3% |
200 Properties |
| 2004 | £184,675 | 10% |
288 Properties |
| 2003 | £166,077 | 5% |
288 Properties |
| 2002 | £158,315 | 18% |
379 Properties |
| 2001 | £129,217 | 6% |
365 Properties |
| 2000 | £121,025 | 23% |
383 Properties |
| 1999 | £93,574 | 6% |
324 Properties |
| 1998 | £88,320 | 4% |
253 Properties |
| 1997 | £84,583 | 6% |
336 Properties |
| 1996 | £79,796 | 6% |
377 Properties |
| 1995 | £74,621 | - |
257 Properties |
Property Price per Property Type in Bicester South
Here you can find historic sold price data in order to help with your property search.
The average Property Paid Price for specific property types in the last three years are:
| Property Type | Average Sold Price | Sold Properties |
|---|---|---|
| Semi Detached House | £336,590.00 | 56 Semi Detached Houses |
| Detached House | £507,114.00 | 65 Detached Houses |
| Terraced House | £296,494.00 | 94 Terraced Houses |
| Flat | £187,566.00 | 30 Flats |

