
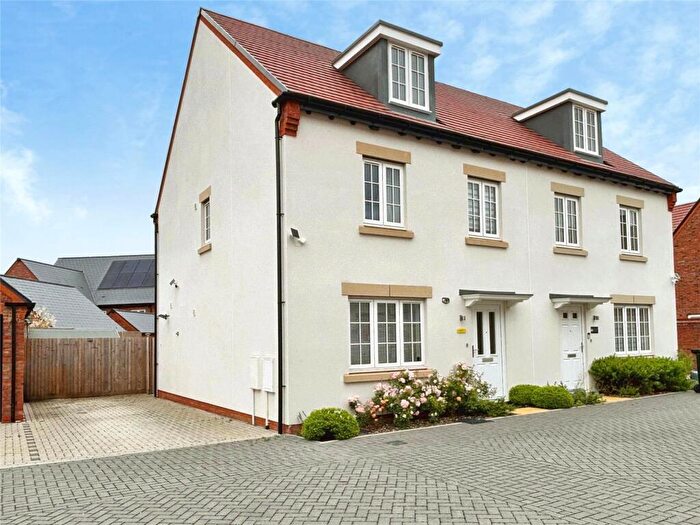
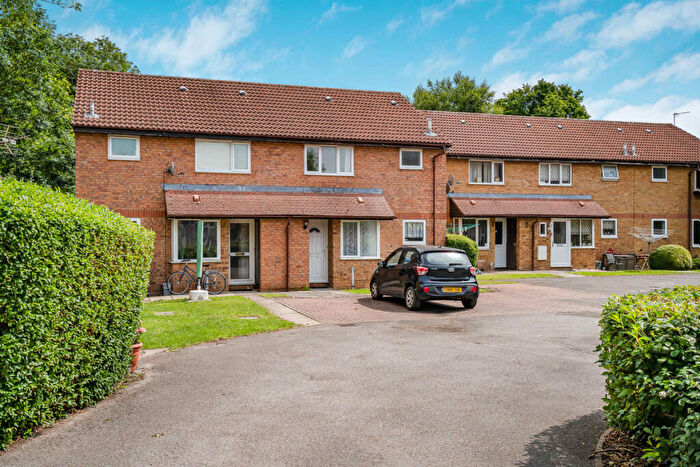
Houses for sale in Bicester, Oxfordshire
House Prices in Bicester
Properties in Bicester have an average house price of £400k and had 2,351 Property Transactions within the last 3 years.¹
Bicester is an area in Oxfordshire with 22,573 households², where the most expensive property was sold for £31.5M.
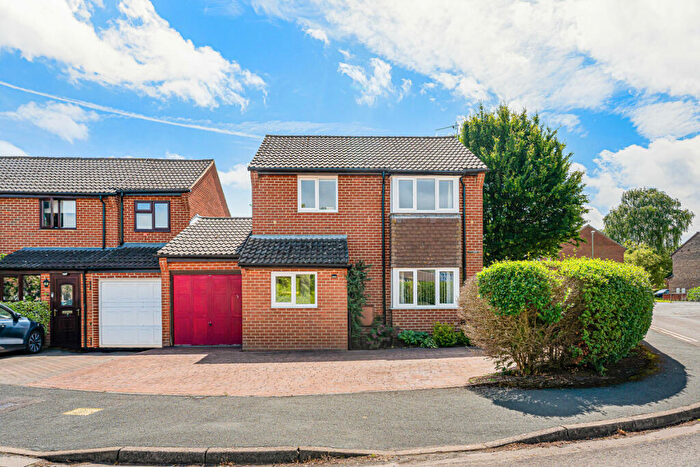
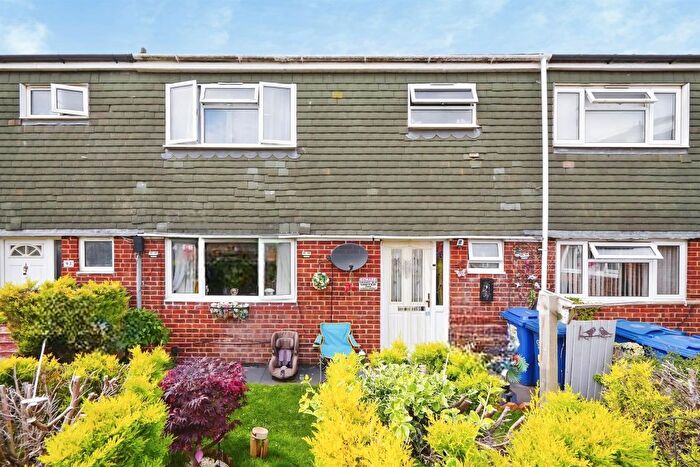
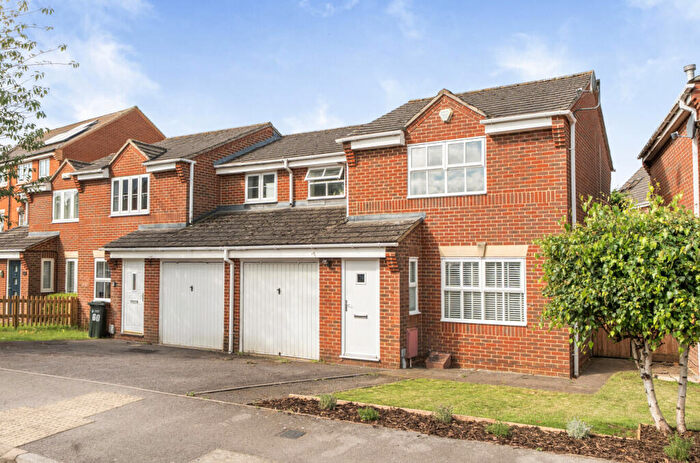
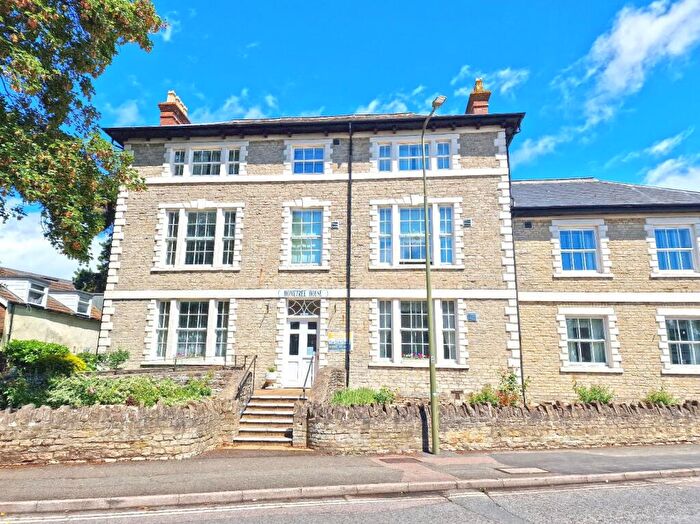
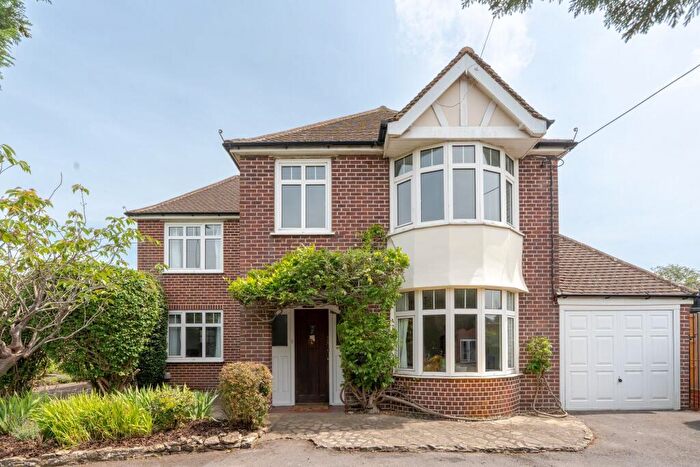
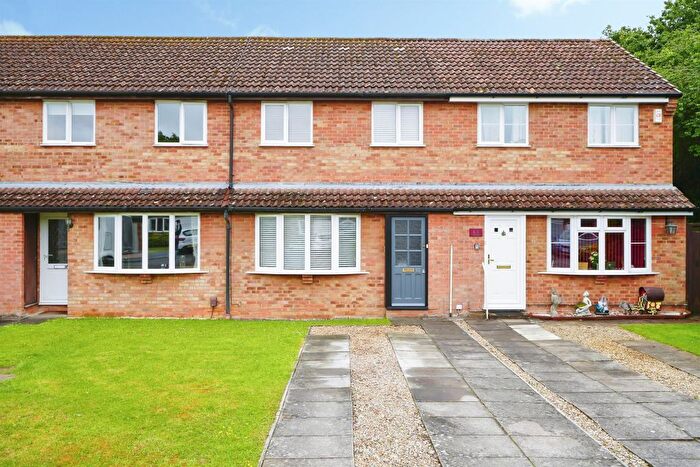
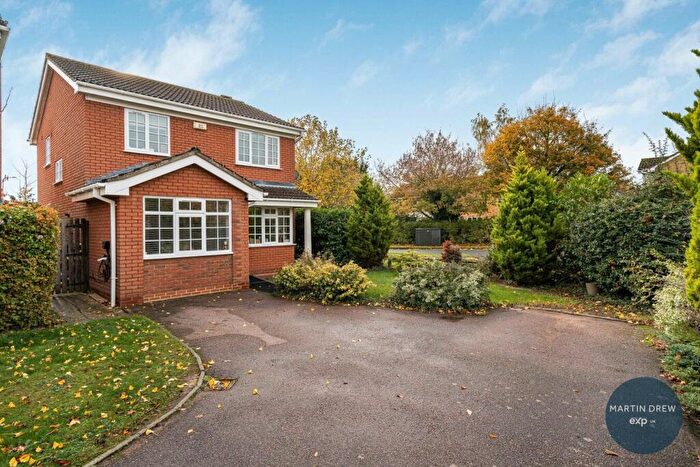
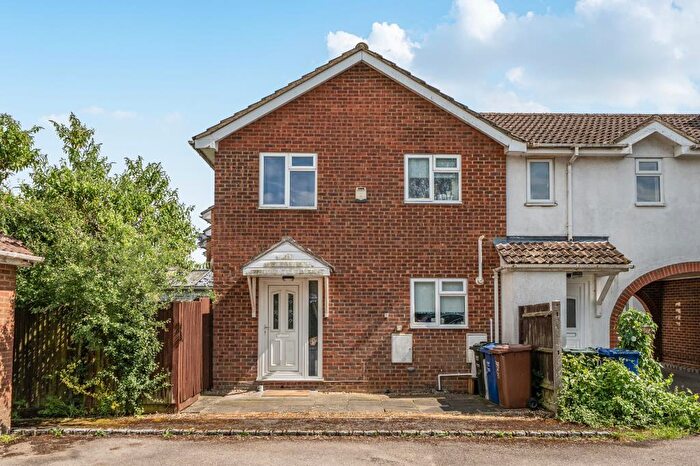
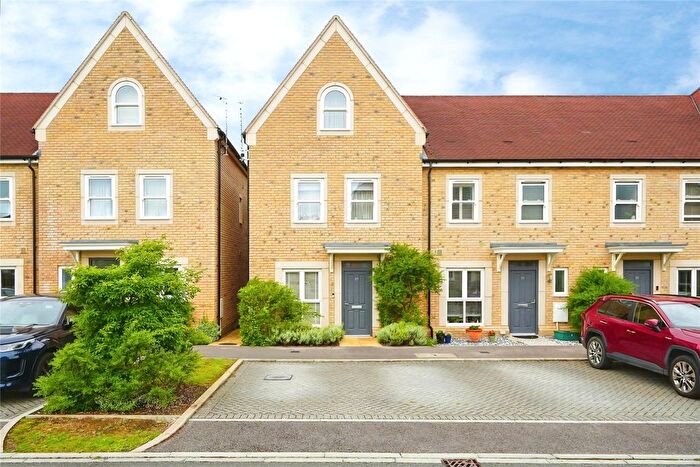
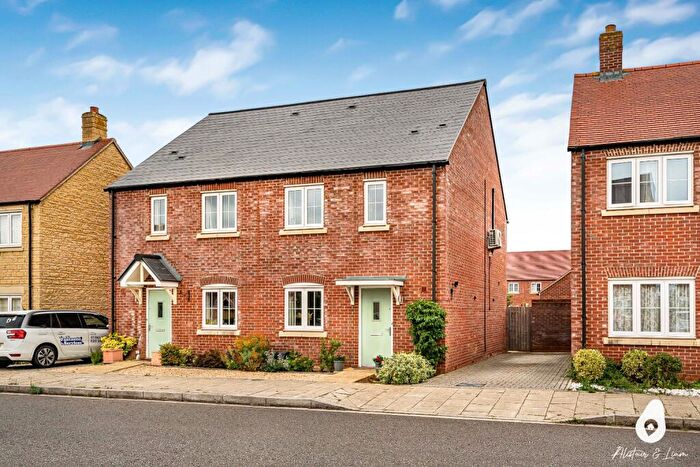
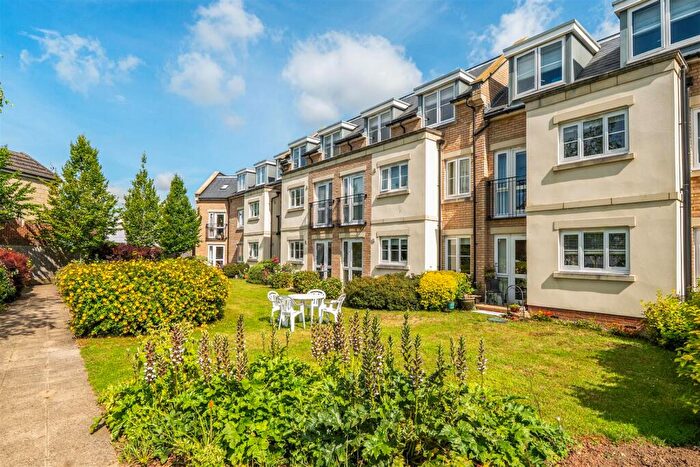
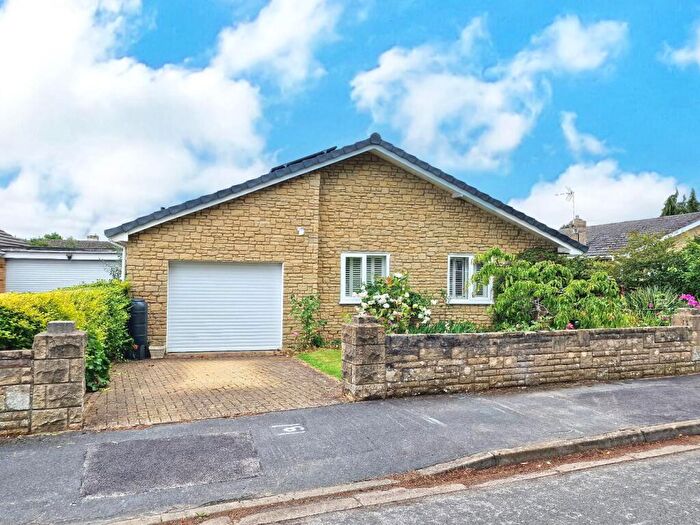
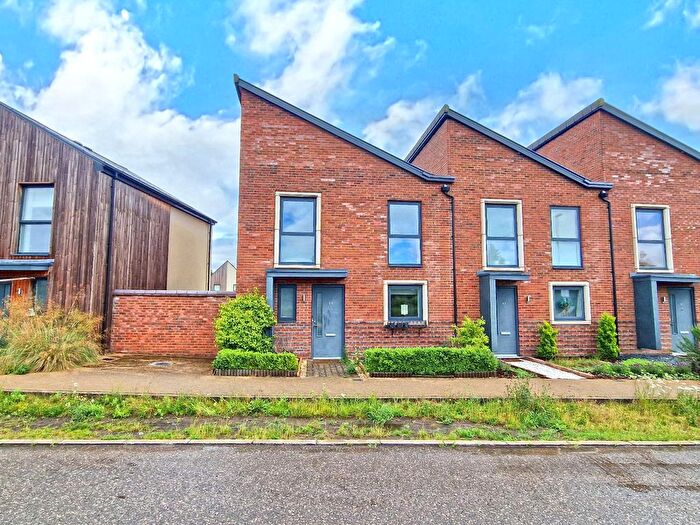
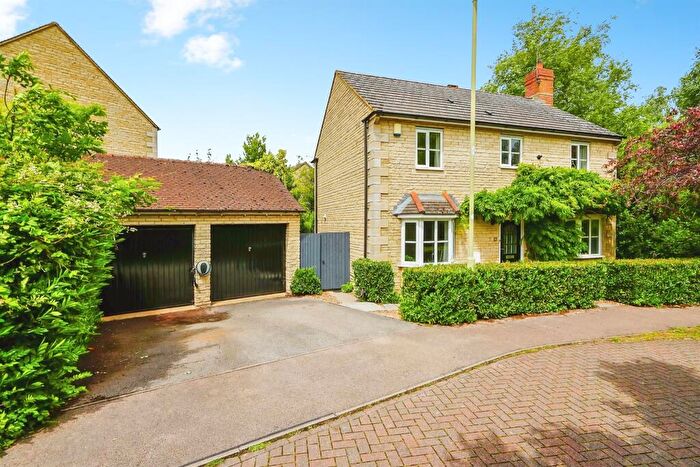
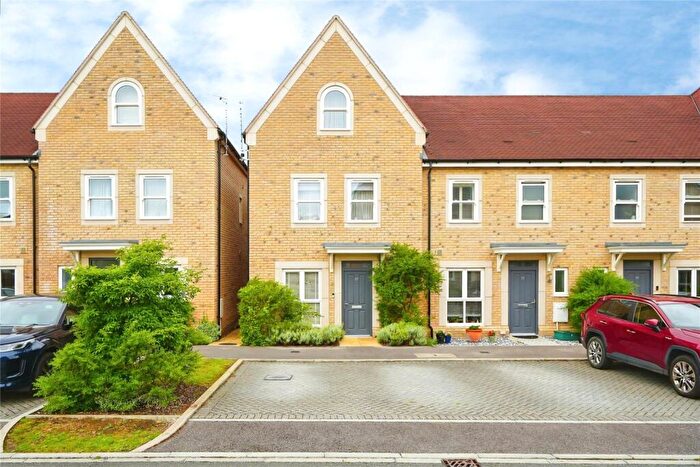
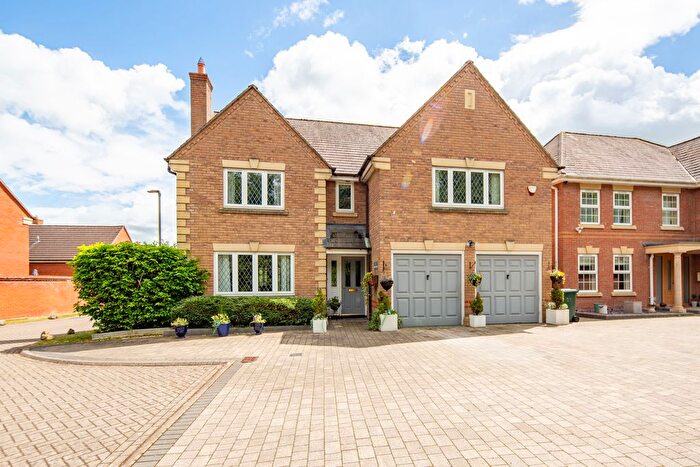
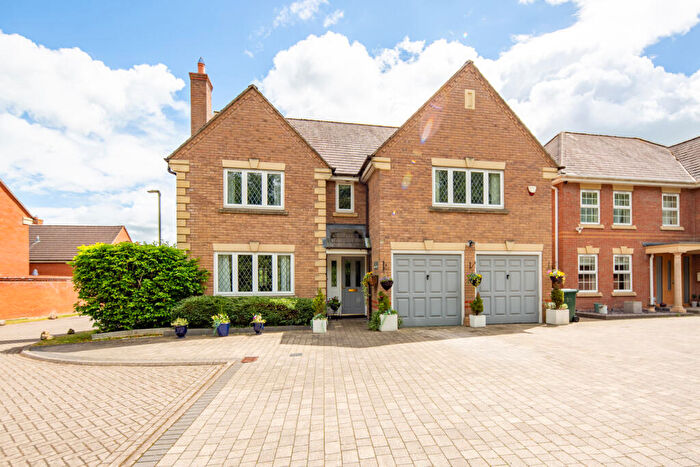
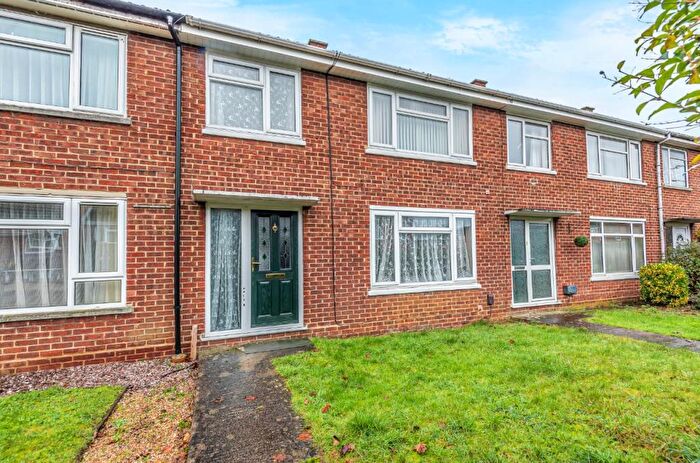
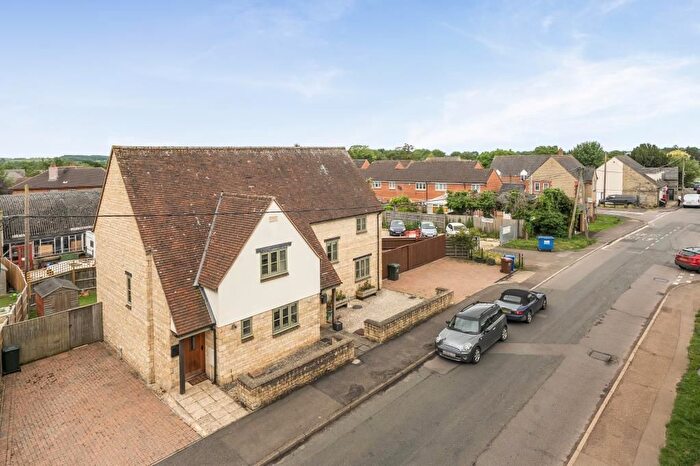
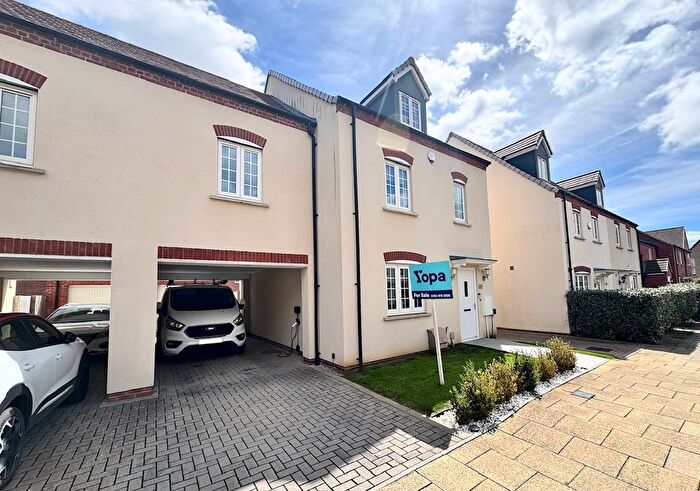
Properties for sale in Bicester
![]()
If you are looking to sell your house, let it out, or receive a property valuation, an expert can help you.
Click the button below to get started.
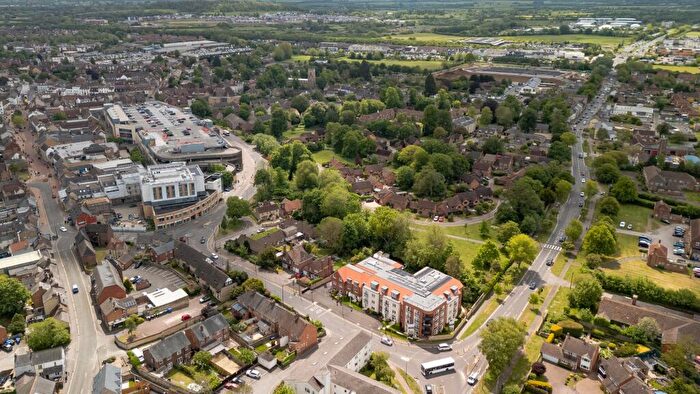
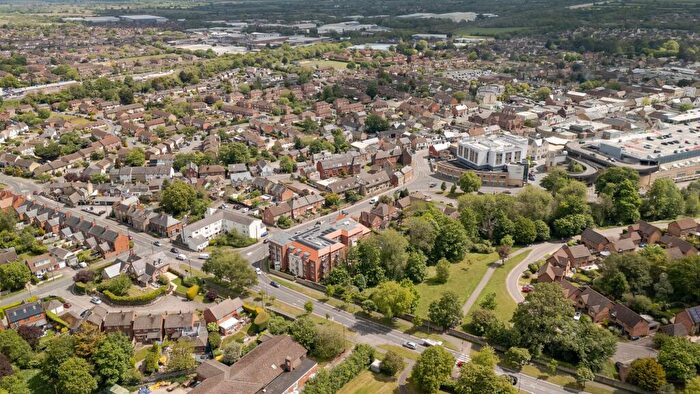
Neighbourhoods in Bicester
Navigate through our locations to find the location of your next house in Bicester, Oxfordshire for sale or to rent.
Property price trends in Bicester
According to the latest Land Registry data, the average home in Bicester sold for £386,627 in 2026. That figure comes from a substantial record of 35,197 sales logged over the past 31 years.
Prices have fallen back over the last three years. Compared with 2023, when the typical sale came in around £420,349, that's a fall of roughly 8%.
Looking back five years, average prices are up about 2.6% since 2021, a gain of around £9,860 in cash terms.
Zoom out to the past decade for the fuller picture. Back in 2016, homes here averaged £334,665, so the typical sold price has climbed about 15.5% since then, roughly 1.5% a year. Stretch the view to fifteen years and that annual pace edges up closer to 3.1%.
Frequently asked questions about Bicester
What is the average price for a property for sale in Bicester?
The average price for a property for sale in Bicester is £400,314. This amount is 16% lower than the average price in Oxfordshire. There are more than 10,000 property listings for sale in Bicester.
What locations have the most expensive properties for sale in Bicester?
The locations with the most expensive properties for sale in Bicester are Fringford and Heyfords at an average of £710,432, Kirtlington at an average of £611,760 and Fringford at an average of £597,358.
What locations have the most affordable properties for sale in Bicester?
The locations with the most affordable properties for sale in Bicester are Bicester Town at an average of £317,313, Bicester East at an average of £332,266 and Bicester South at an average of £348,008.
Which train stations are available in or near Bicester?
Some of the train stations available in or near Bicester are Bicester North, Bicester Village and Heyford.
Property Price Paid in Bicester by Year
The average sold property price by year was:
| Year | Average Sold Price | Price Change |
Sold Properties
|
|---|---|---|---|
| 2026 | £386,627 | -1% |
47 Properties |
| 2025 | £390,510 | -0,5% |
798 Properties |
| 2024 | £392,449 | -7% |
778 Properties |
| 2023 | £420,349 | 6% |
728 Properties |
| 2022 | £394,923 | 5% |
965 Properties |
| 2021 | £376,767 | 2% |
1,419 Properties |
| 2020 | £367,466 | 7% |
919 Properties |
| 2019 | £342,128 | -0,4% |
1,028 Properties |
| 2018 | £343,627 | 2% |
1,027 Properties |
| 2017 | £338,092 | 1% |
1,144 Properties |
Property Price per Property Type in Bicester
Here you can find historic sold price data in order to help with your property search.
The average Property Paid Price for specific property types in the last three years are:
| Property Type | Average Sold Price | Sold Properties |
|---|---|---|
| Semi Detached House | £416,461.00 | 629 Semi Detached Houses |
| Terraced House | £312,577.00 | 786 Terraced Houses |
| Detached House | £545,852.00 | 715 Detached Houses |
| Flat | £195,543.00 | 221 Flats |
Transport in Bicester
Please see below transportation links in this area:
