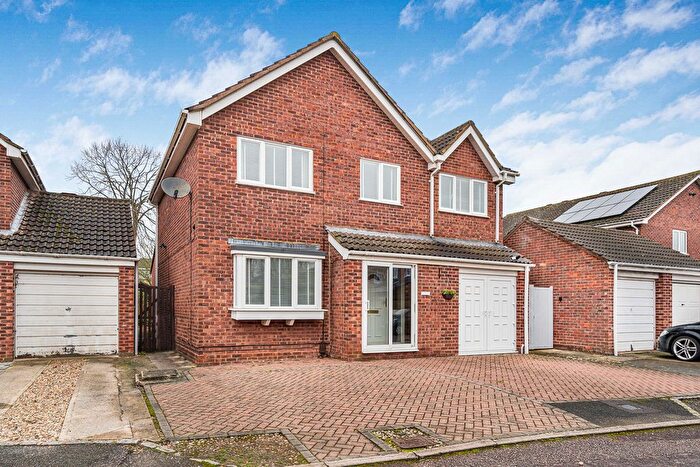
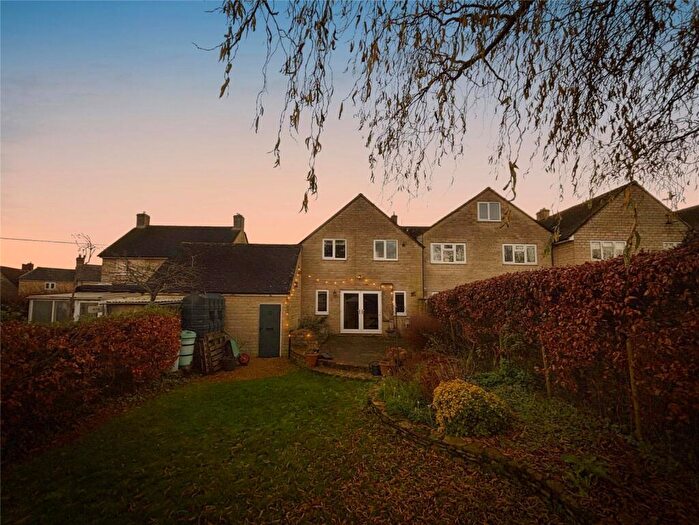
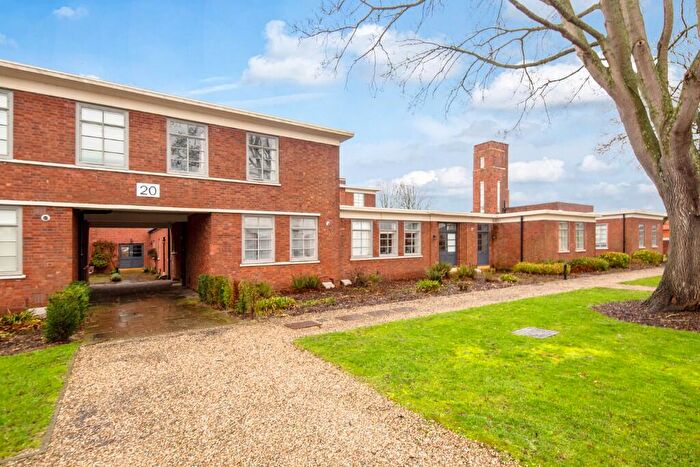
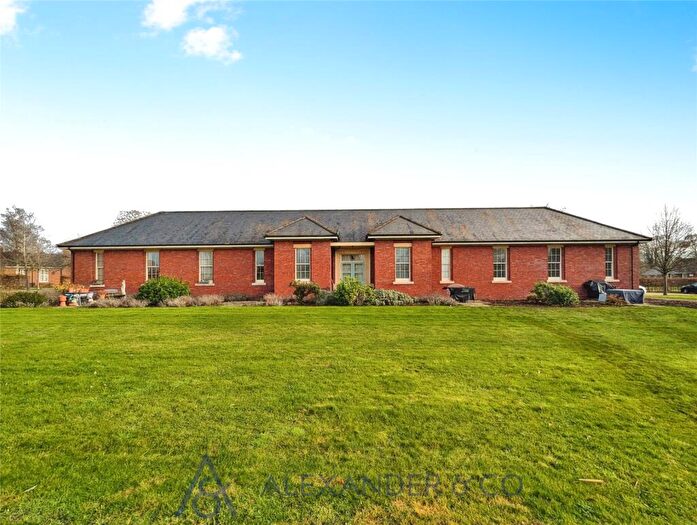
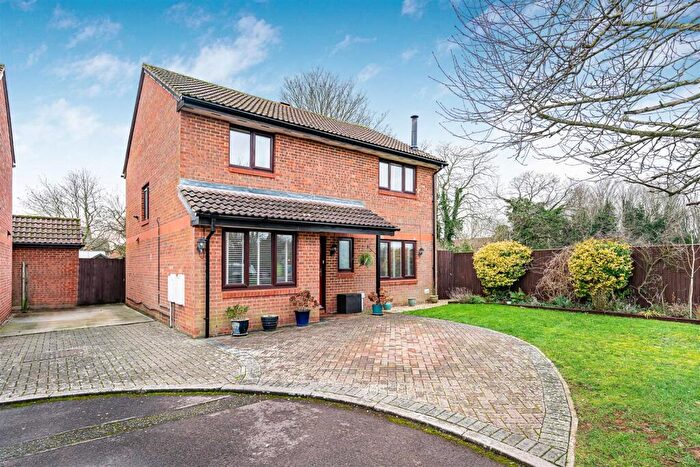
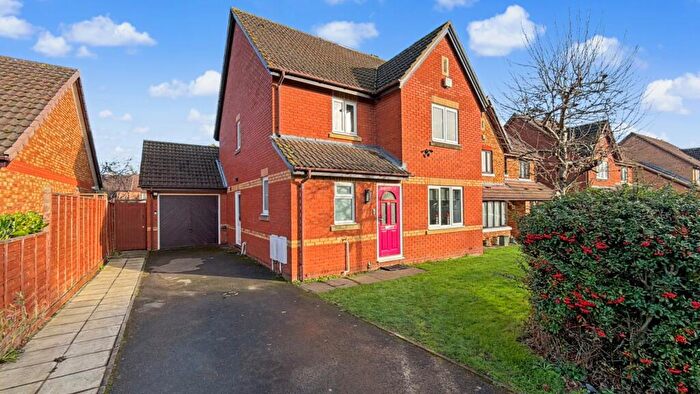
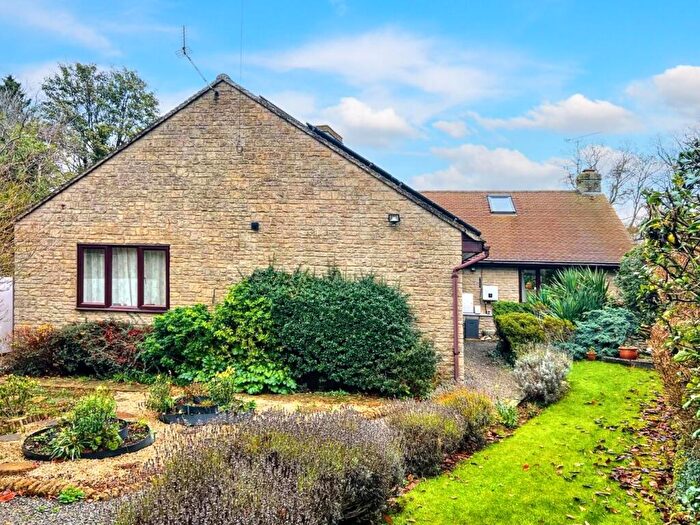
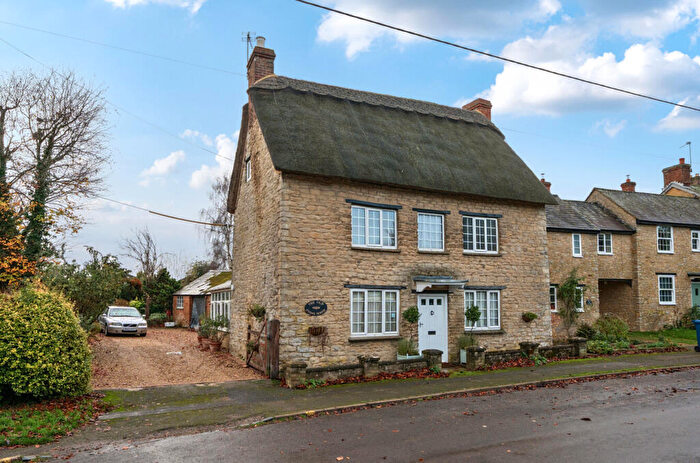
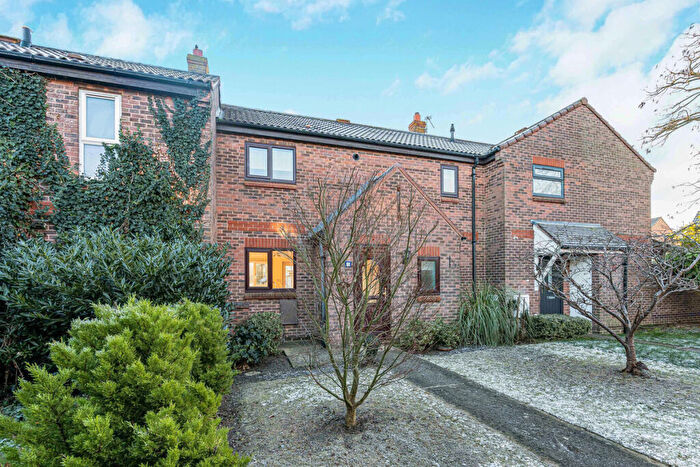
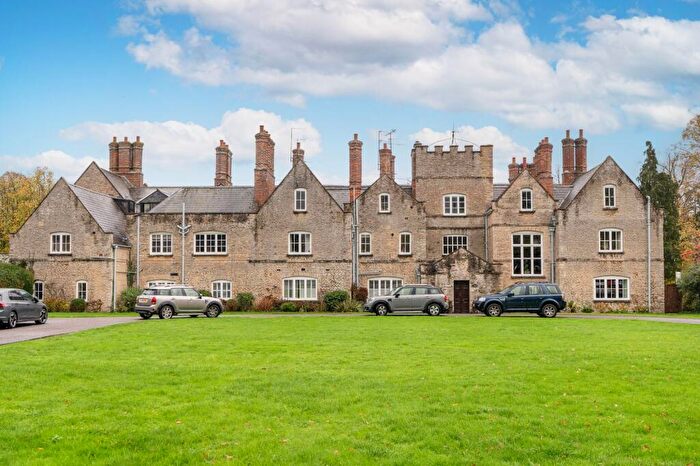
Houses for sale & to rent in Fringford, Bicester
House Prices in Fringford
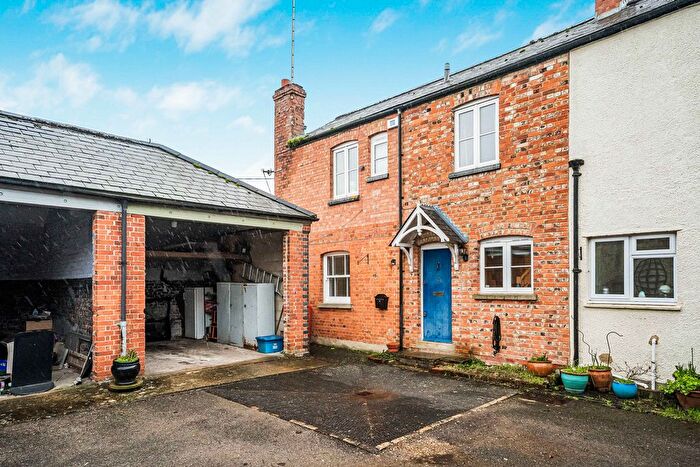
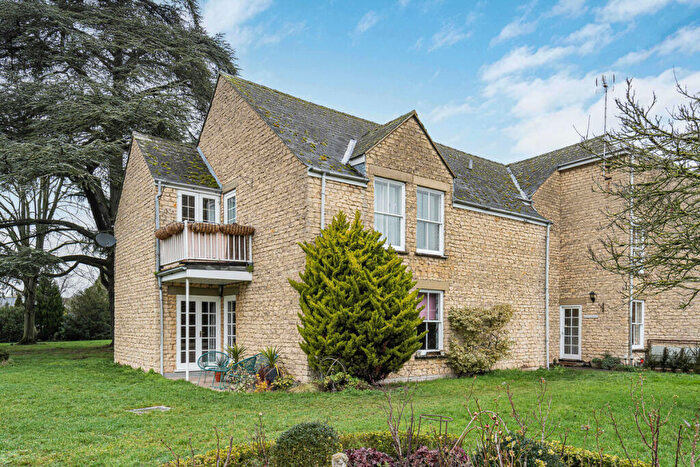
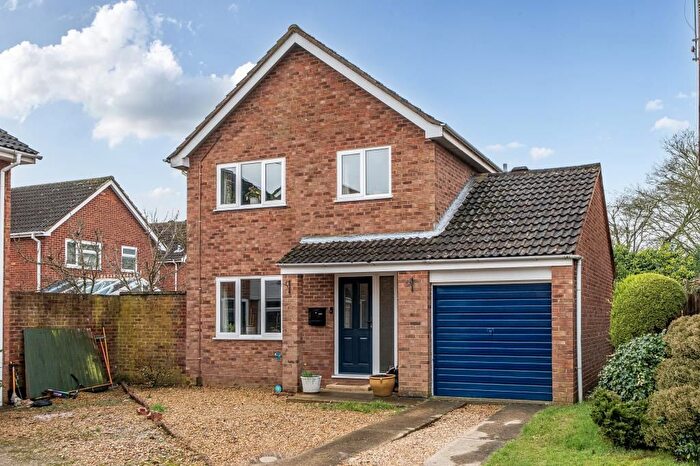
Properties in Fringford have an average house price of £587,081.00 and had 37 Property Transactions within the last 3 years¹.
Fringford is an area in Bicester, Oxfordshire with 536 households², where the most expensive property was sold for £2,050,000.00.
Properties for sale in Fringford
Roads and Postcodes in Fringford
Navigate through our locations to find the location of your next house in Fringford, Bicester for sale or to rent.
| Streets | Postcodes |
|---|---|
| Bainton Road | OX27 8HA |
| Bicester Road | OX27 9BP OX27 9BT |
| Cavendish Place | OX27 9BN |
| Cherry Close | OX27 9AP |
| Cherry Street | OX27 9AA |
| Church Close | OX27 8DR |
| Church Lane | OX27 8DJ OX27 8DL |
| Church Street | OX27 9AG OX27 9AQ |
| Copse Cottages | OX27 9AL |
| Crosslands | OX27 8DF |
| Farriers Close | OX27 8DD |
| Glebe Farm Cottage | OX27 8RJ |
| Glen Close | OX27 9BY |
| Hardwick Road | OX27 8EY OX27 8EZ |
| Launton Road | OX27 9AS OX27 9AX |
| Little Paddock | OX27 8EJ |
| Main Street | OX27 8DP OX27 8DZ OX27 8ES OX27 8ET OX27 8HD |
| Manor Mews | OX27 9BZ |
| Manor Road | OX27 8DH |
| Manor Yard | OX27 8DQ |
| Mill Road | OX27 9AR OX27 9BJ |
| Rectory Lane | OX27 8DT OX27 8DX |
| St Michaels Close | OX27 8DW |
| Stoke Lyne Road | OX27 9AT |
| Stratton Audley Road | OX27 8ED |
| The Green | OX27 8DS OX27 8DY OX27 8EU |
| The Laurels | OX27 8EW |
| The Limes | OX27 9DA |
| The Manor | OX27 8DG |
| The Terrace | OX27 8EX |
| Willows Lodge | OX27 9BQ |
| Wise Crescent | OX27 8EA |
| OX27 8AQ OX27 8EN OX27 8RG OX27 8RQ OX27 8SS OX27 9AF OX27 9AN OX27 9RF |
Transport near Fringford
-
Bicester North Station
-
Bicester Village Station
-
Heyford Station
-
King's Sutton Station
-
Tackley Station
-
Islip Station
- FAQ
- Price Paid By Year
- Property Type Price
Frequently asked questions about Fringford
What is the average price for a property for sale in Fringford?
The average price for a property for sale in Fringford is £587,081. This amount is 46% higher than the average price in Bicester. There are 581 property listings for sale in Fringford.
What streets have the most expensive properties for sale in Fringford?
The streets with the most expensive properties for sale in Fringford are Stoke Lyne Road at an average of £1,287,500, Manor Road at an average of £985,000 and Launton Road at an average of £868,333.
What streets have the most affordable properties for sale in Fringford?
The streets with the most affordable properties for sale in Fringford are The Limes at an average of £270,000, Mill Road at an average of £285,625 and Bainton Road at an average of £290,000.
Which train stations are available in or near Fringford?
Some of the train stations available in or near Fringford are Bicester North, Bicester Village and Heyford.
Property Price Paid in Fringford by Year
The average sold property price by year was:
| Year | Average Sold Price | Price Change |
Sold Properties
|
|---|---|---|---|
| 2025 | £551,277 | -24% |
9 Properties |
| 2024 | £682,764 | 31% |
17 Properties |
| 2023 | £468,500 | -45% |
11 Properties |
| 2022 | £678,735 | 41% |
13 Properties |
| 2021 | £400,948 | -52% |
33 Properties |
| 2020 | £610,555 | 24% |
9 Properties |
| 2019 | £465,538 | 9% |
13 Properties |
| 2018 | £425,881 | -11% |
19 Properties |
| 2017 | £474,575 | 7% |
24 Properties |
| 2016 | £441,885 | -9% |
13 Properties |
| 2015 | £481,618 | 8% |
25 Properties |
| 2014 | £440,910 | 24% |
23 Properties |
| 2013 | £336,300 | -16% |
15 Properties |
| 2012 | £388,763 | -13% |
19 Properties |
| 2011 | £439,350 | 12% |
15 Properties |
| 2010 | £386,583 | 22% |
12 Properties |
| 2009 | £301,650 | 7% |
15 Properties |
| 2008 | £281,190 | -37% |
11 Properties |
| 2007 | £385,136 | 11% |
29 Properties |
| 2006 | £344,137 | 1% |
25 Properties |
| 2005 | £340,695 | 9% |
30 Properties |
| 2004 | £311,483 | 12% |
30 Properties |
| 2003 | £275,275 | 11% |
27 Properties |
| 2002 | £244,194 | 22% |
40 Properties |
| 2001 | £190,597 | 17% |
26 Properties |
| 2000 | £158,459 | -23% |
26 Properties |
| 1999 | £195,144 | 7% |
26 Properties |
| 1998 | £181,767 | 30% |
26 Properties |
| 1997 | £127,168 | -7% |
22 Properties |
| 1996 | £135,934 | 5% |
30 Properties |
| 1995 | £128,760 | - |
23 Properties |
Property Price per Property Type in Fringford
Here you can find historic sold price data in order to help with your property search.
The average Property Paid Price for specific property types in the last three years are:
| Property Type | Average Sold Price | Sold Properties |
|---|---|---|
| Semi Detached House | £632,384.00 | 13 Semi Detached Houses |
| Detached House | £685,066.00 | 15 Detached Houses |
| Terraced House | £416,500.00 | 5 Terraced Houses |
| Flat | £285,625.00 | 4 Flats |

