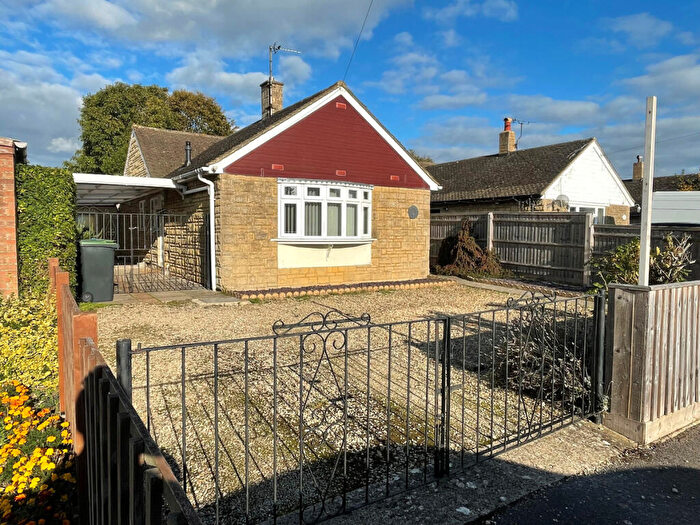
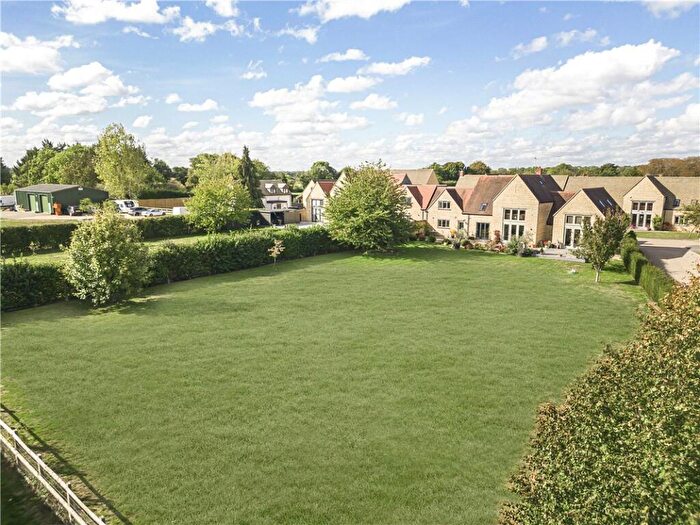
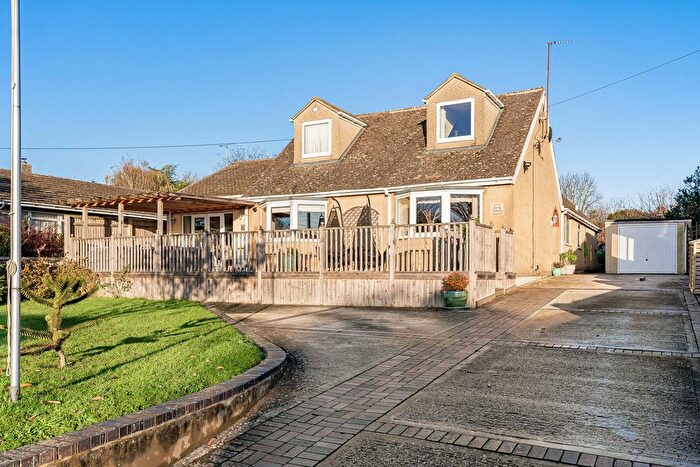
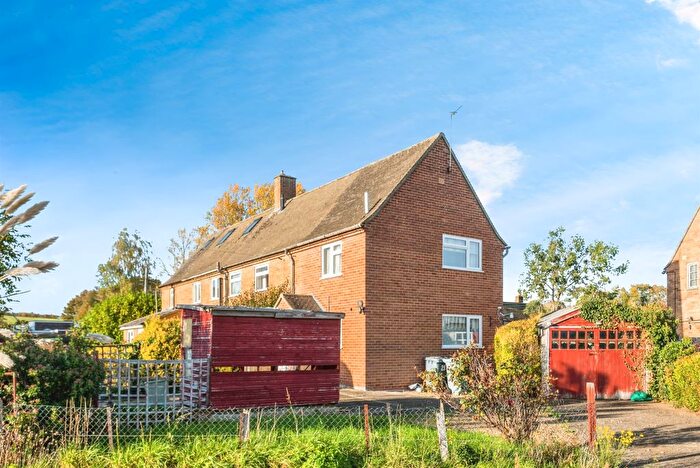
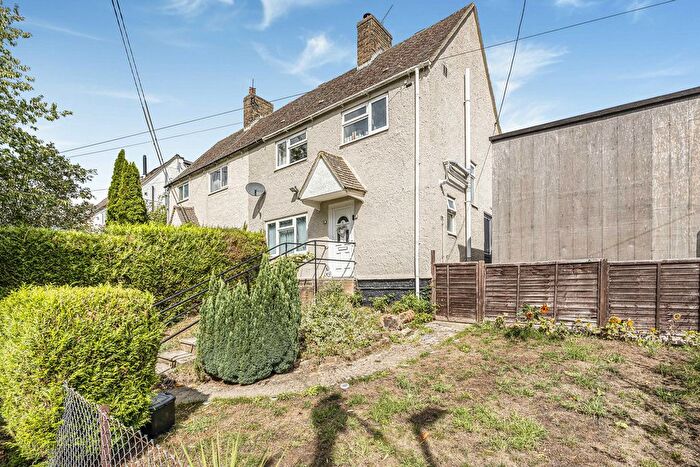
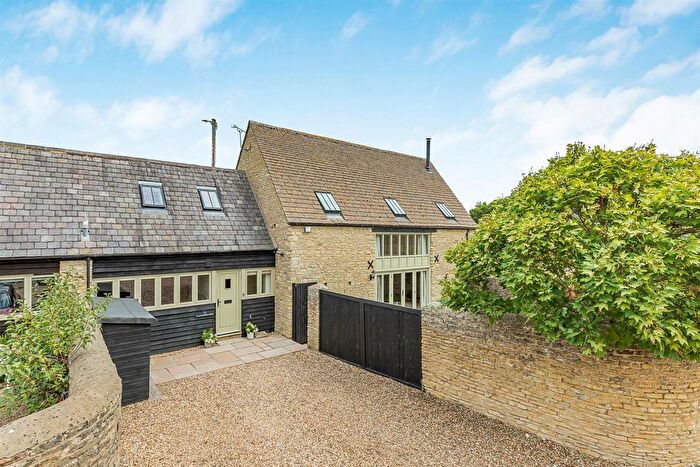
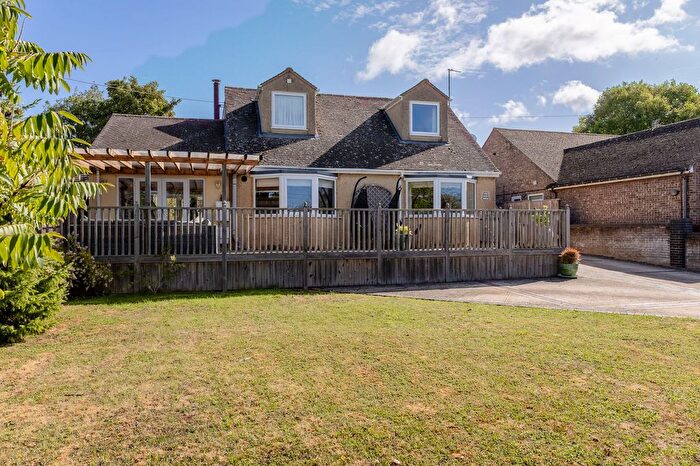
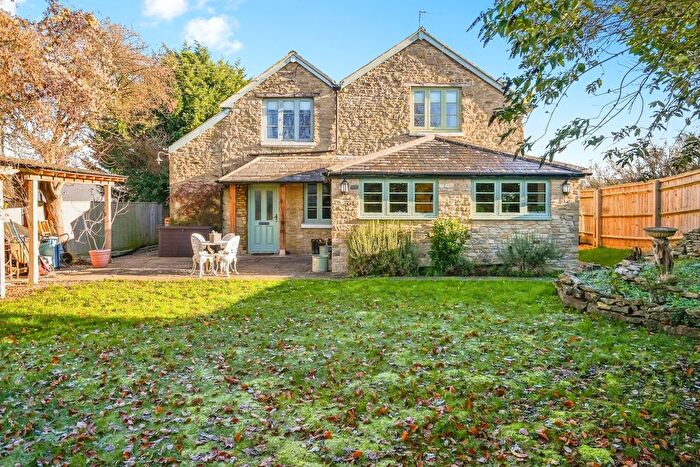
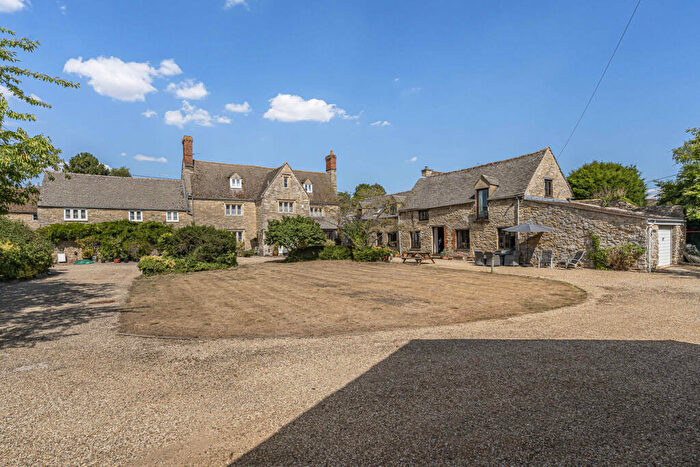
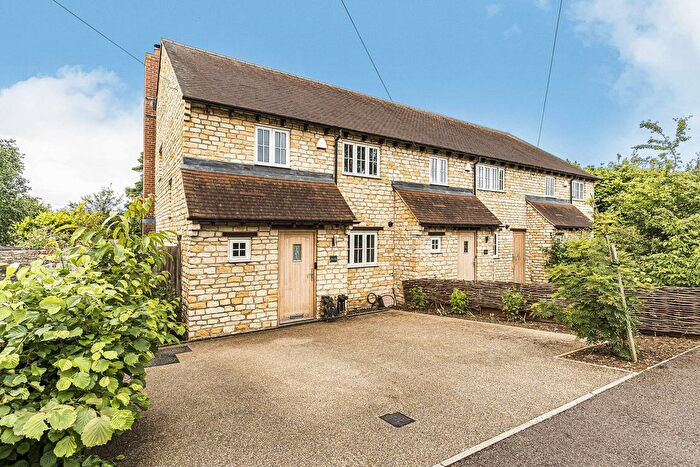
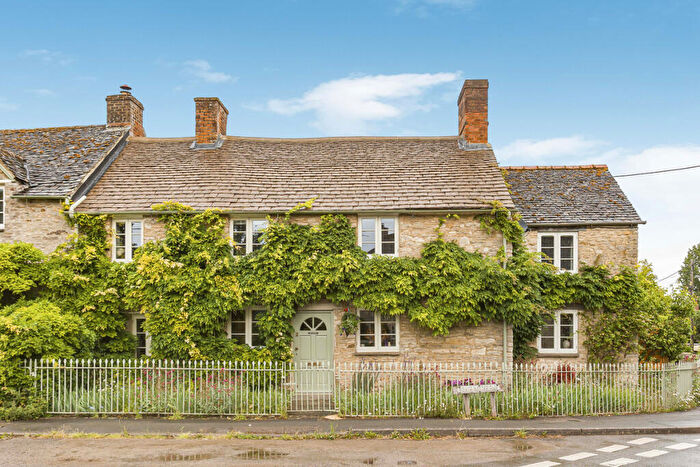
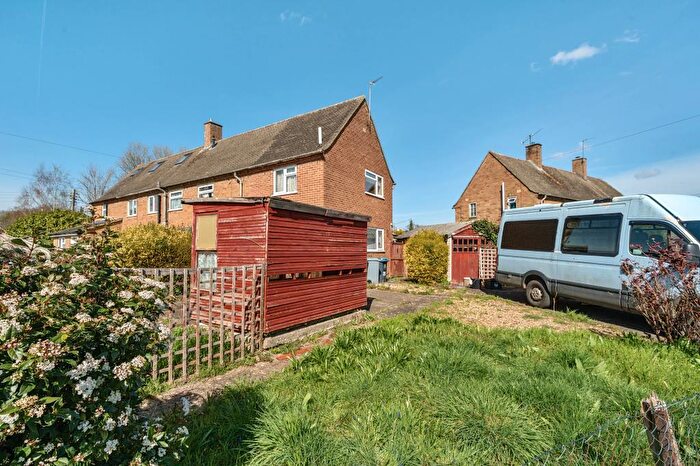
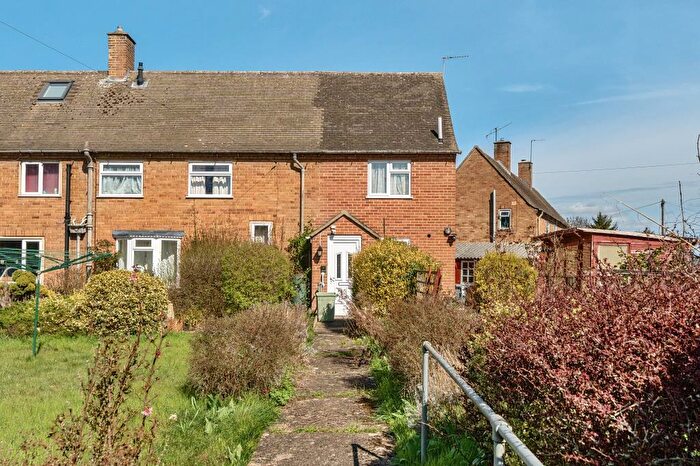
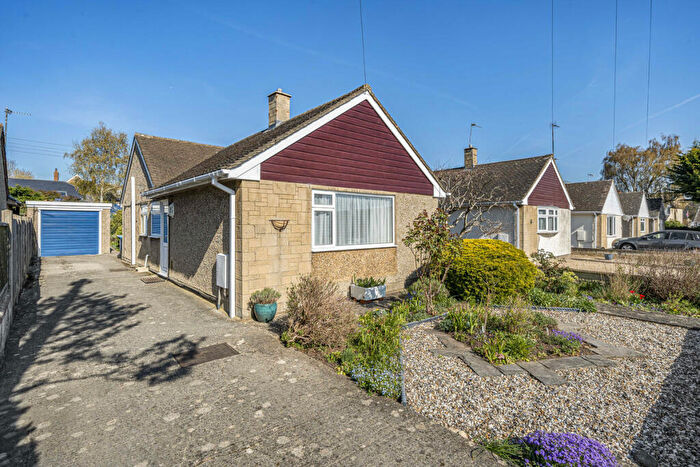
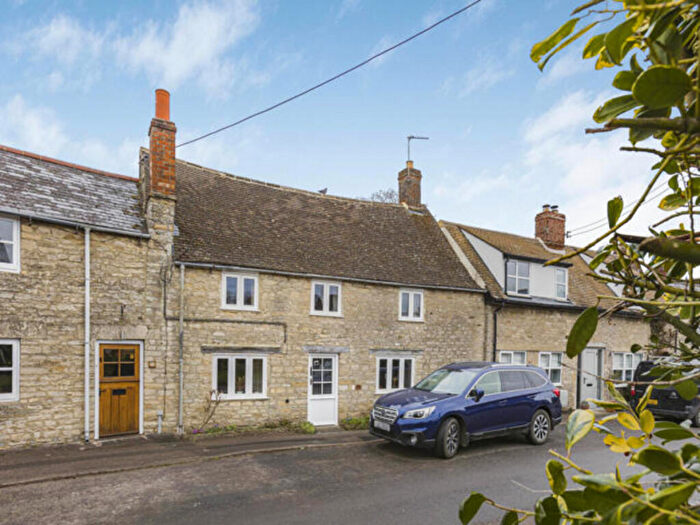
Houses for sale & to rent in Stonesfield And Tackley, Kidlington
House Prices in Stonesfield And Tackley
Properties in Stonesfield And Tackley have an average house price of £456,300.00 and had 25 Property Transactions within the last 3 years¹.
Stonesfield And Tackley is an area in Kidlington, Oxfordshire with 412 households², where the most expensive property was sold for £850,000.00.
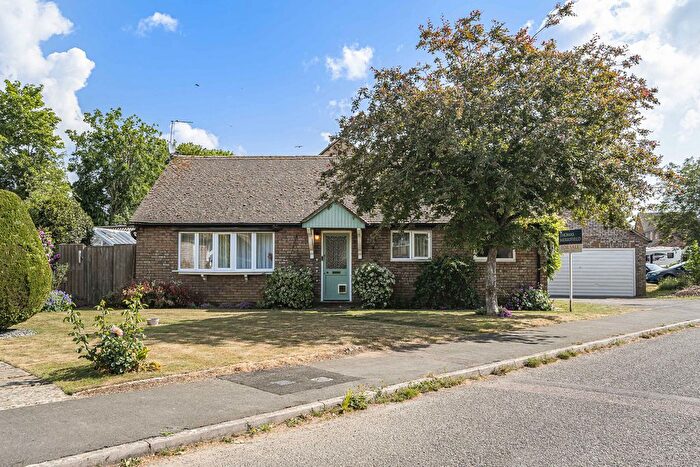
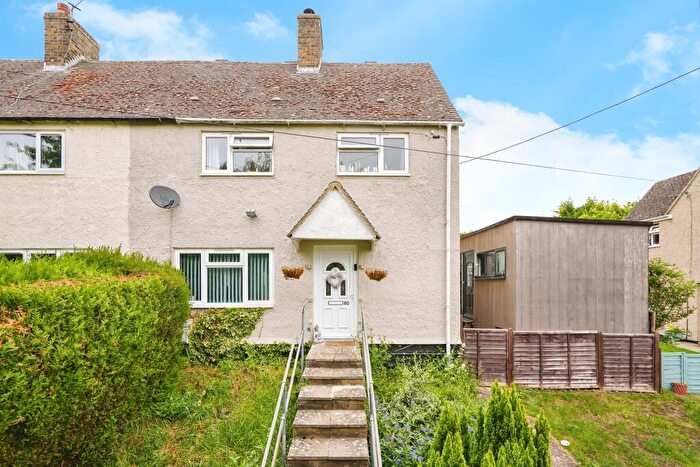
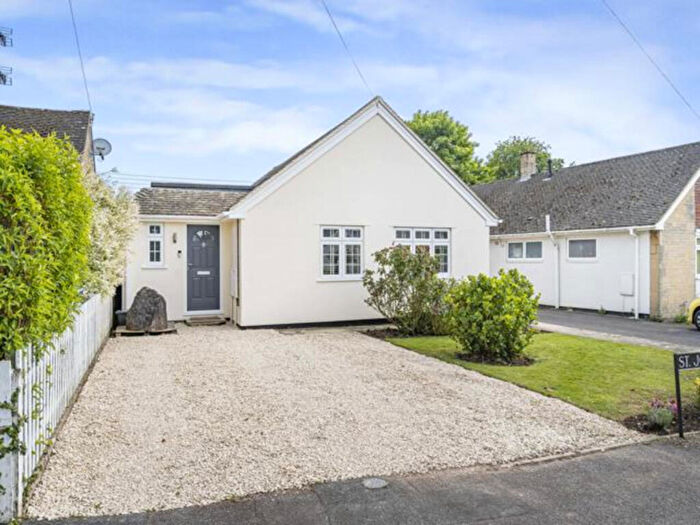
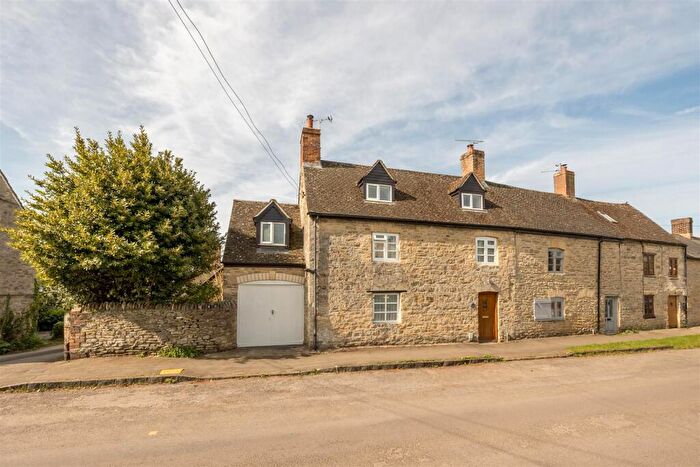
Properties for sale in Stonesfield And Tackley
Previously listed properties in Stonesfield And Tackley
Roads and Postcodes in Stonesfield And Tackley
Navigate through our locations to find the location of your next house in Stonesfield And Tackley, Kidlington for sale or to rent.
| Streets | Postcodes |
|---|---|
| Ashwell Bank Lane | OX5 3FH |
| Ball Lane | OX5 3AG |
| Balliol Close | OX5 3AS |
| Banbury Road | OX5 3EP OX5 3EW |
| Catsham Mill Close | OX5 3FN |
| Chaundy Road | OX5 3BJ OX5 3BN |
| Church Hill | OX5 3AE |
| Crecy View Place | OX5 3FJ |
| Dibdare Furlong | OX5 3FL |
| Follet Close | OX5 3AD |
| Fox Hill | OX5 3EN |
| Gibraltar Hill | OX5 3AZ |
| Harborne Road | OX5 3BL |
| Letchmere Close | OX5 3FP |
| Lime Kiln Road | OX5 3BW |
| Lower Hades Road | OX5 3BE |
| Lower Whitehill | OX5 3AA |
| Medcroft Road | OX5 3AH OX5 3AL OX5 3AQ OX5 3BD |
| Nethercote Road | OX5 3AT OX5 3AW |
| Old Whitehill | OX5 3AB OX5 3AU |
| Roman Place | OX5 3FR |
| Rousham Road | OX5 3AJ OX5 3AN OX5 3BB |
| St Johns Road | OX5 3AP OX5 3AR |
| St Nicholas Road | OX5 3BH |
| Tackley Road | OX25 4RD |
| The Green | OX5 3AF |
| The Ridge | OX5 3EJ |
| Twynhams Road | OX5 3BG |
| OX25 4QT OX25 4QU OX25 4QX OX25 4QY OX25 4QZ OX25 4RA OX25 4RB OX5 3ER |
Transport near Stonesfield And Tackley
-
Tackley Station
-
Heyford Station
-
Hanborough Station
-
Islip Station
-
Combe Station
-
Oxford Parkway Station
-
Bicester Village Station
-
Bicester North Station
-
Finstock Station
-
Charlbury Station
- FAQ
- Price Paid By Year
- Property Type Price
Frequently asked questions about Stonesfield And Tackley
What is the average price for a property for sale in Stonesfield And Tackley?
The average price for a property for sale in Stonesfield And Tackley is £456,300. This amount is 5% higher than the average price in Kidlington. There are 88 property listings for sale in Stonesfield And Tackley.
What streets have the most expensive properties for sale in Stonesfield And Tackley?
The streets with the most expensive properties for sale in Stonesfield And Tackley are Medcroft Road at an average of £695,000, Balliol Close at an average of £627,500 and Ashwell Bank Lane at an average of £610,000.
What streets have the most affordable properties for sale in Stonesfield And Tackley?
The streets with the most affordable properties for sale in Stonesfield And Tackley are The Ridge at an average of £243,750, St Johns Road at an average of £402,700 and Nethercote Road at an average of £439,375.
Which train stations are available in or near Stonesfield And Tackley?
Some of the train stations available in or near Stonesfield And Tackley are Tackley, Heyford and Hanborough.
Property Price Paid in Stonesfield And Tackley by Year
The average sold property price by year was:
| Year | Average Sold Price | Price Change |
Sold Properties
|
|---|---|---|---|
| 2025 | £498,527 | 19% |
9 Properties |
| 2024 | £405,821 | -12% |
7 Properties |
| 2023 | £453,333 | -17% |
9 Properties |
| 2022 | £528,480 | 12% |
13 Properties |
| 2021 | £463,399 | -7% |
35 Properties |
| 2020 | £495,401 | 6% |
31 Properties |
| 2019 | £467,132 | 19% |
21 Properties |
| 2018 | £376,714 | -18% |
14 Properties |
| 2017 | £443,837 | -7% |
8 Properties |
| 2016 | £474,375 | -18% |
8 Properties |
| 2015 | £559,750 | 44% |
9 Properties |
| 2014 | £313,272 | -5% |
11 Properties |
| 2013 | £328,825 | -12% |
10 Properties |
| 2012 | £369,357 | 33% |
7 Properties |
| 2011 | £247,200 | -91% |
10 Properties |
| 2010 | £473,362 | 47% |
8 Properties |
| 2009 | £250,181 | -35% |
11 Properties |
| 2008 | £336,944 | 10% |
9 Properties |
| 2007 | £303,979 | 16% |
15 Properties |
| 2006 | £255,500 | -1% |
14 Properties |
| 2005 | £258,088 | -30% |
13 Properties |
| 2004 | £334,904 | 19% |
11 Properties |
| 2003 | £269,800 | 15% |
5 Properties |
| 2002 | £230,183 | 10% |
9 Properties |
| 2001 | £206,935 | -197% |
25 Properties |
| 2000 | £614,400 | 70% |
10 Properties |
| 1999 | £184,555 | 11% |
18 Properties |
| 1998 | £164,781 | 37% |
16 Properties |
| 1997 | £103,480 | 8% |
11 Properties |
| 1996 | £95,385 | 3% |
14 Properties |
| 1995 | £92,478 | - |
12 Properties |
Property Price per Property Type in Stonesfield And Tackley
Here you can find historic sold price data in order to help with your property search.
The average Property Paid Price for specific property types in the last three years are:
| Property Type | Average Sold Price | Sold Properties |
|---|---|---|
| Semi Detached House | £384,666.00 | 6 Semi Detached Houses |
| Detached House | £519,192.00 | 13 Detached Houses |
| Terraced House | £391,666.00 | 6 Terraced Houses |

