Houses for sale & to rent in Kirtlington, Kidlington
House Prices in Kirtlington
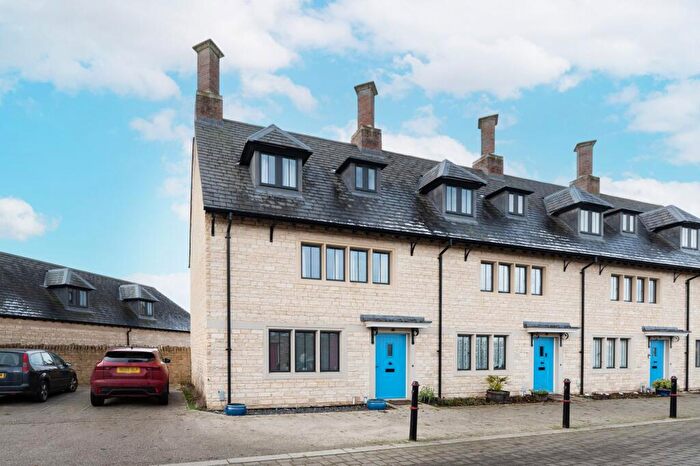
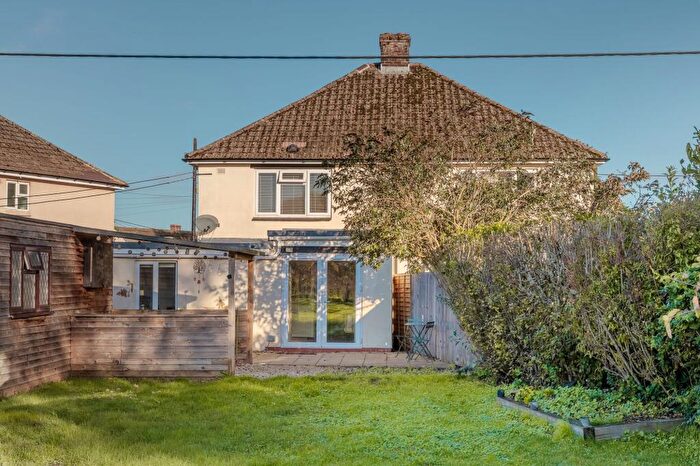
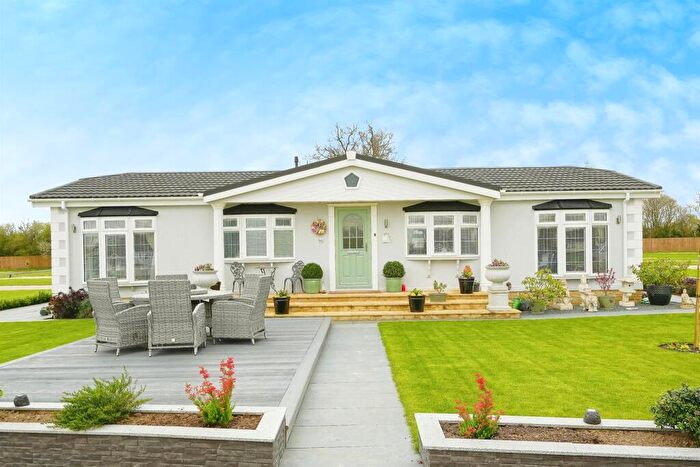
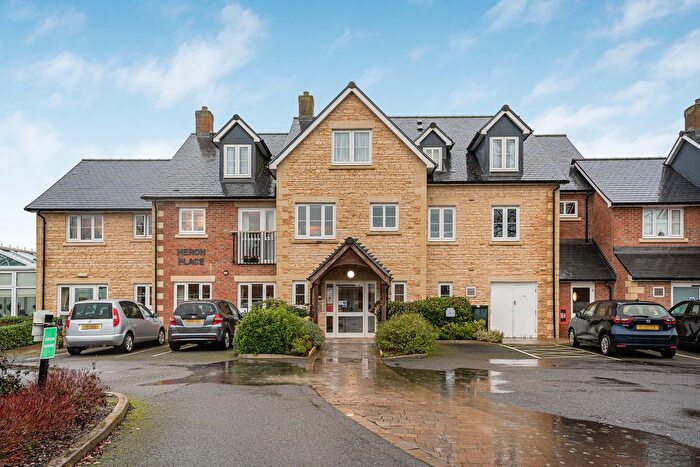
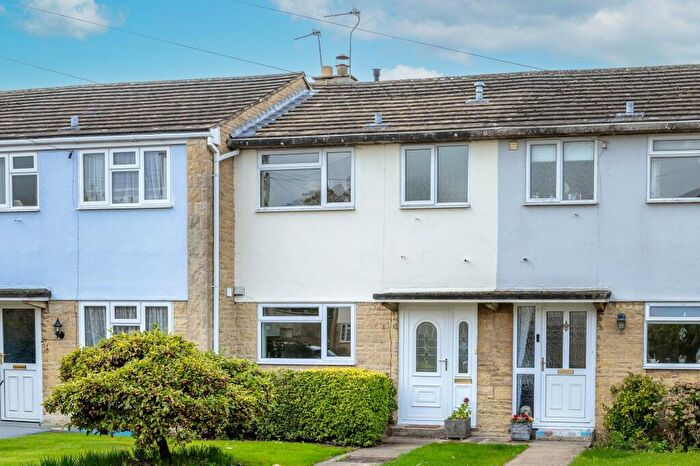
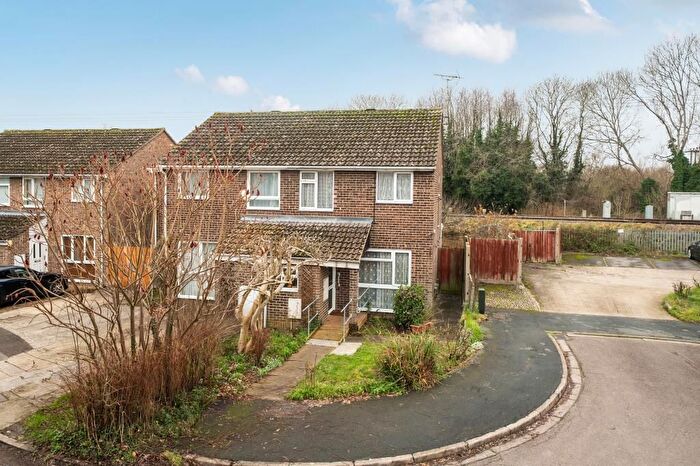
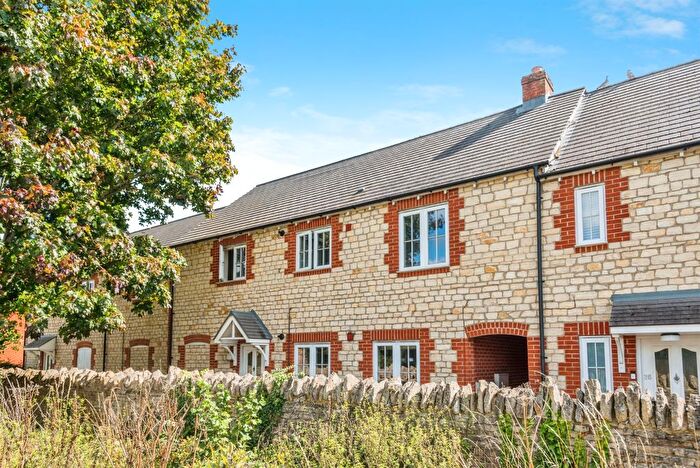
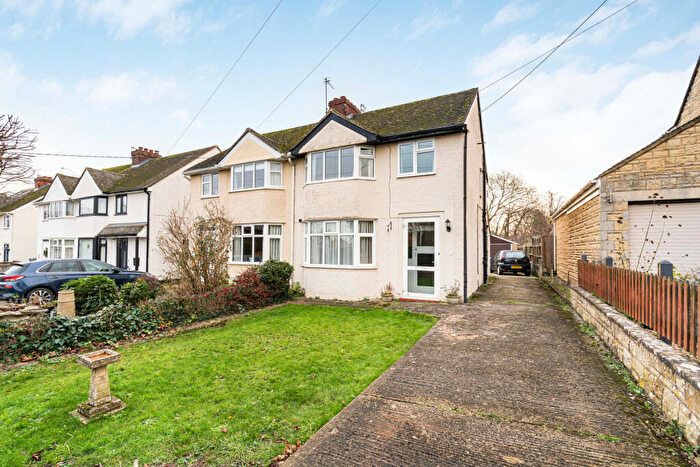
Properties in Kirtlington have an average house price of £592,479.00 and had 62 Property Transactions within the last 3 years¹.
Kirtlington is an area in Kidlington, Oxfordshire with 865 households², where the most expensive property was sold for £1,740,000.00.
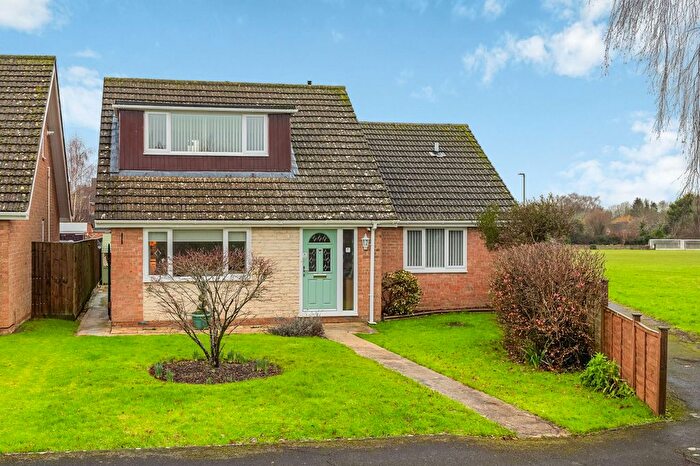
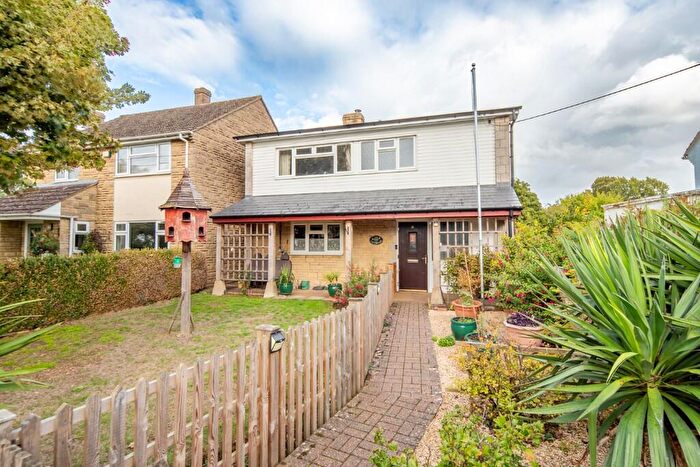
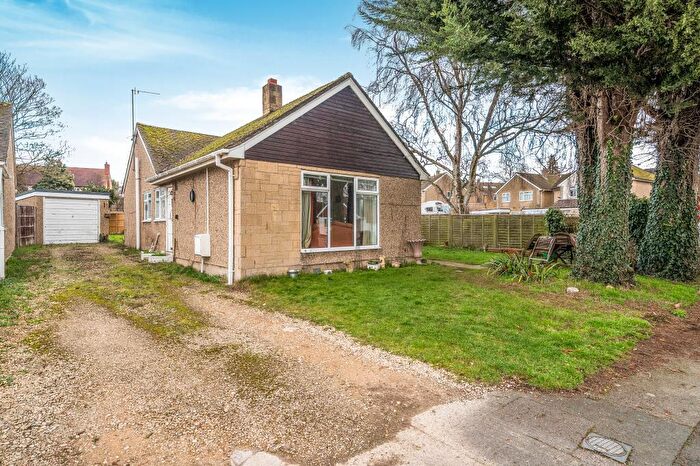
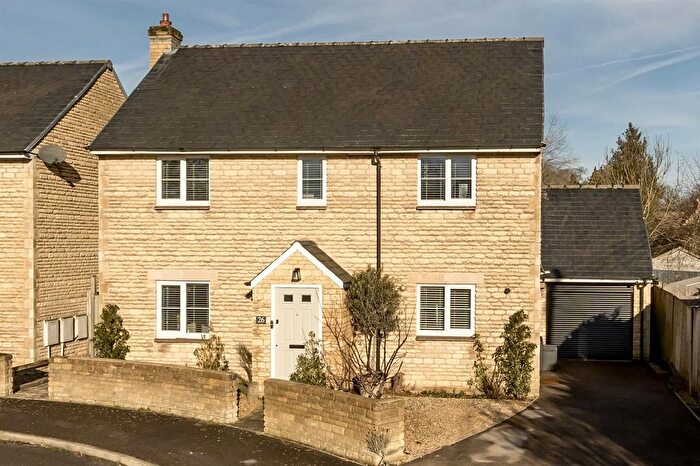
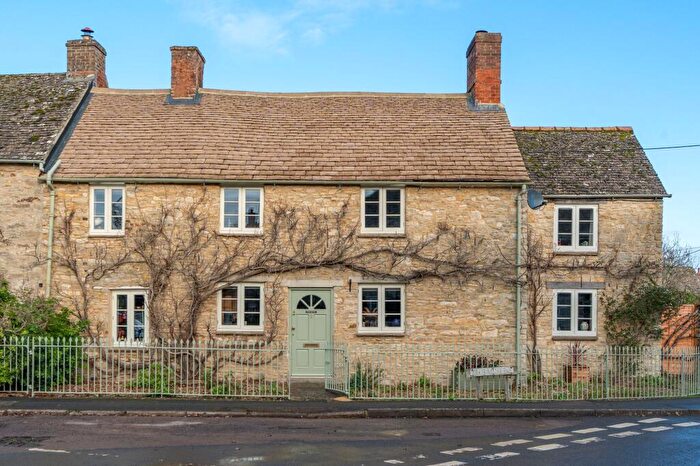
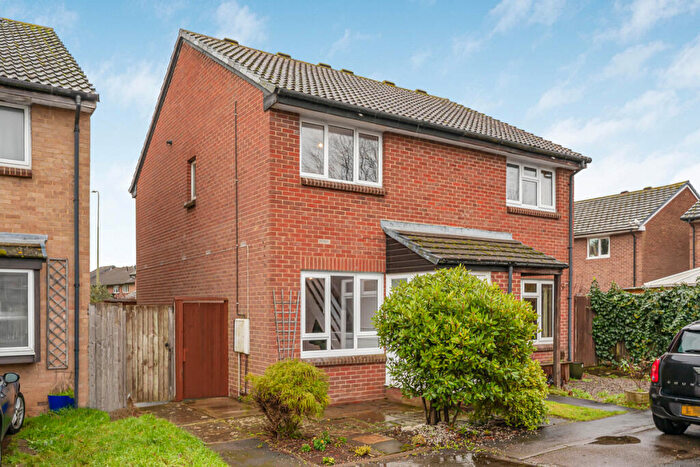
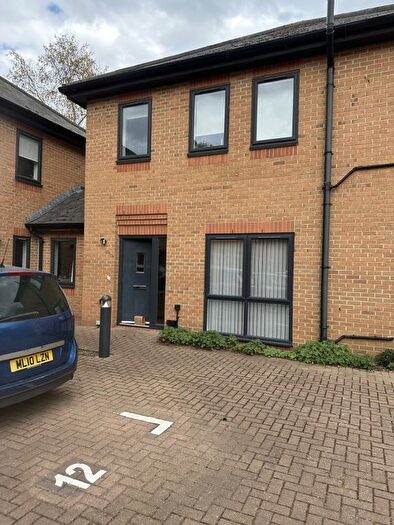
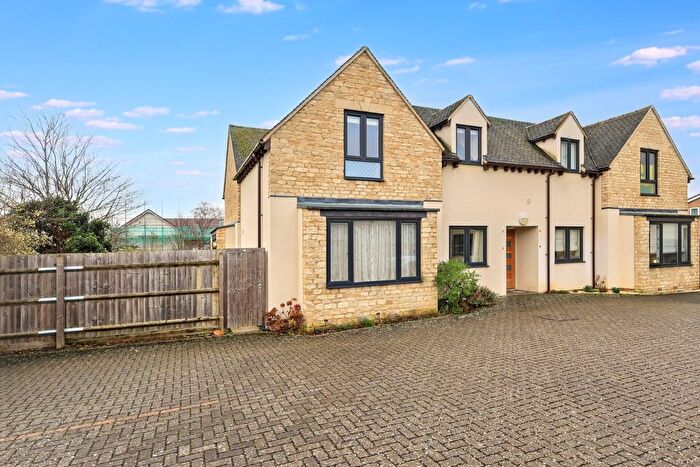
Properties for sale in Kirtlington
Roads and Postcodes in Kirtlington
Navigate through our locations to find the location of your next house in Kirtlington, Kidlington for sale or to rent.
| Streets | Postcodes |
|---|---|
| Akeman Close | OX5 3HX |
| Annesley Close | OX5 3DG |
| Banbury Road | OX5 1JU |
| Birchwood Drive | OX5 1NR |
| Blenheim Terrace | OX5 3DQ |
| Bletchingdon Road | OX5 2QG OX5 3HF OX5 3HG |
| Bunkers Hill | OX5 3BA |
| Canal Road | OX5 1JQ OX5 1LD |
| Canal Yard | OX5 1JZ |
| Chapel Cottage | OX5 1JX |
| Church End | OX5 3DJ OX5 3DL OX5 3DN |
| Church Lane | OX5 2QF |
| Coghill | OX5 3BY |
| Crowcastle Lane | OX5 3HP |
| Dashwood Mews | OX5 3JX |
| Foxtowns Green | OX5 3JW |
| Foxtownsend Cottages | OX5 3HT |
| Gossway Fields | OX5 3HQ |
| Hatch Close | OX5 3JT |
| Hatch End | OX5 3JU OX5 3NH |
| Hatch Way | OX5 3JS |
| Heathfield | OX5 3DU OX5 3DX |
| Heyford Road | OX5 3HL OX5 3HS OX5 3HU |
| Home Farm Cottages | OX5 3DD |
| Ingleby Paddocks | OX5 3ET |
| Islip Road | OX5 3DP |
| Jerome Way | OX5 1JT |
| Kirtlington Park | OX5 3JN |
| Kytes Place | OX5 3HN |
| Lenthal | OX5 3EB |
| Manor Farm Cottage | OX5 2QH |
| Mill Lane | OX5 3HW |
| North Green | OX5 3JZ |
| Oxford Close | OX5 3HH |
| Oxford Road | OX5 2QA OX5 2QD OX5 2QE OX5 3BS OX5 3BU OX5 3HB OX5 3HD |
| Park Close | OX5 3HR |
| Pound Close | OX5 3JR |
| Railway Cottage | OX5 1JP |
| Roman Close | OX5 3EX |
| Sands Close | OX5 3NA |
| Shipton Bottom | OX5 1JJ |
| South Green | OX5 3HJ |
| Springwell Close | OX5 3ES |
| St Giles | OX5 3BX |
| Station Road | OX5 3AX OX5 3BQ OX5 3DB OX5 3DE OX5 3HE |
| The Chestnuts | OX5 3UB |
| The Green | OX5 3DA |
| Troy Lane | OX5 3HA |
| Valentia Close | OX5 3DF |
| Weston Road | OX5 3DH |
| OX5 1JL OX5 1JN OX5 1JW OX5 1JY OX5 3JY |
Transport near Kirtlington
- FAQ
- Price Paid By Year
- Property Type Price
Frequently asked questions about Kirtlington
What is the average price for a property for sale in Kirtlington?
The average price for a property for sale in Kirtlington is £592,479. This amount is 36% higher than the average price in Kidlington. There are 1,383 property listings for sale in Kirtlington.
What streets have the most expensive properties for sale in Kirtlington?
The streets with the most expensive properties for sale in Kirtlington are Crowcastle Lane at an average of £1,725,000, Foxtowns Green at an average of £1,200,000 and North Green at an average of £857,500.
What streets have the most affordable properties for sale in Kirtlington?
The streets with the most affordable properties for sale in Kirtlington are Coghill at an average of £319,987, St Giles at an average of £325,000 and Valentia Close at an average of £332,666.
Which train stations are available in or near Kirtlington?
Some of the train stations available in or near Kirtlington are Tackley, Islip and Oxford Parkway.
Property Price Paid in Kirtlington by Year
The average sold property price by year was:
| Year | Average Sold Price | Price Change |
Sold Properties
|
|---|---|---|---|
| 2025 | £639,090 | 10% |
16 Properties |
| 2024 | £577,976 | 1% |
21 Properties |
| 2023 | £574,830 | 18% |
25 Properties |
| 2022 | £470,027 | -9% |
16 Properties |
| 2021 | £512,255 | 15% |
43 Properties |
| 2020 | £432,942 | -22% |
26 Properties |
| 2019 | £530,283 | -21% |
30 Properties |
| 2018 | £644,090 | 28% |
22 Properties |
| 2017 | £462,693 | -21% |
40 Properties |
| 2016 | £561,621 | 25% |
32 Properties |
| 2015 | £423,020 | -22% |
25 Properties |
| 2014 | £517,542 | 19% |
37 Properties |
| 2013 | £420,968 | -9% |
33 Properties |
| 2012 | £459,158 | -9% |
30 Properties |
| 2011 | £502,383 | 21% |
32 Properties |
| 2010 | £397,163 | 24% |
27 Properties |
| 2009 | £303,117 | -13% |
34 Properties |
| 2008 | £341,199 | 1% |
29 Properties |
| 2007 | £337,610 | 2% |
40 Properties |
| 2006 | £331,893 | 19% |
39 Properties |
| 2005 | £269,148 | -5% |
30 Properties |
| 2004 | £282,769 | 6% |
34 Properties |
| 2003 | £267,048 | 12% |
40 Properties |
| 2002 | £234,864 | 8% |
45 Properties |
| 2001 | £214,999 | 23% |
56 Properties |
| 2000 | £165,146 | 7% |
26 Properties |
| 1999 | £153,506 | 18% |
34 Properties |
| 1998 | £125,500 | -24% |
27 Properties |
| 1997 | £155,916 | 24% |
31 Properties |
| 1996 | £118,082 | -62% |
42 Properties |
| 1995 | £191,606 | - |
29 Properties |
Property Price per Property Type in Kirtlington
Here you can find historic sold price data in order to help with your property search.
The average Property Paid Price for specific property types in the last three years are:
| Property Type | Average Sold Price | Sold Properties |
|---|---|---|
| Semi Detached House | £457,514.00 | 17 Semi Detached Houses |
| Detached House | £710,322.00 | 34 Detached Houses |
| Terraced House | £364,750.00 | 8 Terraced Houses |
| Flat | £629,000.00 | 3 Flats |

