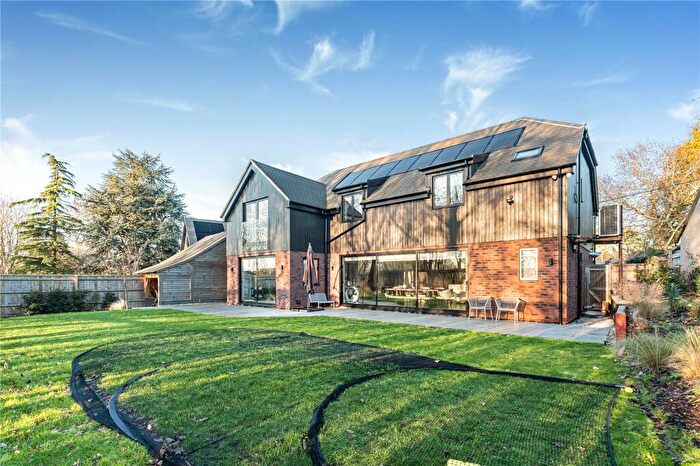
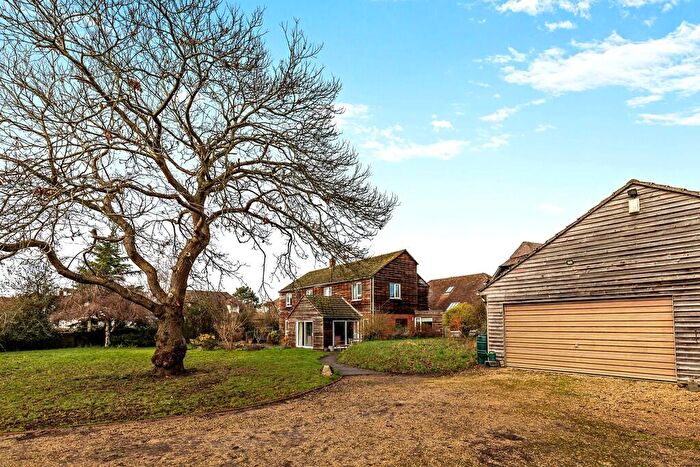
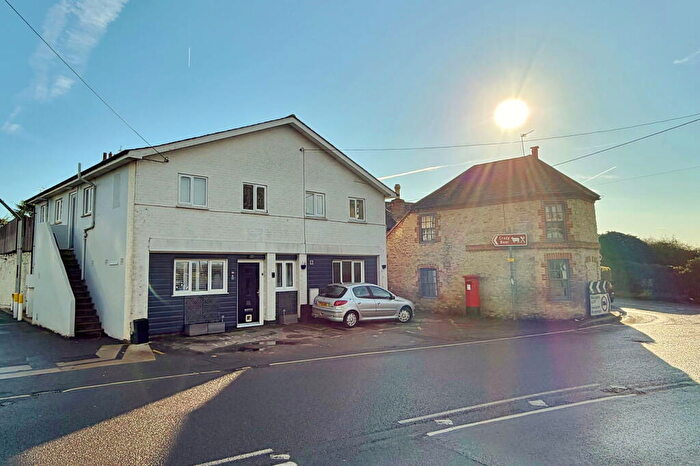
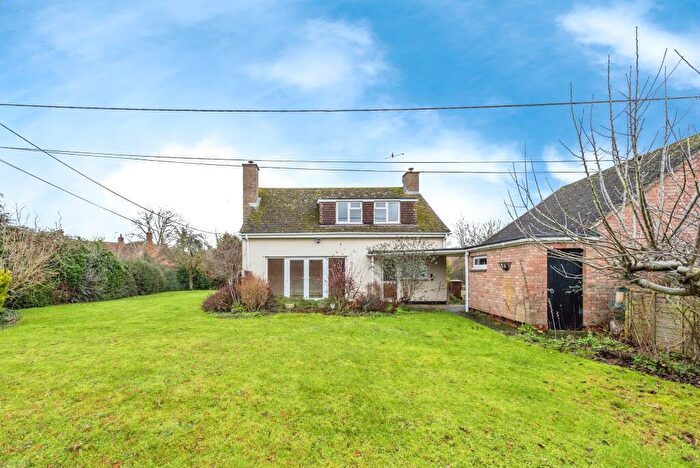
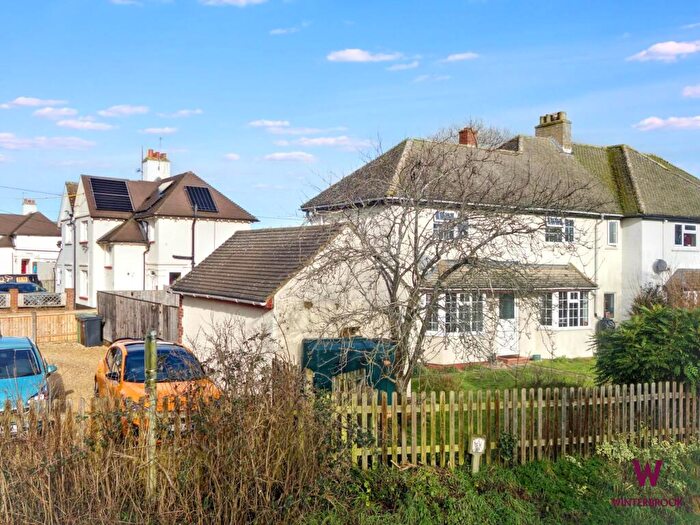
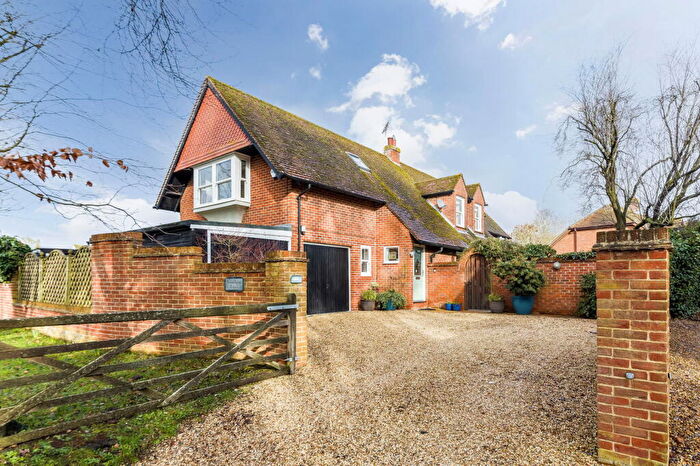
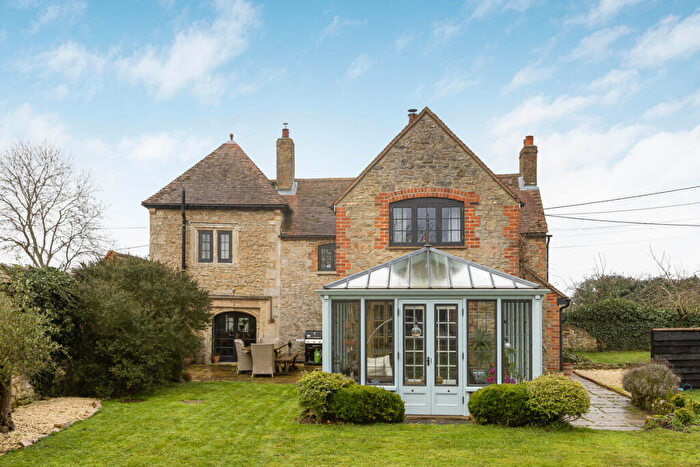
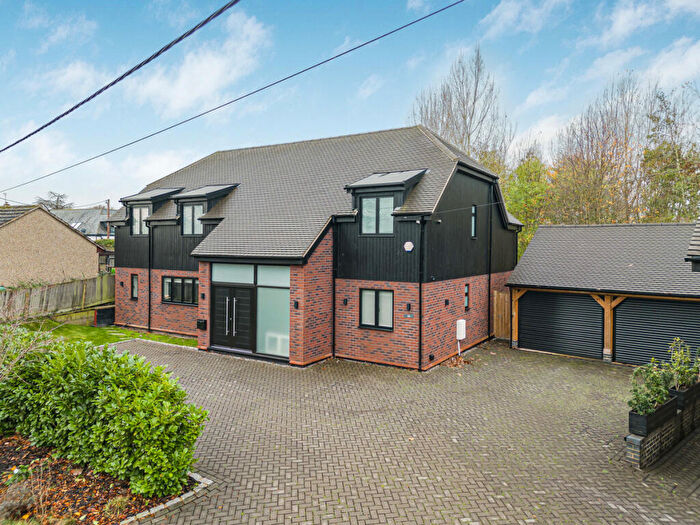
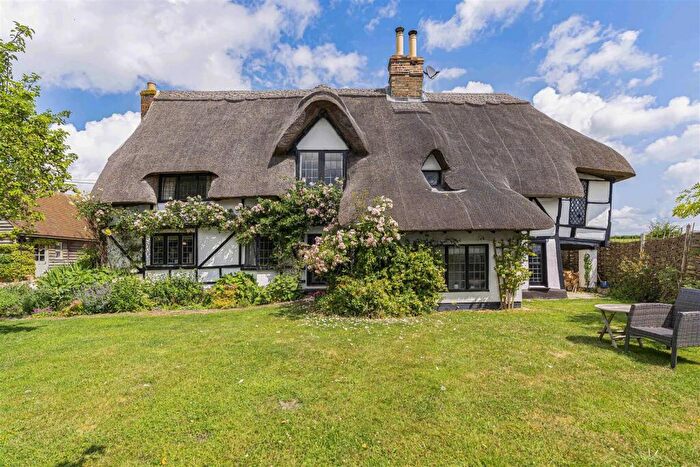
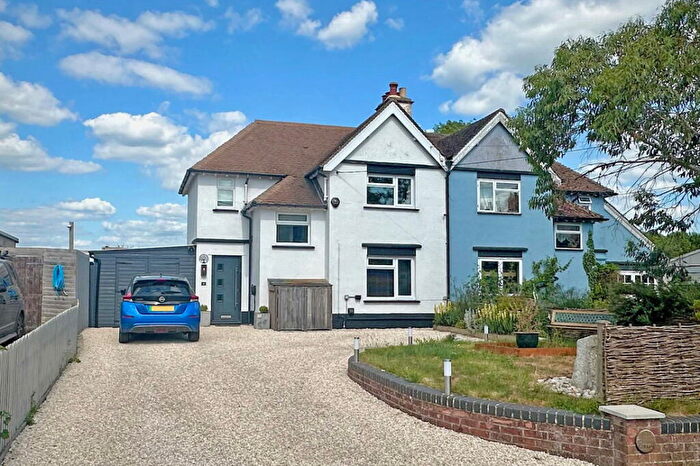
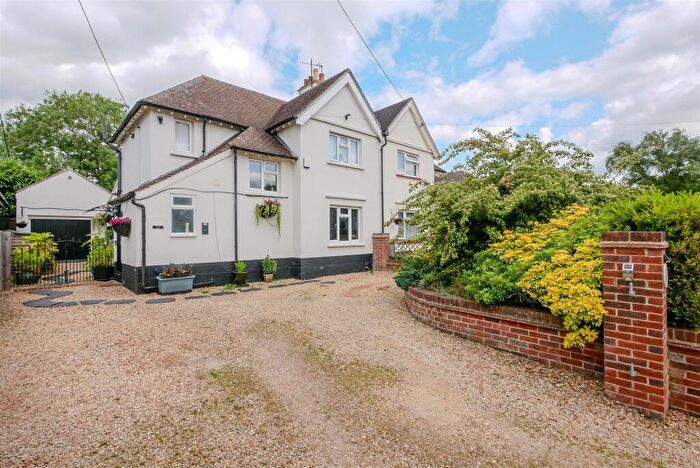
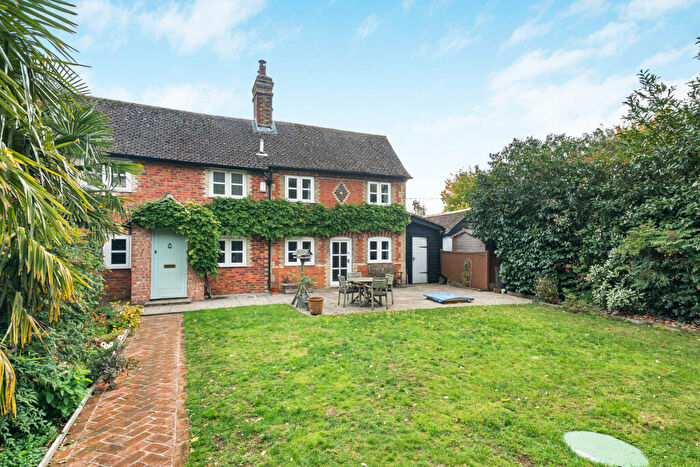
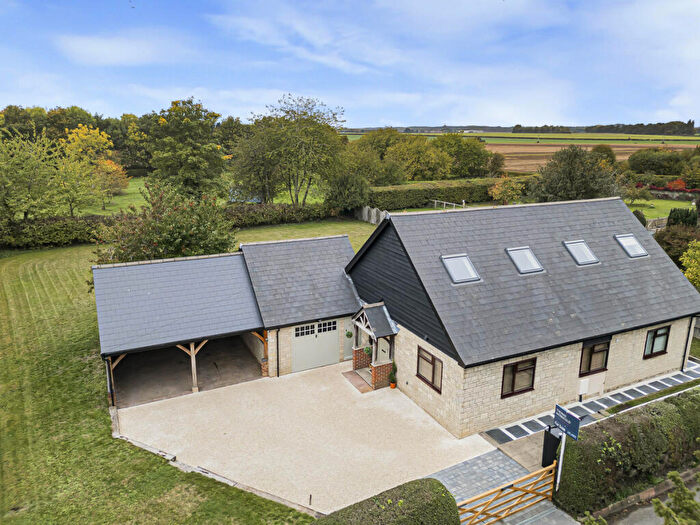
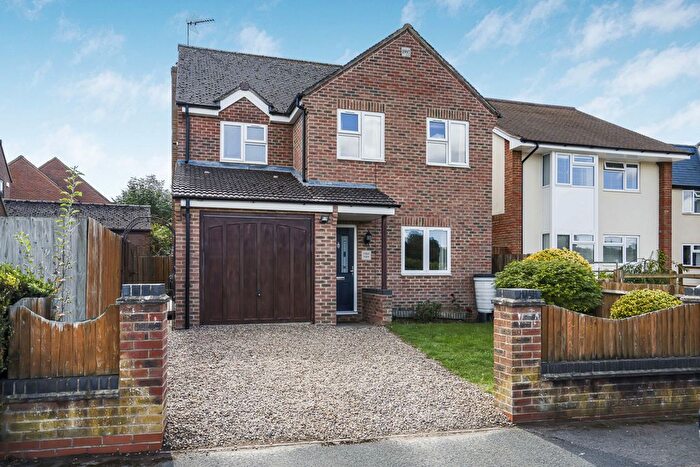
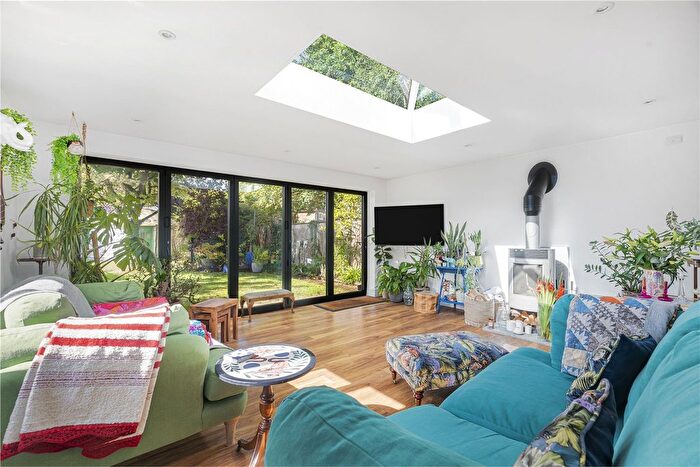
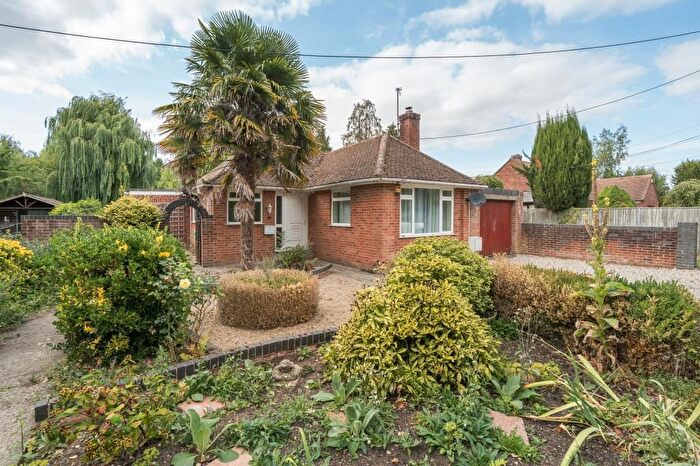
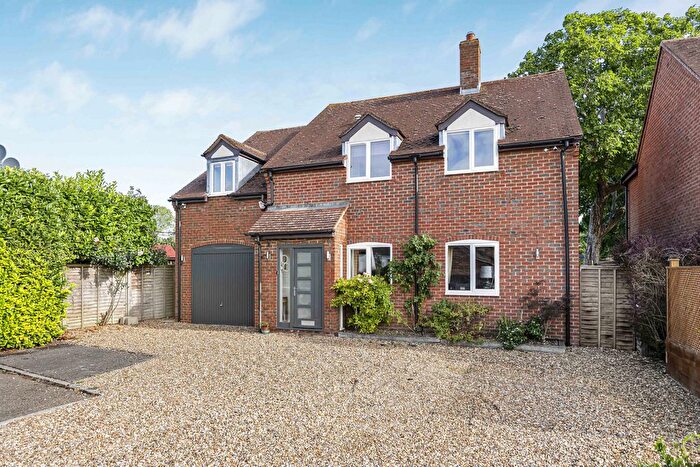
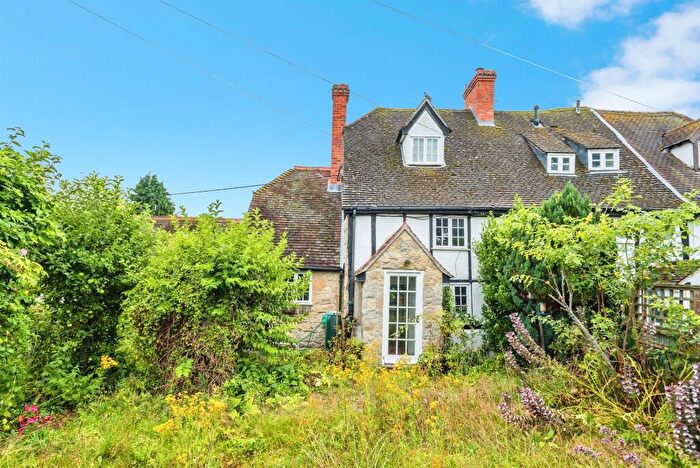
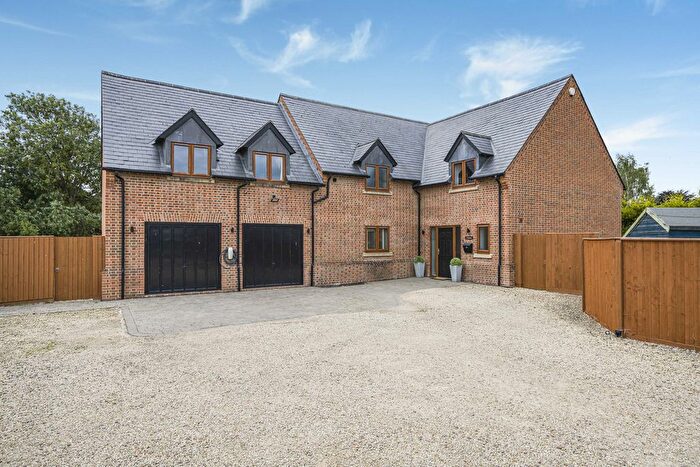
Houses for sale & to rent in Berinsfield, Oxford
House Prices in Berinsfield
Properties in Berinsfield have an average house price of £631,666.00 and had 25 Property Transactions within the last 3 years¹.
Berinsfield is an area in Oxford, Oxfordshire with 299 households², where the most expensive property was sold for £1,350,000.00.
Properties for sale in Berinsfield
Previously listed properties in Berinsfield
Roads and Postcodes in Berinsfield
Navigate through our locations to find the location of your next house in Berinsfield, Oxford for sale or to rent.
| Streets | Postcodes |
|---|---|
| Bear Lane | OX44 7UR |
| Brookhampton Close | OX44 7XR |
| Cat Lane | OX44 7UN |
| Chapmans Close | OX44 7XE |
| Chislehampton Hill | OX44 7XQ |
| Clifton Hampden Road | OX44 7XB |
| Cold Harbour | OX44 7UG |
| Copson Lane | OX44 7TZ |
| Cratlands Close | OX44 7TU |
| Crown Terrace | OX44 7TY |
| Lucerne Drive | OX44 7QT |
| Marylands Green | OX44 7XD |
| Mill Lane | OX44 7UP |
| Milton Road | OX44 7UF |
| Newells Close | OX44 7XS |
| Newington Road | OX44 7US OX44 7UU |
| Pigeon House Close | OX44 7UX |
| School Lane | OX44 7TR |
| School Yard | OX44 7TT |
| Thame Road | OX44 7AG OX44 7TP OX44 7TX |
| The Close | OX44 7TS |
| The Green | OX44 7UA OX44 7UB OX44 7UL OX44 7UW |
| The Laurels | OX44 7XP |
| Warren Hill | OX44 7UT |
| Watlington Road | OX44 7UQ |
| Weir Close | OX44 7UZ |
| OX44 7RR OX44 7UH OX44 7UJ OX44 7UY OX44 7XA OX44 7XF |
Transport near Berinsfield
-
Radley Station
-
Culham Station
-
Appleford Station
-
Didcot Parkway Station
-
Oxford Station
-
Cholsey Station
- FAQ
- Price Paid By Year
- Property Type Price
Frequently asked questions about Berinsfield
What is the average price for a property for sale in Berinsfield?
The average price for a property for sale in Berinsfield is £631,666. This amount is 11% higher than the average price in Oxford. There are 111 property listings for sale in Berinsfield.
What streets have the most expensive properties for sale in Berinsfield?
The streets with the most expensive properties for sale in Berinsfield are Cat Lane at an average of £1,085,000, Watlington Road at an average of £982,000 and Lucerne Drive at an average of £824,000.
What streets have the most affordable properties for sale in Berinsfield?
The streets with the most affordable properties for sale in Berinsfield are Marylands Green at an average of £350,000, Newells Close at an average of £367,500 and Cratlands Close at an average of £370,000.
Which train stations are available in or near Berinsfield?
Some of the train stations available in or near Berinsfield are Radley, Culham and Appleford.
Property Price Paid in Berinsfield by Year
The average sold property price by year was:
| Year | Average Sold Price | Price Change |
Sold Properties
|
|---|---|---|---|
| 2025 | £611,366 | 2% |
10 Properties |
| 2024 | £599,555 | -19% |
9 Properties |
| 2023 | £713,666 | 18% |
6 Properties |
| 2022 | £587,375 | -4% |
10 Properties |
| 2021 | £608,479 | 14% |
23 Properties |
| 2020 | £520,812 | 1% |
8 Properties |
| 2019 | £515,000 | 8% |
3 Properties |
| 2018 | £475,246 | -17% |
14 Properties |
| 2017 | £555,000 | 14% |
9 Properties |
| 2016 | £478,600 | -19% |
10 Properties |
| 2015 | £568,000 | 5% |
8 Properties |
| 2014 | £537,500 | 23% |
14 Properties |
| 2013 | £413,745 | 9% |
11 Properties |
| 2012 | £377,692 | -7% |
13 Properties |
| 2011 | £403,750 | -20% |
4 Properties |
| 2010 | £485,150 | 8% |
10 Properties |
| 2009 | £448,142 | 9% |
7 Properties |
| 2008 | £408,830 | 23% |
7 Properties |
| 2007 | £314,424 | -4% |
14 Properties |
| 2006 | £327,270 | 4% |
22 Properties |
| 2005 | £313,375 | -10% |
8 Properties |
| 2004 | £345,859 | 5% |
11 Properties |
| 2003 | £327,000 | 6% |
8 Properties |
| 2002 | £307,276 | 31% |
14 Properties |
| 2001 | £213,226 | -11% |
17 Properties |
| 2000 | £235,693 | 16% |
8 Properties |
| 1999 | £197,931 | 30% |
22 Properties |
| 1998 | £139,156 | -0,3% |
8 Properties |
| 1997 | £139,562 | -9% |
20 Properties |
| 1996 | £151,529 | 29% |
19 Properties |
| 1995 | £107,916 | - |
12 Properties |
Property Price per Property Type in Berinsfield
Here you can find historic sold price data in order to help with your property search.
The average Property Paid Price for specific property types in the last three years are:
| Property Type | Average Sold Price | Sold Properties |
|---|---|---|
| Semi Detached House | £403,000.00 | 8 Semi Detached Houses |
| Detached House | £766,177.00 | 15 Detached Houses |
| Terraced House | £537,500.00 | 2 Terraced Houses |

