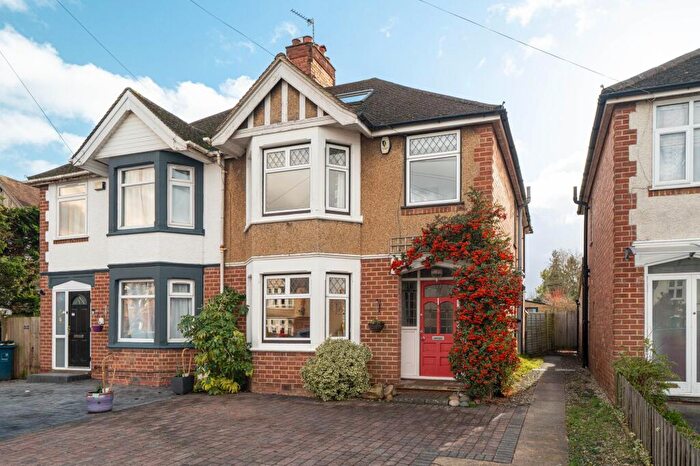
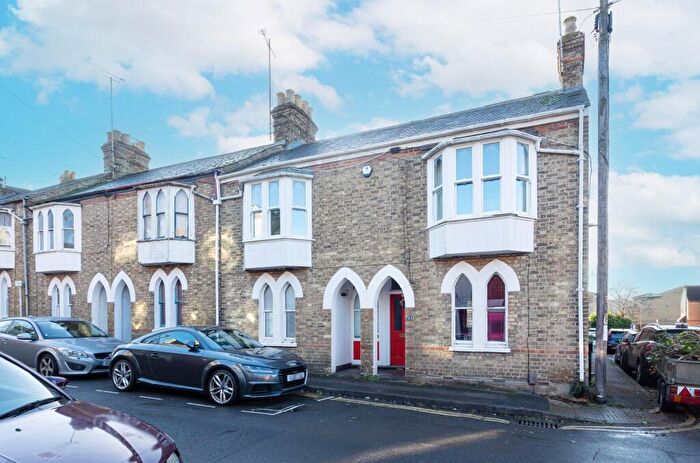
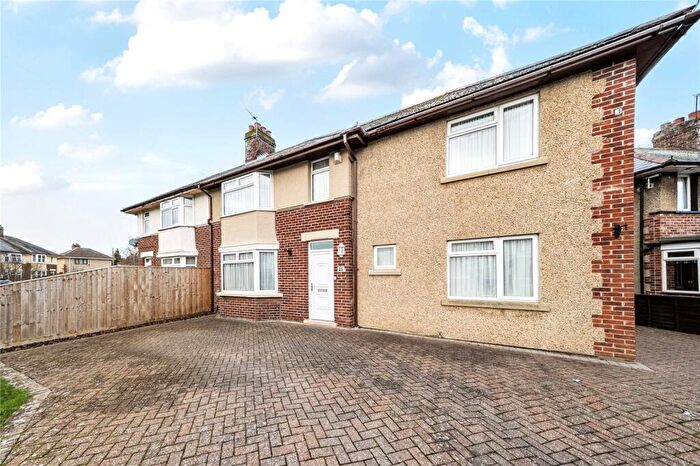
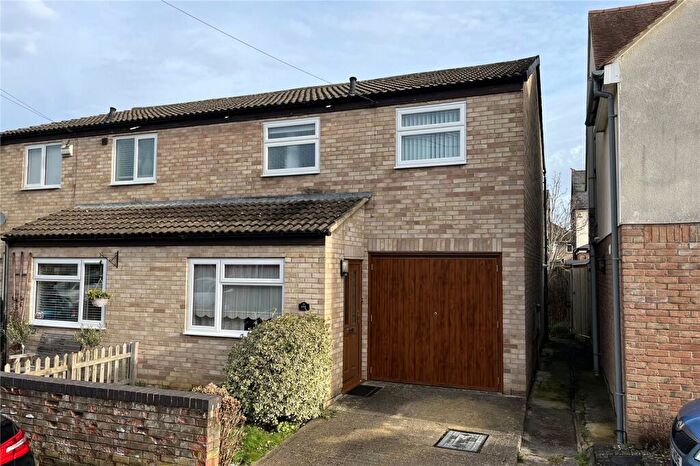
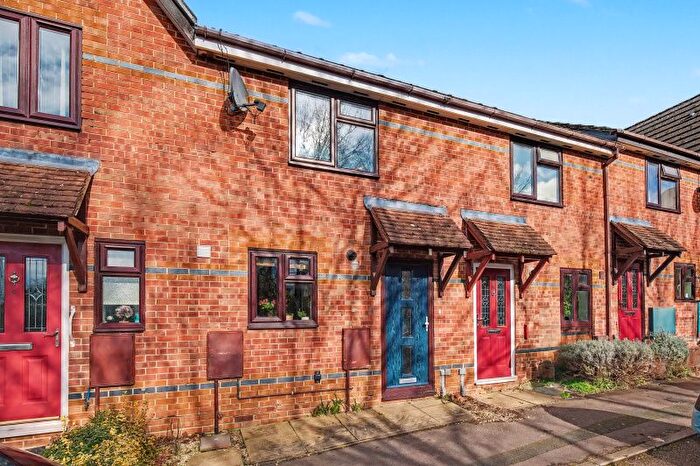
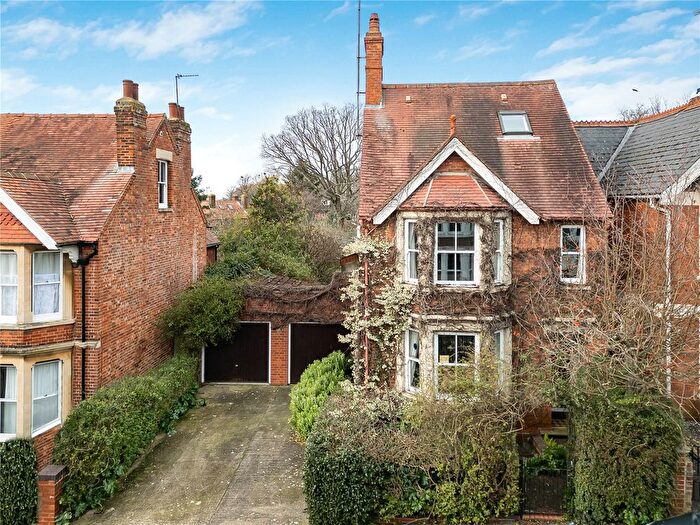
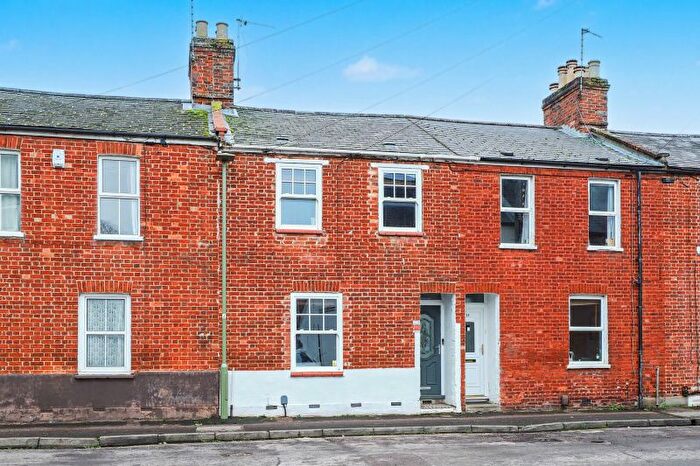
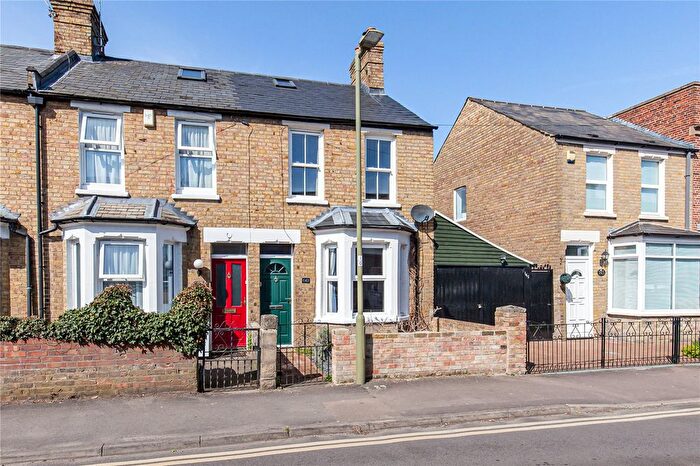
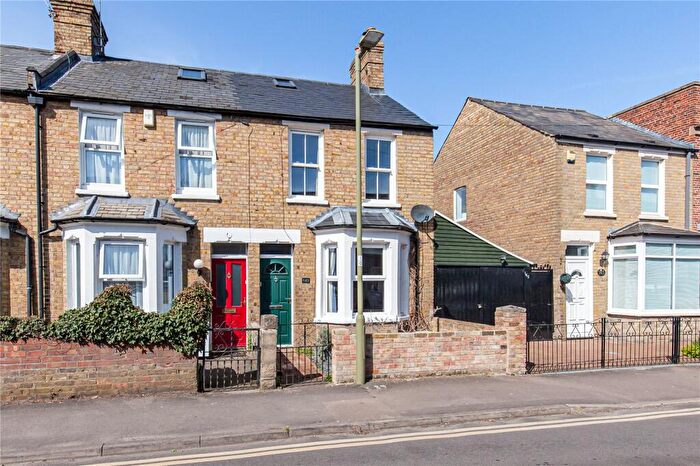
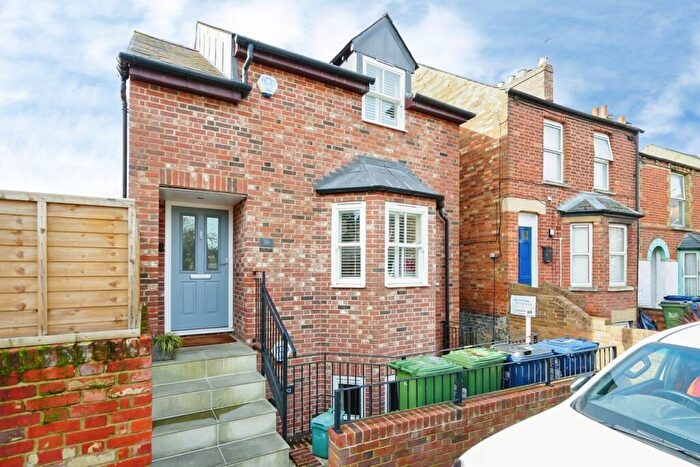
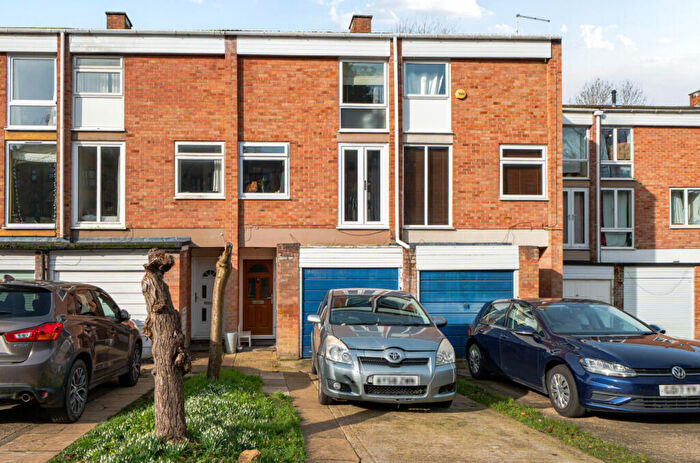
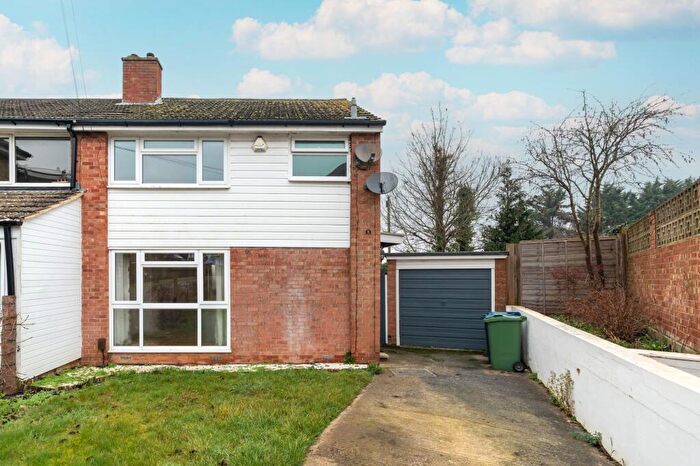
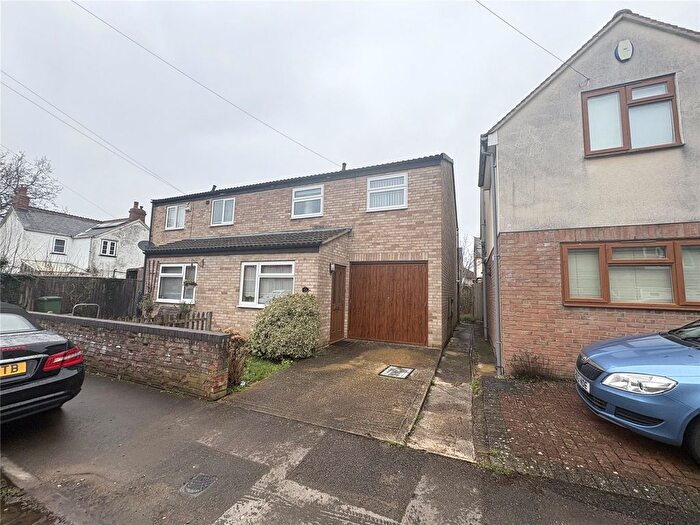
Houses for sale & to rent in Oxford, Oxfordshire
House Prices in Oxford
Properties in Oxford have an average house price of £571,274.00 and had 4,954 Property Transactions within the last 3 years.¹
Oxford is an area in Oxfordshire with 69,385 households², where the most expensive property was sold for £8,100,000.00.
Properties for sale in Oxford
Neighbourhoods in Oxford
Navigate through our locations to find the location of your next house in Oxford, Oxfordshire for sale or to rent.
- Appleton And Cumnor
- Barton And Sandhills
- Berinsfield
- Blackbird Leys
- Carfax
- Chalgrove
- Churchill
- Cowley
- Cowley Marsh
- Forest Hill And Holton
- Garsington
- Great Milton
- Headington
- Headington Hill And Northway
- Hinksey Park
- Holywell
- Iffley Fields
- Jericho And Osney
- Kennington And South Hinksey
- Littlemore
- Lye Valley
- Marston
- North
- North Hinksey And Wytham
- Northfield Brook
- Otmoor
- Quarry And Risinghurst
- Rose Hill And Iffley
- Sandford
- St Clements
- St Margarets
- St Marys
- Summertown
- Sunningwell And Wootton
- Watlington
- Wheatley
- Wolvercote
- Osney & St Thomas
- Carfax & Jericho
- Walton Manor
- Botley & Sunningwell
- Kennington & Radley
- Cumnor
- Cutteslowe & Sunnymead
- Forest Hill & Holton
- Kidlington East
- Headington Hill & Northway
- Barton & Sandhills
- Quarry & Risinghurst
- Launton and Otmoor
- Haseley Brook
- Garsington & Horspath
- Temple Cowley
- Rose Hill & Iffley
- Sandford & the Wittenhams
- Donnington
Transport in Oxford
Please see below transportation links in this area:
- FAQ
- Price Paid By Year
- Property Type Price
Frequently asked questions about Oxford
What is the average price for a property for sale in Oxford?
The average price for a property for sale in Oxford is £571,274. This amount is 20% higher than the average price in Oxfordshire. There are more than 10,000 property listings for sale in Oxford.
What locations have the most expensive properties for sale in Oxford?
The locations with the most expensive properties for sale in Oxford are Holywell at an average of £1,900,000, Forest Hill & Holton at an average of £1,614,875 and Walton Manor at an average of £1,600,000.
What locations have the most affordable properties for sale in Oxford?
The locations with the most affordable properties for sale in Oxford are Cutteslowe & Sunnymead at an average of £288,000, Temple Cowley at an average of £297,500 and Northfield Brook at an average of £316,141.
Which train stations are available in or near Oxford?
Some of the train stations available in or near Oxford are Oxford, Radley and Oxford Parkway.
Property Price Paid in Oxford by Year
The average sold property price by year was:
| Year | Average Sold Price | Price Change |
Sold Properties
|
|---|---|---|---|
| 2025 | £555,315 | -2% |
1,457 Properties |
| 2024 | £564,861 | -5% |
1,937 Properties |
| 2023 | £594,142 | 3% |
1,560 Properties |
| 2022 | £575,177 | 3% |
2,013 Properties |
| 2021 | £559,526 | 1% |
2,597 Properties |
| 2020 | £555,774 | 10% |
1,679 Properties |
| 2019 | £500,257 | -1% |
1,814 Properties |
| 2018 | £506,787 | 0,4% |
1,920 Properties |
| 2017 | £504,903 | 4% |
1,946 Properties |
| 2016 | £483,418 | 5% |
2,152 Properties |
| 2015 | £457,596 | 8% |
2,452 Properties |
| 2014 | £421,489 | 9% |
2,537 Properties |
| 2013 | £383,726 | 1% |
2,288 Properties |
| 2012 | £381,479 | 5% |
1,930 Properties |
| 2011 | £361,404 | 3% |
1,981 Properties |
| 2010 | £349,421 | 12% |
2,205 Properties |
| 2009 | £306,959 | -11% |
2,087 Properties |
| 2008 | £340,555 | 7% |
1,806 Properties |
| 2007 | £318,128 | 8% |
3,003 Properties |
| 2006 | £292,978 | 7% |
3,640 Properties |
| 2005 | £272,952 | 1% |
2,876 Properties |
| 2004 | £270,598 | 7% |
3,116 Properties |
| 2003 | £250,512 | 11% |
2,873 Properties |
| 2002 | £222,422 | 15% |
3,290 Properties |
| 2001 | £189,534 | 8% |
3,417 Properties |
| 2000 | £173,553 | 20% |
2,775 Properties |
| 1999 | £139,575 | 10% |
3,477 Properties |
| 1998 | £125,074 | 13% |
3,229 Properties |
| 1997 | £108,445 | 10% |
3,241 Properties |
| 1996 | £97,706 | -1% |
2,838 Properties |
| 1995 | £98,665 | - |
2,290 Properties |
Property Price per Property Type in Oxford
Here you can find historic sold price data in order to help with your property search.
The average Property Paid Price for specific property types in the last three years are:
| Property Type | Average Sold Price | Sold Properties |
|---|---|---|
| Semi Detached House | £580,198.00 | 1,577 Semi Detached Houses |
| Terraced House | £543,497.00 | 1,381 Terraced Houses |
| Detached House | £930,981.00 | 827 Detached Houses |
| Flat | £337,581.00 | 1,169 Flats |

