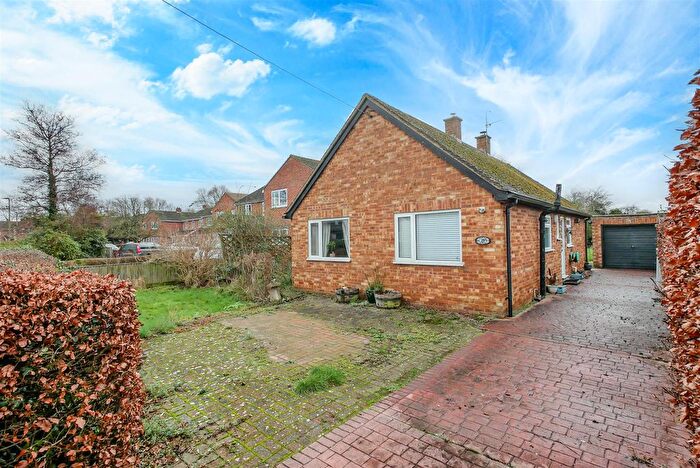
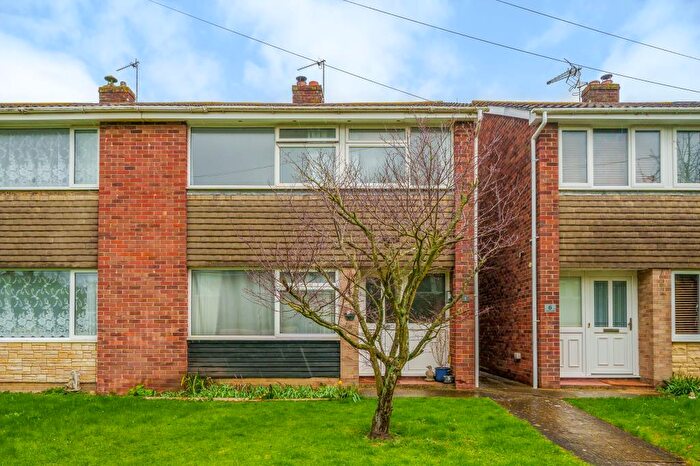
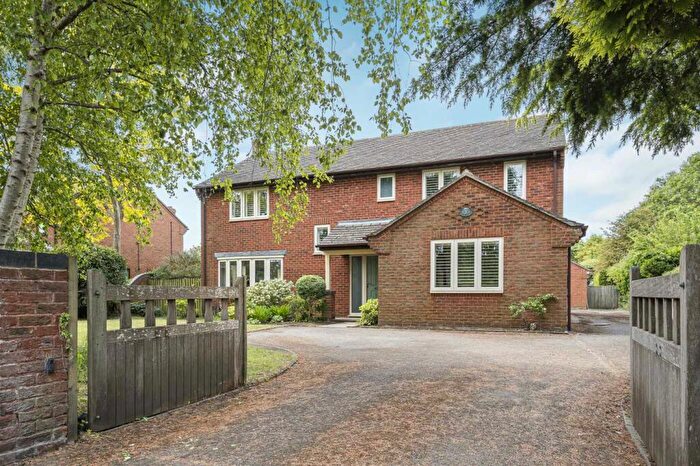
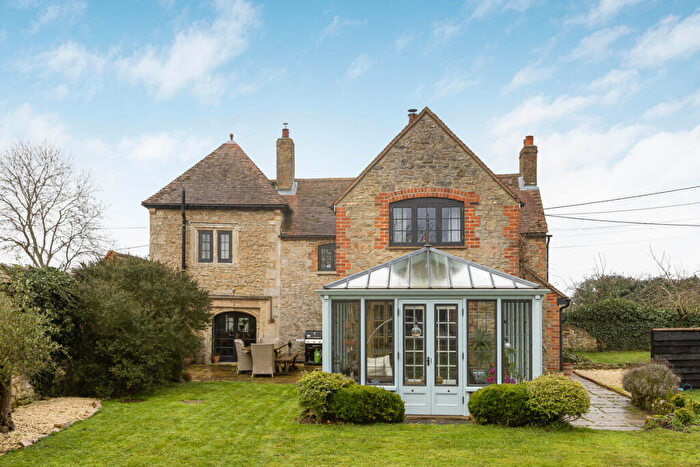
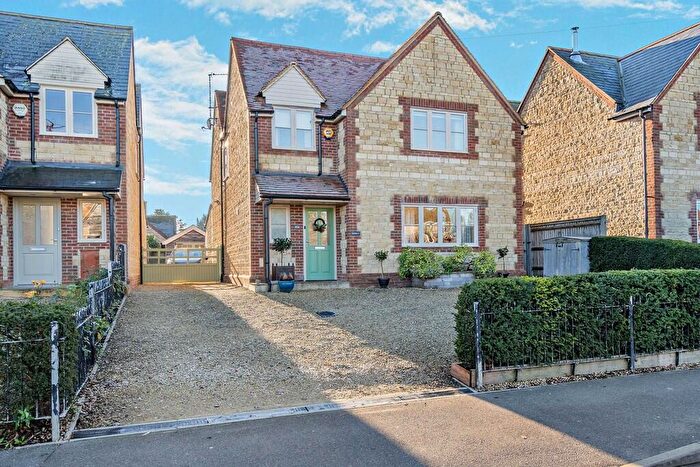
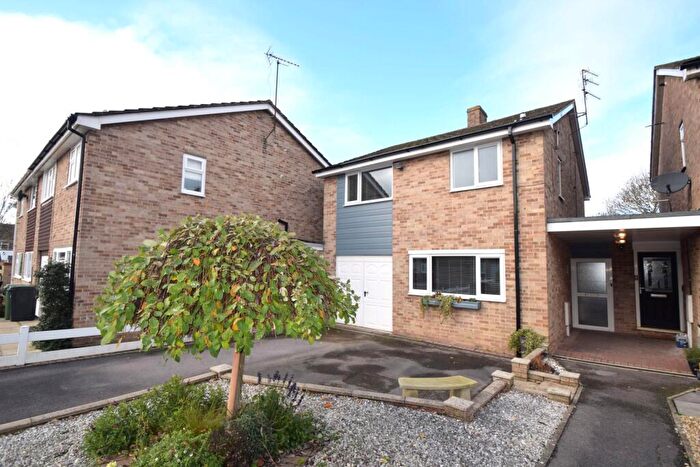
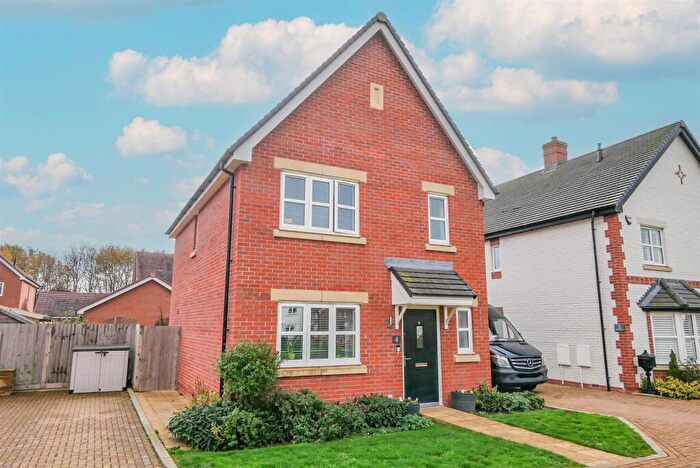
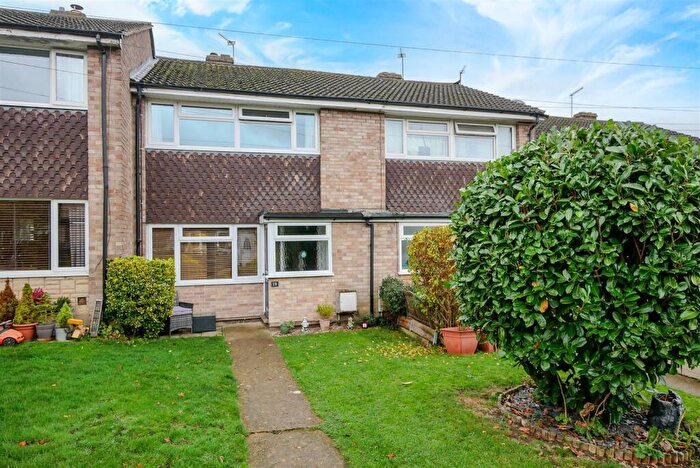
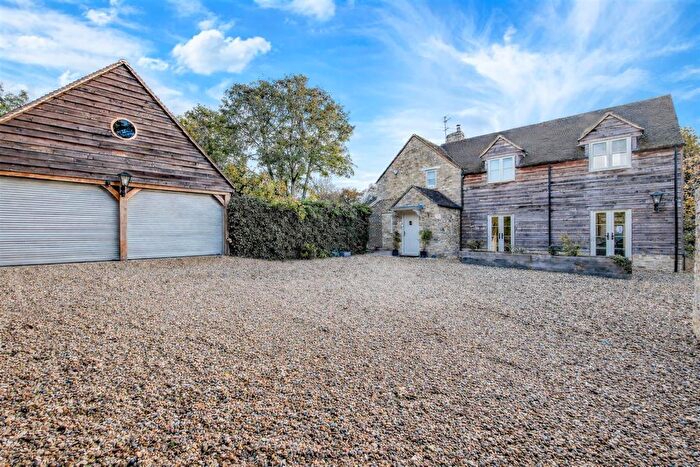
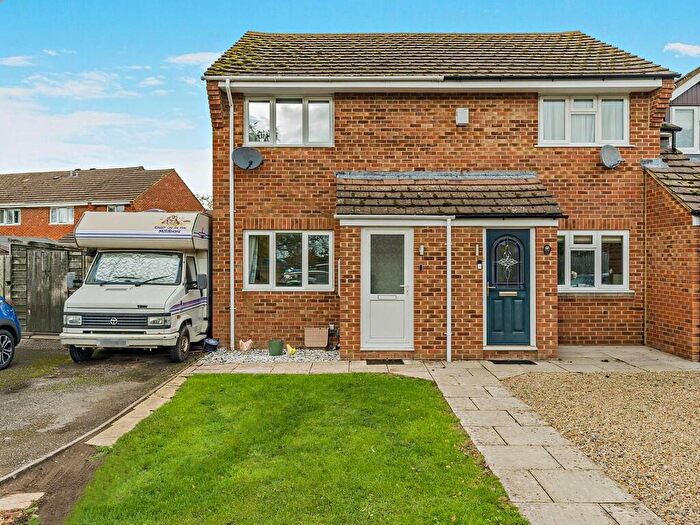
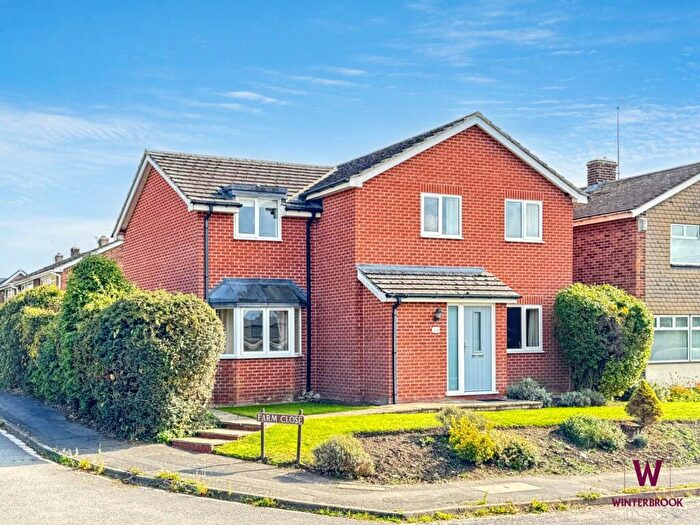
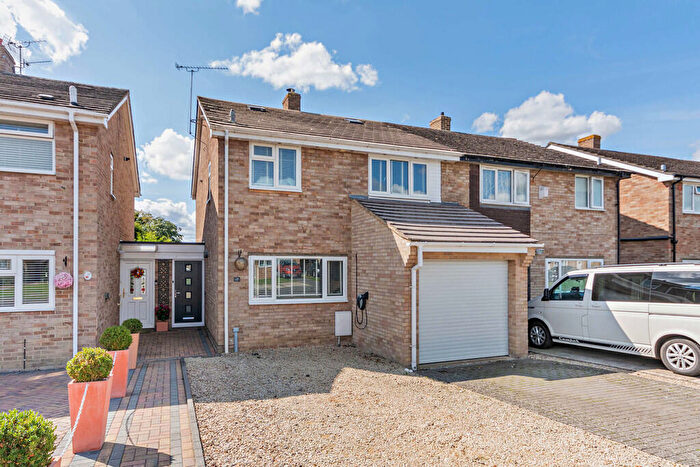
Houses for sale & to rent in Chalgrove, Oxford
House Prices in Chalgrove
Properties in Chalgrove have an average house price of £454,178.00 and had 96 Property Transactions within the last 3 years¹.
Chalgrove is an area in Oxford, Oxfordshire with 1,108 households², where the most expensive property was sold for £1,100,000.00.
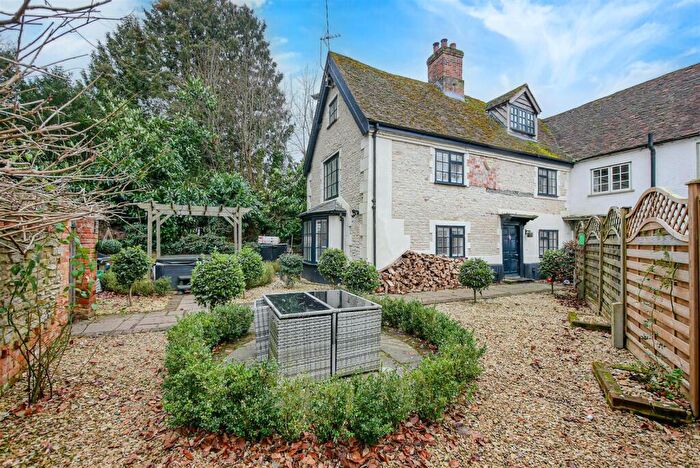
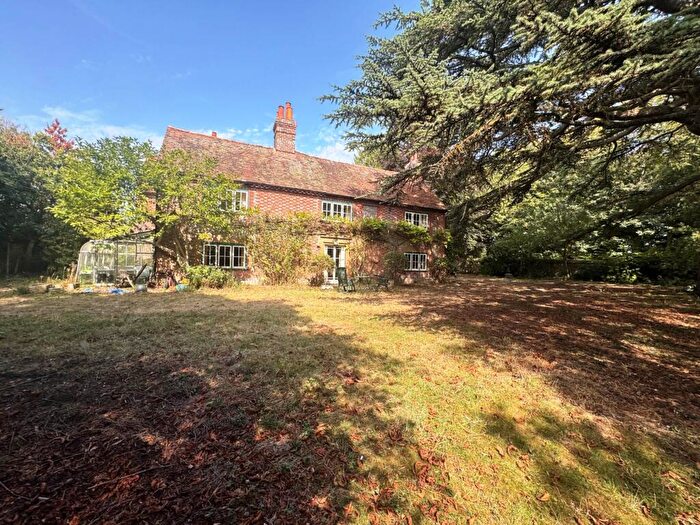
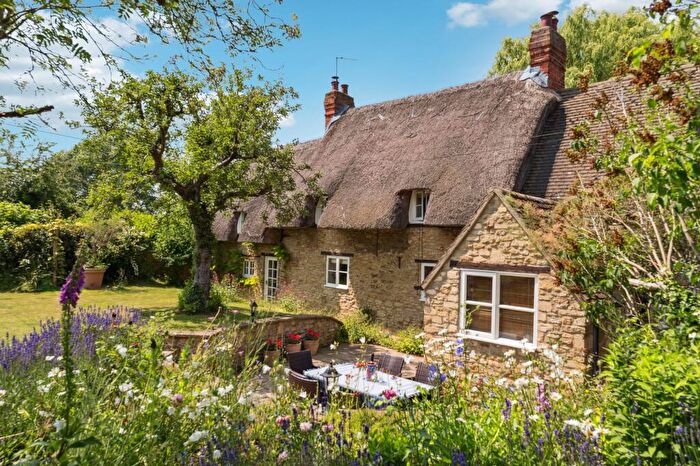
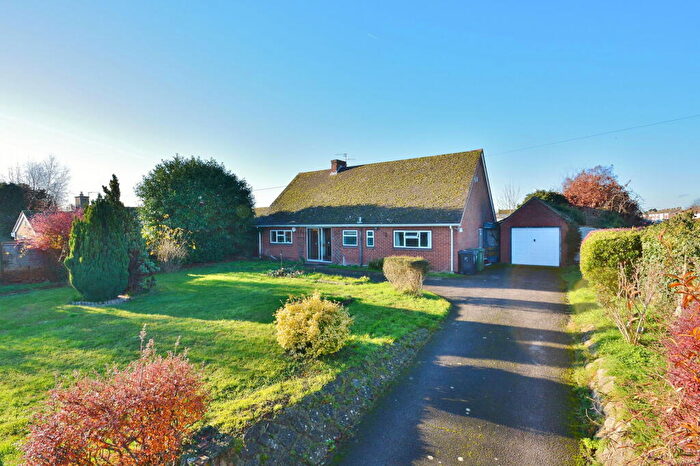
Properties for sale in Chalgrove
Previously listed properties in Chalgrove
Roads and Postcodes in Chalgrove
Navigate through our locations to find the location of your next house in Chalgrove, Oxford for sale or to rent.
| Streets | Postcodes |
|---|---|
| Adeane Road | OX44 7TQ |
| Argosy Close | OX44 7RU |
| Atkins Road | OX44 7BL |
| Bakery Close | OX44 7QW |
| Baronshurst Drive | OX44 7TE |
| Berrick Road | OX44 7RQ |
| Beverley Close | OX44 7RY |
| Bower End | OX44 7YN OX44 7YW |
| Brinkinfield Road | OX44 7QX |
| Broadway Close | OX44 7AY |
| Brookside Estate | OX44 7SH OX44 7SQ |
| Cadwell Lane | OX49 5NU OX49 5PG |
| Chapel Lane | OX44 7RF |
| Chibnall Close | OX44 7SD |
| Chiltern Close | OX44 7RN |
| Church Lane | OX44 7TA OX44 7TB |
| Cinnamon Close | OX44 7QY |
| Clements Road | OX44 7BJ |
| Coles Lane | OX44 7SY |
| Cromwell Close | OX44 7SE |
| Fairfax Road | OX44 7RS OX44 7RX |
| Farm Close | OX44 7RL |
| Flemming Avenue | OX44 7SN OX44 7SW |
| Francis Brown Way | OX44 7BF |
| Franklin Close | OX44 7RG |
| French Laurence Way | OX44 7YE OX44 7YF |
| Grays Close | OX44 7TN |
| Hampden Close | OX44 7SB |
| Hardings | OX44 7TJ |
| Hicks Close | OX44 7BN |
| High Street | OX44 7SJ OX44 7SR OX44 7SS OX44 7ST OX44 7AF OX44 7BS |
| Ireton Close | OX44 7RZ |
| King Close | OX44 7BH |
| Lacey Crescent | OX44 7BP |
| Langley Road | OX44 7SZ |
| Laurel Close | OX44 7RE |
| Liddon Road | OX44 7YH |
| Marley Lane | OX44 7TF |
| Mayfield Close | OX44 7SA |
| Mill Lane | OX44 7SL |
| Millers Close | OX44 7SP |
| Monument Road | OX44 7RH |
| Orchard Close | OX44 7RA |
| Paddock Close | OX44 7RB |
| Poplar Farm Road | OX44 7QZ |
| Quartermain Road | OX44 7SX |
| Rofford Lane | OX44 7QQ |
| Rupert Close | OX44 7RT |
| Rushy Furrow Lane | OX44 7AZ |
| Saw Close | OX44 7TW |
| Sir James Martin Way | OX44 7RJ |
| Sixpenny Lane | OX44 7YD |
| St Marys Close | OX44 7TL |
| Swinstead Court | OX44 7TG |
| The Green | OX44 7SU |
| The Rickyard | OX44 7QU |
| The Springs | OX44 7QN |
| Tower Estate | OX44 7XZ |
| Upperton | OX49 5PD OX49 5PE OX49 5PF |
| Vicarage Close | OX44 7RD |
| Warpsgrove | OX44 7XY |
| Warpsgrove Lane | OX44 7BQ OX44 7RW OX44 7TH |
| Willow Mead | OX44 7TD |
| OX44 7RP OX44 7SG OX49 5NN OX49 5NR OX49 5NS OX49 5NW OX49 5PN |
Transport near Chalgrove
-
Culham Station
-
Radley Station
-
Appleford Station
-
Cholsey Station
-
Didcot Parkway Station
-
Haddenham and Thame Parkway Station
- FAQ
- Price Paid By Year
- Property Type Price
Frequently asked questions about Chalgrove
What is the average price for a property for sale in Chalgrove?
The average price for a property for sale in Chalgrove is £454,178. This amount is 20% lower than the average price in Oxford. There are 399 property listings for sale in Chalgrove.
What streets have the most expensive properties for sale in Chalgrove?
The streets with the most expensive properties for sale in Chalgrove are The Springs at an average of £706,000, Mill Lane at an average of £677,400 and High Street at an average of £616,357.
What streets have the most affordable properties for sale in Chalgrove?
The streets with the most affordable properties for sale in Chalgrove are Grays Close at an average of £298,666, Laurel Close at an average of £308,000 and Flemming Avenue at an average of £328,333.
Which train stations are available in or near Chalgrove?
Some of the train stations available in or near Chalgrove are Culham, Radley and Appleford.
Property Price Paid in Chalgrove by Year
The average sold property price by year was:
| Year | Average Sold Price | Price Change |
Sold Properties
|
|---|---|---|---|
| 2025 | £447,933 | -2% |
35 Properties |
| 2024 | £456,736 | -1% |
38 Properties |
| 2023 | £459,456 | -3% |
23 Properties |
| 2022 | £474,523 | 14% |
43 Properties |
| 2021 | £409,620 | 2% |
50 Properties |
| 2020 | £402,555 | 10% |
38 Properties |
| 2019 | £360,893 | -4% |
33 Properties |
| 2018 | £374,486 | 5% |
37 Properties |
| 2017 | £356,807 | -15% |
39 Properties |
| 2016 | £409,702 | 8% |
42 Properties |
| 2015 | £376,469 | 14% |
49 Properties |
| 2014 | £323,542 | 17% |
49 Properties |
| 2013 | £268,200 | -5% |
31 Properties |
| 2012 | £280,871 | -13% |
42 Properties |
| 2011 | £317,817 | 16% |
36 Properties |
| 2010 | £267,290 | 3% |
32 Properties |
| 2009 | £259,595 | -8% |
35 Properties |
| 2008 | £279,950 | -12% |
21 Properties |
| 2007 | £314,176 | 12% |
49 Properties |
| 2006 | £277,690 | 9% |
48 Properties |
| 2005 | £253,982 | 4% |
45 Properties |
| 2004 | £245,039 | 9% |
62 Properties |
| 2003 | £223,760 | 12% |
44 Properties |
| 2002 | £196,703 | 23% |
66 Properties |
| 2001 | £151,990 | -2% |
60 Properties |
| 2000 | £155,755 | 14% |
48 Properties |
| 1999 | £134,235 | 2% |
75 Properties |
| 1998 | £131,691 | 26% |
53 Properties |
| 1997 | £97,710 | 3% |
76 Properties |
| 1996 | £94,727 | -38% |
75 Properties |
| 1995 | £130,665 | - |
52 Properties |
Property Price per Property Type in Chalgrove
Here you can find historic sold price data in order to help with your property search.
The average Property Paid Price for specific property types in the last three years are:
| Property Type | Average Sold Price | Sold Properties |
|---|---|---|
| Semi Detached House | £404,897.00 | 44 Semi Detached Houses |
| Detached House | £526,123.00 | 42 Detached Houses |
| Terraced House | £368,850.00 | 10 Terraced Houses |

