
Houses for sale & to rent in Hinksey Park, Oxford
House Prices in Hinksey Park
Properties in Hinksey Park have an average house price of £515,392.00 and had 197 Property Transactions within the last 3 years¹.
Hinksey Park is an area in Oxford, Oxfordshire with 2,583 households², where the most expensive property was sold for £1,217,000.00.
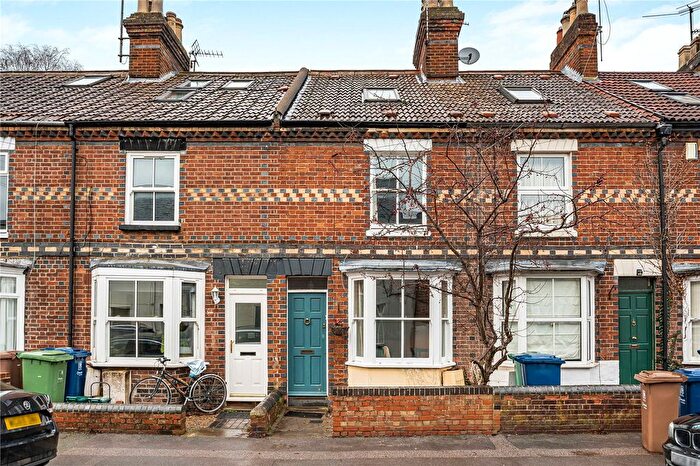
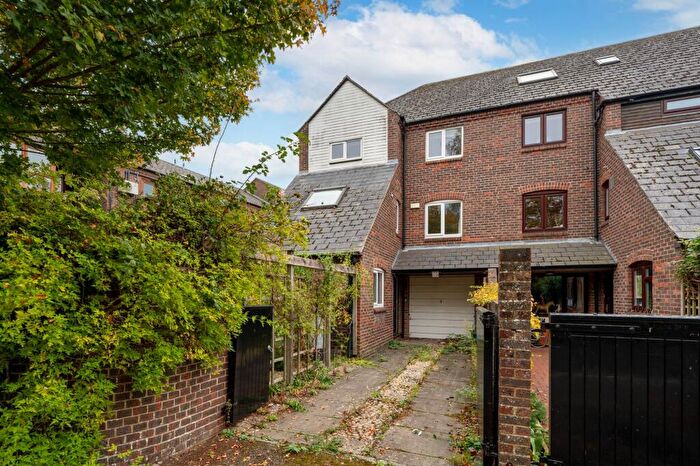
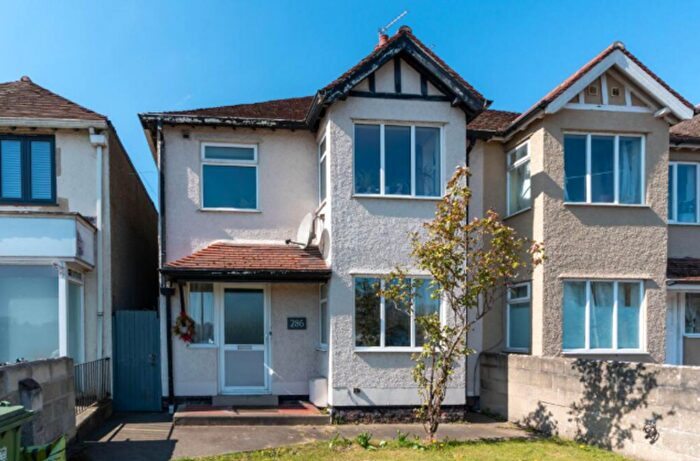
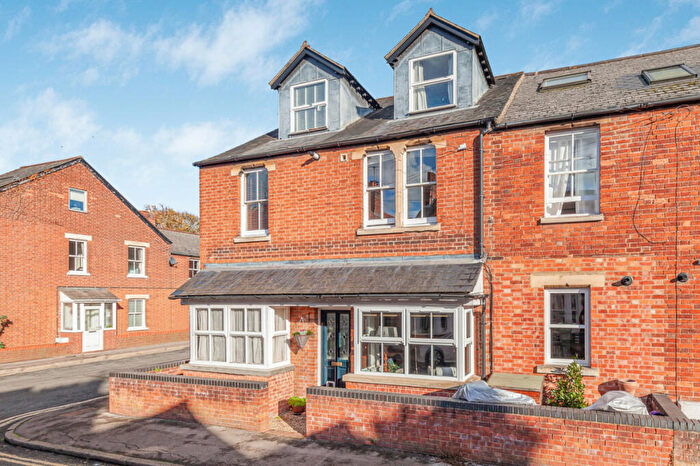
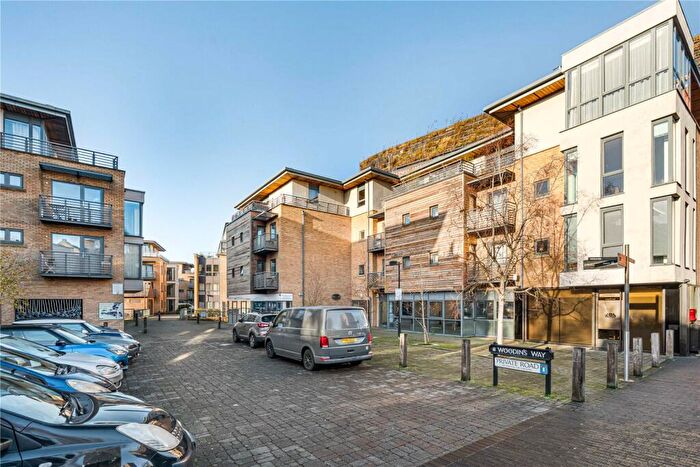
Properties for sale in Hinksey Park
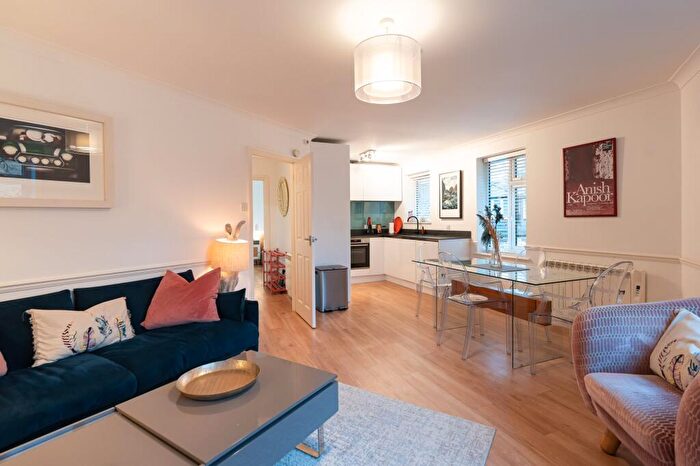
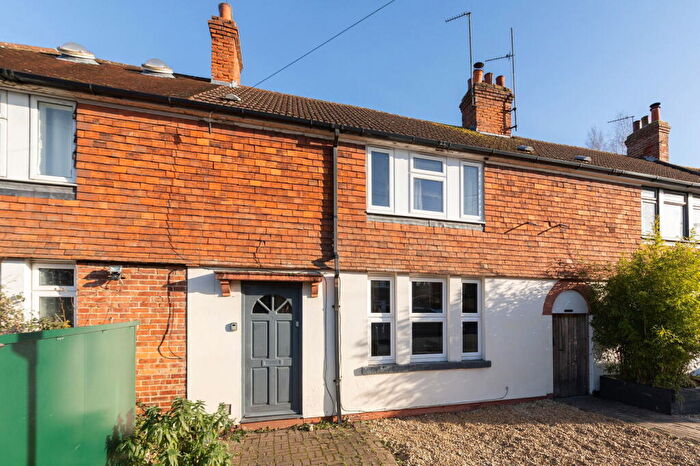
![]()
If you are looking to sell your house, let it out, or receive a property valuation, an expert can help you.
Click the button below to get started.


Roads and Postcodes in Hinksey Park
Navigate through our locations to find the location of your next house in Hinksey Park, Oxford for sale or to rent.
| Streets | Postcodes |
|---|---|
| Abingdon Road | OX1 4PE OX1 4PL OX1 4PR OX1 4PX OX1 4PZ OX1 4RA OX1 4SP OX1 4TA OX1 4TE OX1 4TH OX1 4TJ OX1 4TQ OX1 4XF OX1 4XG OX1 4LD OX1 4LE OX1 4PD OX1 4PN OX1 4PP OX1 4PS OX1 4PW OX1 4PY OX1 4SR OX1 4XD OX1 4XN OX1 4XP |
| Baltic Wharf | OX1 4JX |
| Bertie Place | OX1 4XH OX1 4XQ |
| Blackfriars Road | OX1 1RP |
| Brook Street | OX1 4LQ OX1 4JT |
| Buckingham Street | OX1 4LH |
| Canning Crescent | OX1 4XA OX1 4XB |
| Chatham Road | OX1 4UY OX1 4UZ |
| Chilswell Road | OX1 4PJ OX1 4PQ OX1 4PU |
| Cobden Crescent | OX1 4LJ OX1 4ND OX1 4LL |
| Dale Close | OX1 1TU |
| Edith Road | OX1 4QA OX1 4QB |
| Egrove Close | OX1 4XU |
| Folly Bridge | OX1 4JU OX1 4JS |
| Fox Crescent | OX1 4UX |
| Friars Wharf | OX1 1RU |
| Gordon Street | OX1 4RJ |
| Gordon Woodward Way | OX1 4XL |
| Grandpont Place | OX1 4NH |
| Green Place | OX1 4RF |
| Hodges Court | OX1 4NX OX1 4NY OX1 4NZ |
| Isis Close | OX1 4XX |
| John Towle Close | OX1 4TY OX1 4TZ |
| Jubilee Terrace | OX1 4LN |
| Kineton Road | OX1 4PG |
| Lake Street | OX1 4RN OX1 4RP OX1 4RR OX1 4RW |
| Leander Way | OX1 4XR |
| Lincoln Road | OX1 4TB |
| Long Ford Close | OX1 4NG OX1 4NJ |
| Longford Close | OX1 4NQ |
| Marlborough Road | OX1 4FR OX1 4FS OX1 4LP OX1 4LR OX1 4LS OX1 4LT OX1 4LU OX1 4LW OX1 4LX OX1 4LY OX1 4LZ |
| Monmouth Road | OX1 4TD |
| Newton Road | OX1 4PT |
| Norreys Avenue | OX1 4SS OX1 4ST |
| Northampton Road | OX1 4TG |
| Oswestry Road | OX1 4TL |
| Peel Place | OX1 4UT |
| Pegasus Grange | OX1 4QE OX1 4QF OX1 4QG OX1 4QQ |
| Preachers Lane | OX1 1RS OX1 1RT |
| Sadler Walk | OX1 1TX |
| Salter Close | OX1 4QD |
| School Place | OX1 4RG |
| Shirelake Close | OX1 1SN OX1 1SW |
| Stewart Street | OX1 4RH |
| Summerfield | OX1 4RU |
| Sunningwell Road | OX1 4SX OX1 4SY OX1 4SZ |
| Thames Street | OX1 1SU OX1 1TS OX1 1TR |
| The Towing Path | OX4 4EL OX1 4UW |
| Trinity Street | OX1 1TN OX1 1TQ OX1 1TY |
| Vicarage Lane | OX1 4RQ |
| Vicarage Road | OX1 4RB OX1 4RD OX1 4RE OX1 4RZ |
| Weirs Lane | OX1 4UR OX1 4US OX1 4UU OX1 4UP |
| Western Road | OX1 4FA OX1 4LF OX1 4LG |
| White House Road | OX1 4QH |
| Whitehouse Road | OX1 4NA OX1 4PA OX1 4QJ |
| Wytham Street | OX1 4SU OX1 4TN OX1 4TR OX1 4TS OX1 4TW |
Transport near Hinksey Park

- FAQ
- Price Paid By Year
- Property Type Price
Frequently asked questions about Hinksey Park
What is the average price for a property for sale in Hinksey Park?
The average price for a property for sale in Hinksey Park is £515,392. This amount is 10% lower than the average price in Oxford. There are 748 property listings for sale in Hinksey Park.
What streets have the most expensive properties for sale in Hinksey Park?
The streets with the most expensive properties for sale in Hinksey Park are Western Road at an average of £882,428, Dale Close at an average of £805,027 and Kineton Road at an average of £787,000.
What streets have the most affordable properties for sale in Hinksey Park?
The streets with the most affordable properties for sale in Hinksey Park are Egrove Close at an average of £189,250, Longford Close at an average of £211,000 and John Towle Close at an average of £277,083.
Which train stations are available in or near Hinksey Park?
Some of the train stations available in or near Hinksey Park are Oxford, Radley and Oxford Parkway.
Property Price Paid in Hinksey Park by Year
The average sold property price by year was:
| Year | Average Sold Price | Price Change |
Sold Properties
|
|---|---|---|---|
| 2025 | £537,158 | 6% |
62 Properties |
| 2024 | £502,847 | -1% |
68 Properties |
| 2023 | £507,982 | -4% |
67 Properties |
| 2022 | £526,966 | 3% |
81 Properties |
| 2021 | £513,007 | 12% |
86 Properties |
| 2020 | £452,466 | 6% |
72 Properties |
| 2019 | £423,894 | -4% |
63 Properties |
| 2018 | £440,028 | -3% |
72 Properties |
| 2017 | £451,079 | 1% |
74 Properties |
| 2016 | £447,109 | 7% |
78 Properties |
| 2015 | £415,668 | 8% |
87 Properties |
| 2014 | £381,052 | 10% |
91 Properties |
| 2013 | £343,160 | 7% |
77 Properties |
| 2012 | £318,604 | 0,2% |
82 Properties |
| 2011 | £318,030 | 4% |
66 Properties |
| 2010 | £304,140 | 9% |
109 Properties |
| 2009 | £277,291 | -15% |
73 Properties |
| 2008 | £319,068 | -4% |
69 Properties |
| 2007 | £332,676 | 17% |
108 Properties |
| 2006 | £276,239 | 6% |
150 Properties |
| 2005 | £259,814 | 1% |
193 Properties |
| 2004 | £257,994 | 13% |
123 Properties |
| 2003 | £225,276 | 8% |
107 Properties |
| 2002 | £207,604 | 9% |
134 Properties |
| 2001 | £189,077 | 12% |
125 Properties |
| 2000 | £167,089 | 20% |
114 Properties |
| 1999 | £134,146 | 3% |
178 Properties |
| 1998 | £130,511 | 6% |
134 Properties |
| 1997 | £122,102 | 11% |
157 Properties |
| 1996 | £108,492 | 14% |
141 Properties |
| 1995 | £93,116 | - |
145 Properties |
Property Price per Property Type in Hinksey Park
Here you can find historic sold price data in order to help with your property search.
The average Property Paid Price for specific property types in the last three years are:
| Property Type | Average Sold Price | Sold Properties |
|---|---|---|
| Semi Detached House | £495,614.00 | 35 Semi Detached Houses |
| Detached House | £638,750.00 | 8 Detached Houses |
| Terraced House | £645,247.00 | 83 Terraced Houses |
| Flat | £359,439.00 | 71 Flats |